. 2018 May 2;19(1):311.
doi: 10.1186/s12864-018-4692-z.

A genome-wide assessment of conserved SNP alleles reveals a panel of regulatory SNPs relevant to the peripheral nerve

Affiliations

A genome-wide assessment of conserved SNP alleles reveals a panel of regulatory SNPs relevant to the peripheral nerve

William D Law et al. BMC Genomics. .

Abstract

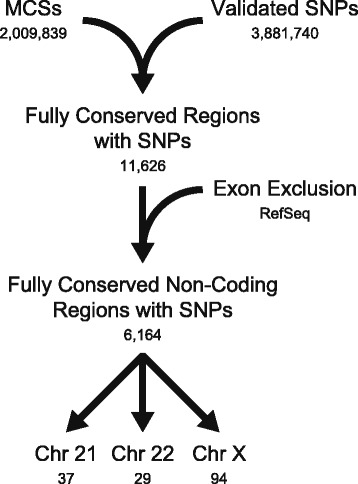
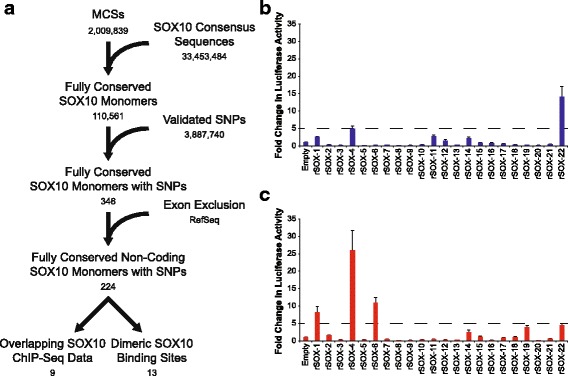
Background: Identifying functional non-coding variation is critical for defining the genetic contributions to human disease. While single-nucleotide polymorphisms (SNPs) within cis-acting transcriptional regulatory elements have been implicated in disease pathogenesis, not all cell types have been assessed and functional validations have been limited. In particular, the cells of the peripheral nervous system have been excluded from genome-wide efforts to link non-coding SNPs to altered gene function. Addressing this gap is essential for defining the genetic architecture of diseases that affect the peripheral nerve. We developed a computational pipeline to identify SNPs that affect regulatory function (rSNPs) and evaluated our predictions on a set of 144 regions in Schwann cells, motor neurons, and muscle cells.

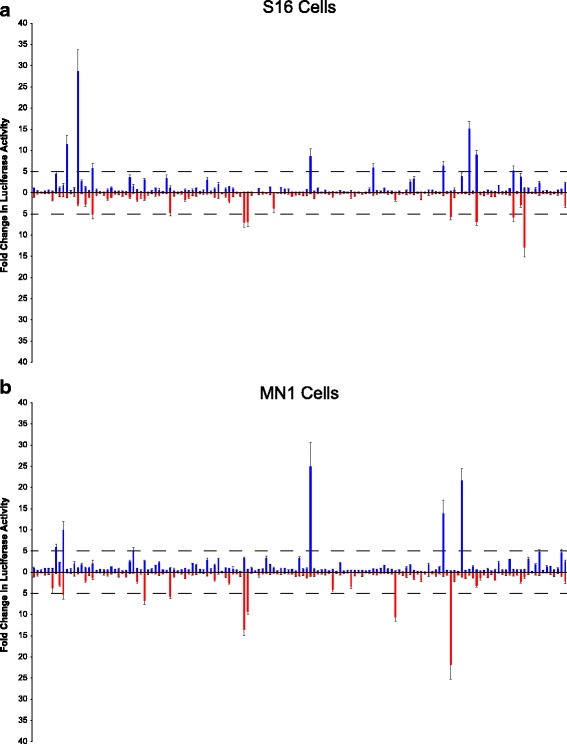
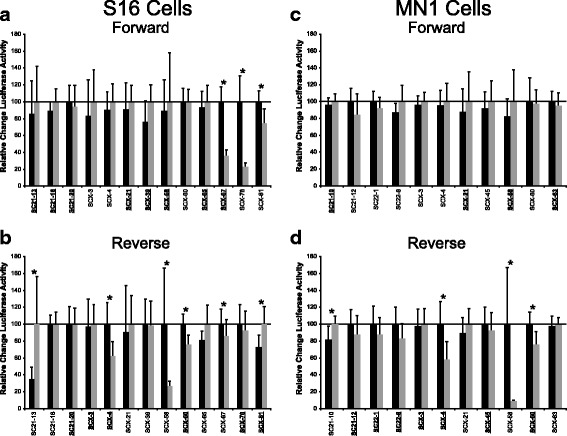
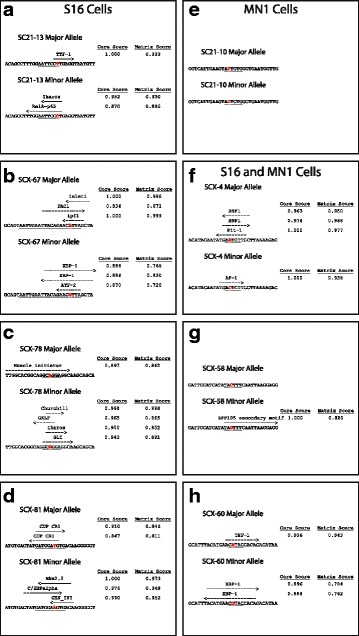
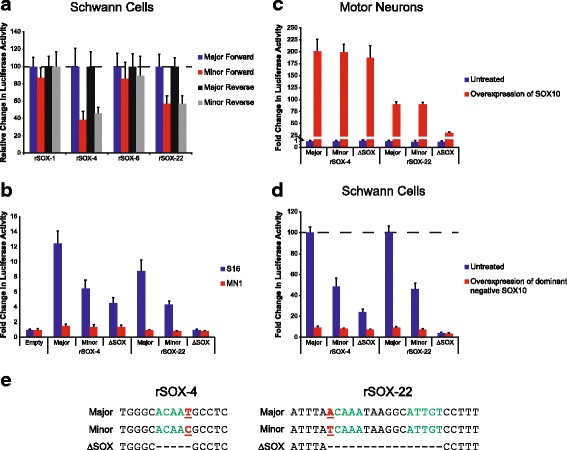
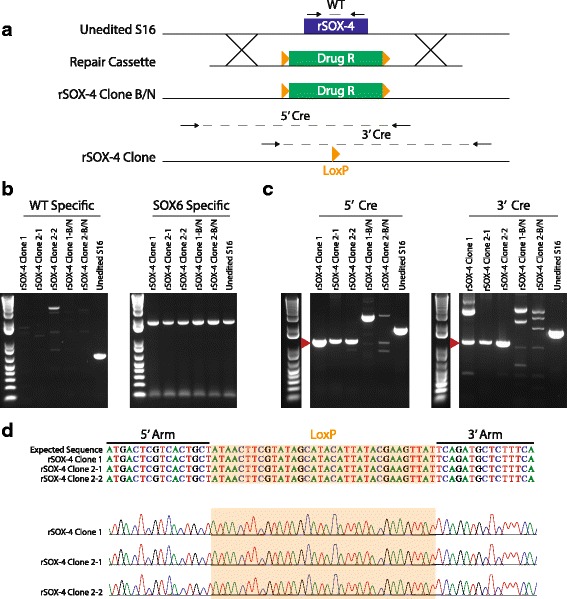
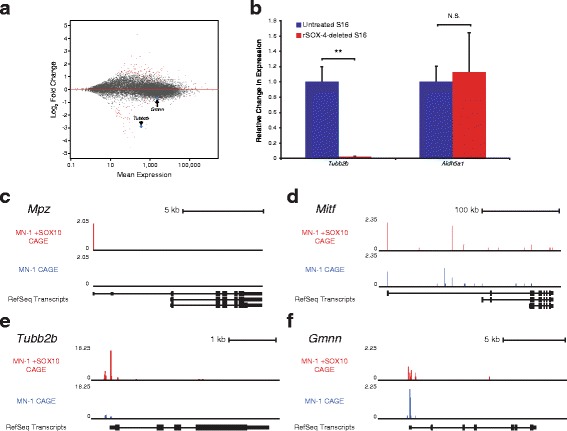
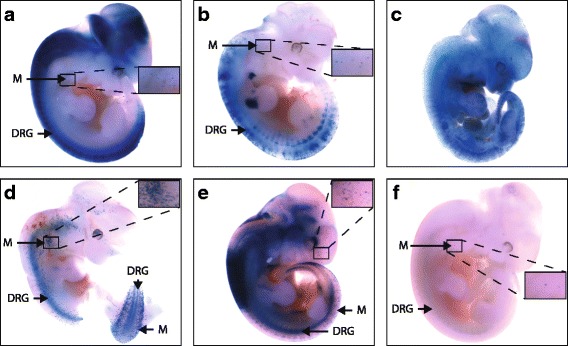
Results: We identified 28 regions that display regulatory activity in at least one cell type and 13 SNPs that affect regulatory function. We then tailored our pipeline to one peripheral nerve cell type by incorporating SOX10 ChIP-Seq data; SOX10 is essential for Schwann cells. We prioritized 22 putative SOX10 response elements harboring a SNP and rapidly validated two rSNPs. We then selected one of these elements for further characterization to assess the biological relevance of our approach. Deletion of the element from the genome of cultured Schwann cells-followed by differential gene expression studies-revealed Tubb2b as a candidate target gene. Studying the enhancer in developing mouse embryos revealed activity in SOX10-positive cells including the dorsal root ganglia and melanoblasts.

Conclusions: Our efforts provide insight into the utility of employing strict conservation for rSNP discovery. This strategy, combined with functional analyses, can yield candidate target genes. In support of this, our efforts suggest that investigating the role of Tubb2b in SOX10-positive cells may reveal novel biology within these cell populations.

Keywords: Enhancer; Neuropathy; Peripheral nerve; SOX10; Schwann cells; TUBB2B; Transcriptional regulation.


Conflict of interest statement

Ethics approval and consent to participate

The mouse transgenic experiments were performed by the University of Michigan Transgenic Animal Core and were approved by the University of Michigan Committee on the Use and Care of Animals.

Competing interests

The authors declare that they have no competing interests.

Publisher’s Note

Springer Nature remains neutral with regard to jurisdictional claims in published maps and institutional affiliations.

Figures

Fig. 1
Fig. 1
A computational pipeline to identify putative regulatory SNPs. The human, mouse, and chicken genomes were aligned, and genomic segments five base-pairs in length or greater and identical in all three species were identified to compile a panel of multiple-species conserved sequences (MCSs). Overlap between the MCS dataset and validated ‘by-frequency’ SNPs from db SNP130 was determined. Exons were excluded using RefSeq entries, and a pilot set of 160 regions were identified on chromosomes 21, 22, and X. The number of regions in each resulting dataset are indicated below the label
Fig. 2
Fig. 2
Activity of a pilot set of putative regulatory elements on chromosomes 21, 22, and X in Schwann cells and motor neurons. 144 genomic regions containing the major SNP allele were cloned upstream of a luciferase reporter gene and tested in the forward (blue bars) or reverse (red bars) orientation in S16 (a) and MN1 cells (b). The activity of each genomic segment is expressed relative to a control vector with no genomic insert (first bar in each frame). Dashed lines indicate a five-fold increase in activity over the control vector, and error bars show standard deviations
Fig. 3
Fig. 3
Eight genomic regions display allele-specific differences in regulatory activity in Schwann cells and motor neurons. a and b The activity of the major (black bars) and minor (grey bars) alleles of the 13 regions active in Schwann cells (Fig. 2) were evaluated in the forward (a) or reverse (b) orientation. c and d The major and minor alleles of the 11 genomic segments active in MN1 cells were compared as in panels a and b. In all panels, the allele with higher luciferase activity was set to “100”, error bars represent standard deviations, bold and underlined text indicate the orientation(s) that were active in the experiments shown in Fig. 2, and asterisks indicate a significant change in activity (p ≤ 0.05)
Fig. 4
Fig. 4
TRANSFAC predictions of transcription factor binding sites. TRANSFAC was used to assess for differential TFBS predictions between the major and minor alleles of SNP alleles that had a significant effect on luciferase activity. Results are shown for four regions active only in S16 cells [SC21-13 (a), SCX-67 (b), SCX-78 (c), and SCX-81 (d)], one region active only in MN1 cells [SC21-10 (e)], and three regions active in both cell types [SCX-4 (f), SCX-58 (g), and SCX-60 (h)]. Thirty base pairs surrounding the SNP alleles of each region were submitted to TRANSFAC. Dashed arrows indicate the position and direction of the predicted TFBS, the name of the transcription factor is indicated above each arrow, and the core and matrix scores are indicated at the right. Only allele-specific TFBS predictions are displayed. Underlined base pairs indicate conserved bases, and SNP alleles are highlighted in red and bold text
Fig. 5
Fig. 5
Identification of putative SOX10 response elements in Schwann cells. a All SOX10 consensus sequences in the human genome were identified, and these data were intersected with multiple-species conserved sequences (MCSs; see text for details). Overlap between the conserved SOX10 monomers and SNPs validated ‘by-frequency’ from dbSNP 130 was determined, and exons were excluded using RefSeq entries. This dataset of conserved, non-coding SOX10 monomers harboring a SNP was prioritized by identifying regions overlapping SOX10 ChIP-Seq data or by identifying a dimeric SOX10 consensus sequence. The number of regions in each resulting dataset is indicated under the label. b and c The 22 genomic segments from panel A were cloned upstream of a luciferase reporter gene and tested in the forward (b; blue bars) and reverse (c; red bars) orientation in SOX10-positive S16 cells. The activity of each genomic segment is expressed relative to a control vector with no genomic insert (‘Empty’ in b and c). Four regions displayed greater than five-fold activity (indicated by the dashed line) in at least one orientation. Error bars indicate standard deviations
Fig. 6
Fig. 6
rSOX-4 and rSOX-22 harbor regulatory SNPs that alter the function of SOX10 consensus sequences. a Each allele of the four rSOX regions that displayed regulatory activity were assessed in both orientations in S16 cells. Bar colors indicate major allele in the forward orientation (blue), minor allele in the forward orientation (red), major allele in the reverse orientation (black), and minor allele in the reverse orientation (grey). For each orientation, the minor allele is expressed relative to the major allele. b Major, minor, and binding-site-deleted (ΔSOX) alleles of rSOX-4 and rSOX-22 were evaluated for regulatory activity in the more active orientation, in S16 (blue bars) or MN1 (red bars) cells. c-d Major, minor, and binding-site-deleted (ΔSOX alleles of rSOX-4 and rSOX-22 were evaluated for regulatory activity with and without a construct to express wild-type SOX10 in MN1 cells (c) or dominant-negative SOX10 in S16 cells (d). Data from untreated cells are in blue and data from cells co-transfected with a SOX10 expression construct are in red. In all panels, error bars indicate standard deviations. e Sequence variants studied within rSOX-4 and rSOX-22. The nucleotides surrounding each variant studied [major allele, minor allele, and deleted SOX10 binding site (∆SOX)] are shown. SOX10 monomeric sites unaffected by the SNP are displayed in green. The SNP within the SOX10 monomeric site is indicated by bold, underlined, and red text. Deleted nucleotides are indicated by dashes. Each variant name is displayed on the left and corresponds to the sequences tested in previous panels
Fig. 7
Fig. 7
CRISPR-mediated deletion of rSOX-4 in S16 cells. a A cartoon depiction of the rSOX-4 deletion strategy is shown. The 651 bp rSOX-4 enhancer in unedited cultured rat Schwann (S16) cells is indicated by a blue rectangle. The drug resistance repair cassette is indicated by a green rectangle and the loxP sequences by orange triangles. Cross lines represent homologous regions for recombination-mediated repair during CRISPR/Cas9-mediated mutagenesis. Arrows represent the diagnostic PCR primers used in panels B and C, with the name of the corresponding PCR product [wild-type (WT), 5’ Cre, and 3’ Cre] above. b Wild-type (WT) specific PCR was performed on the three Cre:GFP-positive rSOX-4 clonal cell lines (Clone 1, Clone 2-1, Clone 2-2), the parental, pre Cre:GFP transfection (Clone1 – B/N and Clone 2 – B/N) cell lines, and unedited S16 cells. A SOX6-specific PCR was performed (right panel) as a DNA positive control. c Diagnostic PCR was performed across the 5′ (left panel) and 3′ (right panel) recombination sites for the same samples indicated in panel B using external (genomically anchored) and internal (repair template anchored) primers. The red arrowhead indicates the expected size for a single loxP scar. d Sequencing results from the rSOX-4 clonal cell lines in panel C (red arrowhead). The expected sequence was generated in silico based on proper recombination, Cre excision, and presence of a loxP scar
Fig. 8
Fig. 8
rSOX-4 regulates expression of Tubb2b. a MA plot demonstrating differential gene expression between the rSOX-4 deleted cells and untreated S16 cells. Each dot represents a gene and red dots indicate a significant difference in expression between the two cell populations (adjusted p < 0.05). Genes with a positive or negative log2 fold change demonstrated higher or lower expression in the rSOX-4 cells line compared to the untreated S16 cells, respectively. Tubb2b and Gmnn are indicated by arrows. b Digital droplet PCR (ddPCR) was performed to validate RNA-Seq findings for Tubb2b. Data from the untreated cells are shown by the blue bars, and data from rSOX-4-deleted cells are shown by the red bars. Aldh5a1 was used as a control gene, which showed no expression changes between the two cell populations. c-f SOX10 increases Tubb2b expression in heterologous cells. MN1 cells were transfected with a construct to express GFP-SOX10, sorted into GFP-positive and GFP-negative populations, and subjected to cap analysis gene expression (CAGE). CAGE reads mapping to the Mpz (c), Mitf (d), Tubb2b (e), and Gmnn (f) loci were normalized to reads per million and are indicated in red (SOX10-positive cells) and blue (SOX10-negative cells). RefSeq-annotated transcripts at each locus in the mouse genome (mm10) are shown in black and, in each case, are transcribed from left to right
Fig. 9
Fig. 9
rSOX-4 directs in vivo enhancer activity during mouse development. Six transient transgenic mouse embryos were generated to harbor a transgene with rSOX-4 directing LacZ expression (a-f). Mice were sacrificed at E11.5, and expression patterns were determined by visual examination under a stereoscope (M = melanoblasts and DRG = dorsal root ganglia). Image cutouts show an enlarged section to demonstrate melanoblast expression

References

    1. Zhang F, Lupski JR. Non-coding genetic variants in human disease. Hum Mol Genet. 2015;24(R1):R102–R110. doi: 10.1093/hmg/ddv259. - DOI - PMC - PubMed
    1. Lettice LA, Heaney SJ, Purdie LA, Li L, de Beer P, Oostra BA, Goode D, Elgar G, Hill RE, de Graaff E. A long-range Shh enhancer regulates expression in the developing limb and fin and is associated with preaxial polydactyly. Hum Mol Genet. 2003;12(14):1725–1735. doi: 10.1093/hmg/ddg180. - DOI - PubMed
    1. Consortium EP. An integrated encyclopedia of DNA elements in the human genome. Nature. 2012;489(7414):57–74. doi: 10.1038/nature11247. - DOI - PMC - PubMed
    1. Lee D, Gorkin DU, Baker M, Strober BJ, Asoni AL, McCallion AS, Beer MA. A method to predict the impact of regulatory variants from DNA sequence. Nat Genet. 2015;47(8):955–961. doi: 10.1038/ng.3331. - DOI - PMC - PubMed
    1. Skre H. Genetic and clinical aspects of Charcot-Marie-Tooth's disease. Clin Genet. 1974;6(2):98–118. doi: 10.1111/j.1399-0004.1974.tb00638.x. - DOI - PubMed