. 2018 May 1;16(1):114.
doi: 10.1186/s12967-018-1489-4.

Postprandial increase in serum CA125 as a surrogate biomarker for early diagnosis of ovarian cancer

Affiliations

Postprandial increase in serum CA125 as a surrogate biomarker for early diagnosis of ovarian cancer

Zhuowei Gu et al. J Transl Med. .

Abstract

Background: CA125 is a prevalently used serum biomarker for detecting ovarian cancer over the last three decades. However, it has a significant deficiency in screening for early-stage cancer. With the purpose of exploring an effective approach to improve its performance in early diagnosis, we investigated the postprandial fluctuation pattern of cancer-derived CA125 and the underlying mechanism.

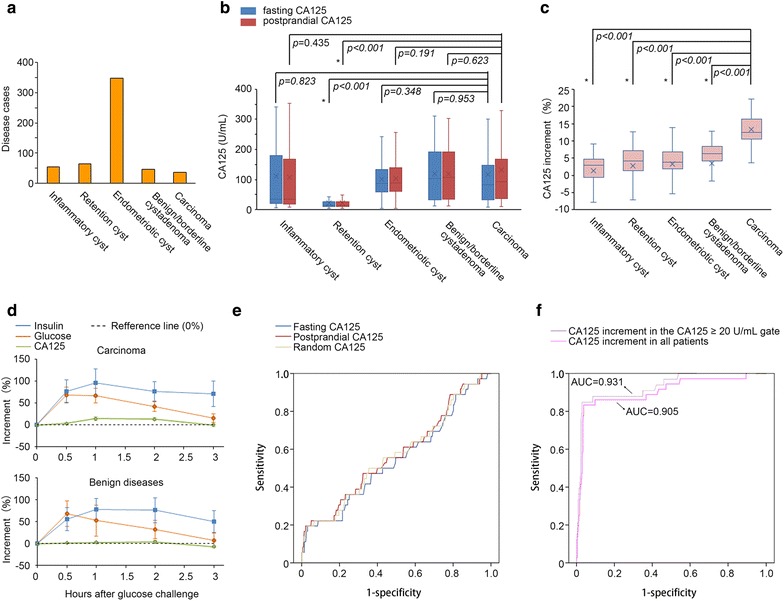
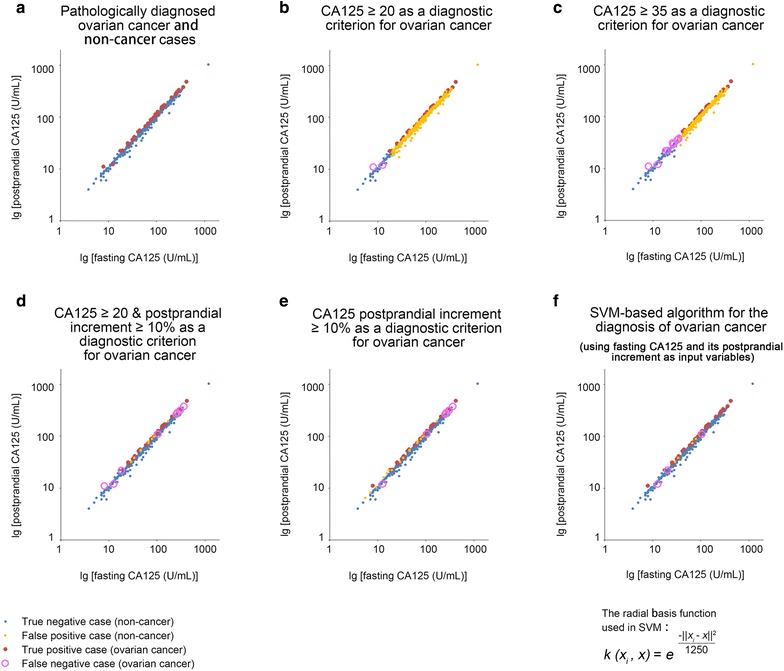
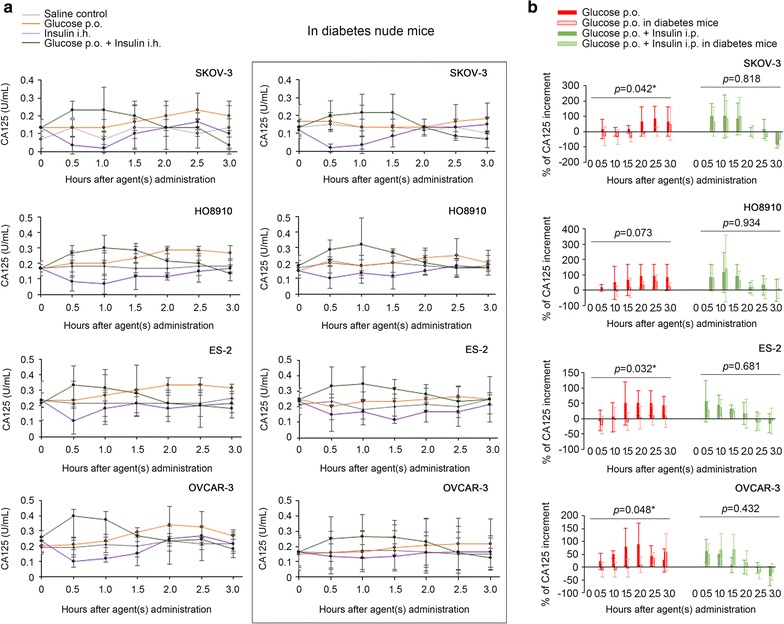
Methods: In two medical centers, 551 patients sonographically diagnosed with ovarian (adnexal) cysts (< 5 cm in diameter) were enrolled and divided into five disease groups (pelvic inflammatory cysts, retention cysts, endometrioma, benign/borderline cystadenoma and malignant cysts). The subtle differences in 1-h postprandial serum CA125 increases were compared between disease groups. A support vector machine (SVM)-based algorithm was used for refining the performance of CA125 postprandial increment. Ovarian cancer xenograft animal and cancer cell models were used to recapitulate the clinical findings and reveal the molecular basis of postprandial blood glucose and insulin in invoking the synthesis/secretion/re-absorption of CA125.

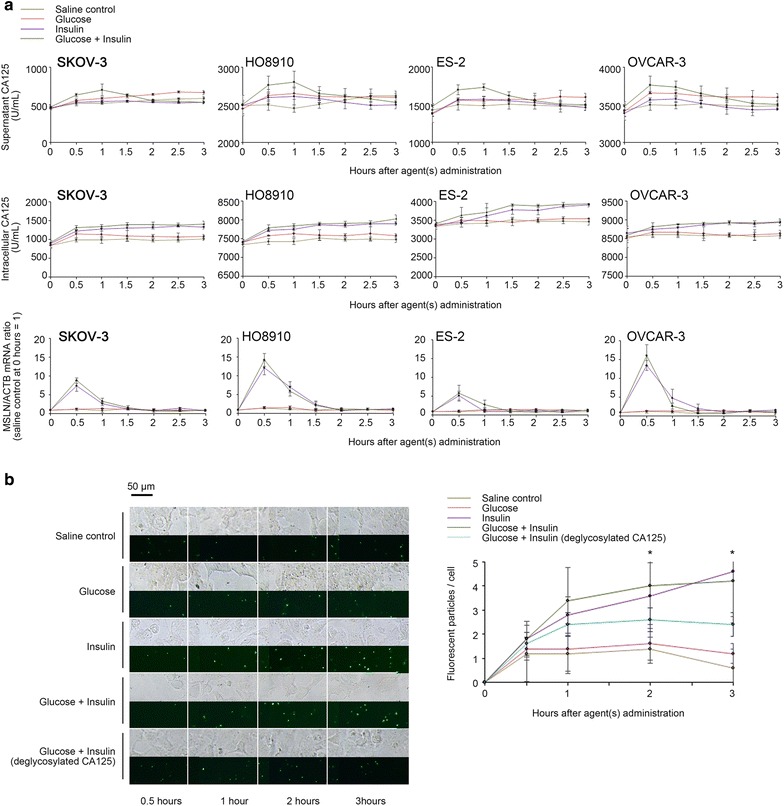
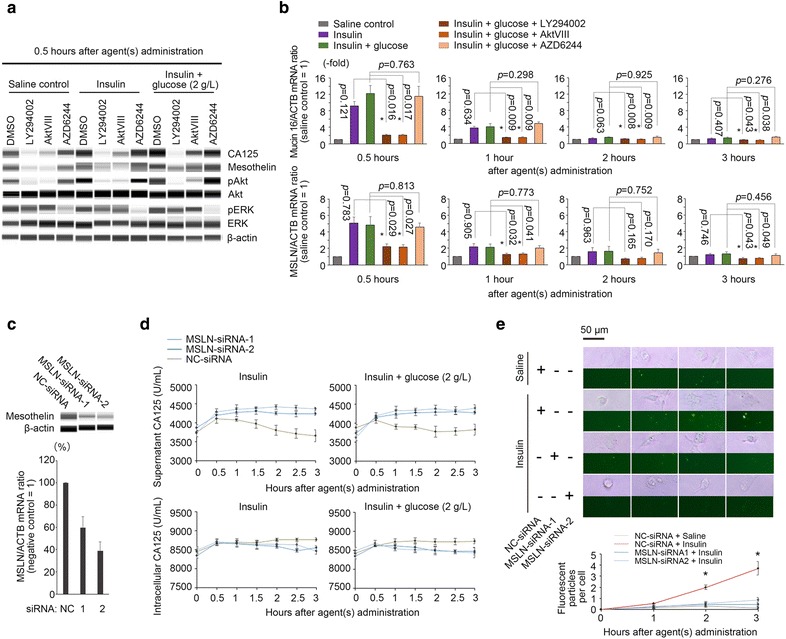
Results: Patients with ovarian cancer presented the highest postprandial increment 13.3 ± 0.7% (mean ± standard deviation) among the five disease groups. Using a CA125 increment ≥ 10% criterion, the sensitivity, specificity, positive predictive value (PPV) and negative predictive value (NPV) reached 83.3, 96.3, 61.1 and 98.8%, respectively, for early-stage ovarian cancer. This performance was further improved by the SVM-based CA125-increment algorithm, which exhibited 91.7% sensitivity, 99.2% specificity, 89.2% PPV and 99.4% NPV. Both modalities manifested diagnostic advantages over the traditional CA125 test (75.0% sensitivity, 25.4% specificity, 6.6% PPV and 93.6% NPV at the cut-off of 35 U/mL). Regarding the molecular basis, the postprandial blood glucose and insulin-invoked overexpression of Mucin 16 (encoding CA125) were demonstrated in animal and cancer cell models, which were mediated by the PI3K-Akt pathway. Nevertheless, a Mesothelin-based CA125 re-absorption behavior was noted in the treated cancer cells, which contributed to the over-drop following the postprandial peak of serum CA125.

Conclusions: Cancer-derived serum CA125 possesses a unique and distinctive postprandial pattern, that distinguishes it from the common CA125 elevation in a benign disease condition. The dynamic measurement/assessment strategy can achieve a discriminatory power superior to that of a static test.

Keywords: Akt; CA125; Fasting; Glucose; Increment; Insulin; Mesothelin; Ovarian cancer; PI3K; Postprandial.


Figures

Fig. 1
Fig. 1
The clinical, metabolic and diagnostic characteristics of increases in postprandial serum CA125. a Disease distribution characteristics of the enrolled patients. b Boxplots for the fasting and postprandial CA125 levels of the five disease groups. c Boxplots for the postprandial CA125 increases of the five disease groups. d Metabolic characteristics of blood glucose, serum insulin and CA125 in the cancer and non-cancer patients. e ROC curves of random, fasting and postprandial CA125 in the study population. f ROC curves of the CA125 increment in the CA125 ≥ 20 U/mL gate and in all patients of the study population (i.e., CA125 ≥ 0 U/mL gate). *Statistical significance (two-sided Student’s t test)
Fig. 2
Fig. 2
Performances of CA125-based diagnostic criteria in the study population. a The 2-dimensional distribution characteristics of fasting and postprandial CA125 in the enrolled patients. Most of the true positive cases (ovarian cancer cases, red dots) were located at the upper left margin of the scatter diagram, which exhibited higher postprandial increments in CA125 than the true negative cases (non-cancer cases, blue dots). b The diagnostic performance of the CA125 ≥ 20 U/mL criterion. c The diagnostic performance of the CA125 ≥ 35 U/mL criterion. d The diagnostic performance of the CA125 ≥ 20 U/mL plus CA125 increment ≥ 10% criteria. The number of false positive cases (orange dots) was greatly reduced by including an additional CA125 increment ≥ 10% criterion compared with the performance of the CA125 ≥ 20 U/mL criterion alone. e The diagnostic performance of the CA125 increment ≥ 10% criterion. The number of false negative cases (pink circles, 8 cases) was reduced (to 6 cases) by deleting the CA125 ≥ 20 U/mL criterion. f The diagnostic performance of the SVM-based CA125-increment algorithm (the exact form of the RBF kernel function is given). The false positive cases were reduced to 4 cases; and the false negative cases were reduced to 3 cases. The sensitivity (91.7%) and specificity (99.2%) for detecting early-stage ovarian cancer reached their maxima by using this algorithm
Fig. 3
Fig. 3
Postprandial serum CA125 fluctuations mimicked in animal models. a Shown are the time-dependent serum CA125 fluctuations after administration of saline, glucose, insulin or glucose plus insulin in SKOV-3, HO8910, ES-2 and OVCAR-3 xenograft nude mouse models. b Comparison of the percentages of serum CA125 increase after administration of glucose or glucose plus insulin among nude mouse models and diabetes nude mouse models. The oral glucose-induced increments in serum CA125 were significantly lower in the diabetes animal models than in the non-diabetes animal models. *Statistical significance (ANOVA)
Fig. 4
Fig. 4
Glucose and insulin-invoked synthesis, secretion and re-absorption of CA125 in cancer cell models. a The time-dependent fluctuations of extracellular and intracellular CA125 levels and Mucin 16/ACTB mRNA ratios after administration of saline, glucose, insulin and glucose plus insulin in SKOV-3, HO8910, ES-2 and OVCAR-3 cancer cell lines, respectively (note: Mucin 16/ACTB mRNA ratios were set to 1 for saline controls). b The time-dependent re-absorption of Alexa Fluor 488-labeled CA125 in cultured ovarian cancer cells (SKOV-3) under saline, high-glucose, insulin-only, high-glucose plus insulin or CA125-deglycosylation conditions. The per cell fluorescent particles were presented as the mean of the particles counted in 20 randomly selected ovarian cancer cells under a ×200 microscopic field. The addition of insulin (i.e., the insulin-only and high-glucose plus insulin groups) significantly accelerate re-absorption of CA125 protein (green particles) into the cytoplasm of cultured cells, while the deglycosylation of CA125 protein partially blocked the re-absorption-promoting effect of insulin. *Statistical significance (ANOVA)
Fig. 5
Fig. 5
Roles of intracellular signaling pathways and Mesothelin in glucose and insulin-invoked CA125 metabolism. a The computational simulation of Western blotting performed using the automatic machine “Wes”. Shown are the intracellular CA125 and Mesothelin protein levels after administration of saline, insulin and glucose plus insulin in ovarian cancer cells (OVCAR-3) with or without PI3K-Akt and MEK-ERK pathway blockades (for details, see Additional file 2: Figure S2). b The relative intracellular Mucin16 and MSLN mRNA levels after administration of saline, insulin and glucose plus insulin with or without PI3K-Akt and MEK-ERK blockades (note: Mucin 16/ACTB and MSLN/ACTB mRNA ratios were set to 1 for the saline controls). c Knockdown effects of MSLN-specific or NC siRNAs on target protein expression. d The time-dependent extracellular and intracellular CA125 levels after MSLN knockdown. e The time-dependent re-absorption of Alexa Fluor 488-labeled CA125 after MSLN knockdown. Only the cells treated with NC-siRNA and supplemented with insulin showed significantly increased re-absorption of CA125 protein. *Statistical significance (two-sided Student’s t test)

References

    1. Cancer Research UK (CRUK). Ovarian cancer survival statistics. In: CRUK; 2014. http://www.cancerresearchuk.org/health-professional/cancer-statistics/st.... Accessed 18 Jan 2018.
    1. Prorok PC, Andriole GL, Bresalier RS, Buys SS, Chia D, Crawford ED, et al. Design of the prostate, lung, colorectal and ovarian (PLCO) cancer screening trial. Control Clin Trials. 2000;21(6 Suppl):273S–309S. doi: 10.1016/S0197-2456(00)00098-2. - DOI - PubMed
    1. Sokalska A, Timmerman D, Testa AC, Van Holsbeke C, Lissoni AA, Leone FP, et al. Diagnostic accuracy of transvaginal ultrasound examination for assigning a specific diagnosis to adnexal masses. Ultrasound Obstet Gynecol. 2009;34(4):462–470. doi: 10.1002/uog.6444. - DOI - PubMed
    1. Huhtinen K, Suvitie P, Hiissa J, Junnila J, Huvila J, Kujari H, et al. Serum HE4 concentration differentiates malignant ovarian tumours from ovarian endometriotic cysts. Br J Cancer. 2009;100(8):1315–1319. doi: 10.1038/sj.bjc.6605011. - DOI - PMC - PubMed
    1. Soper JT, Hunter VJ, Daly L, Tanner M, Creasman WT, Bast RC. Preoperative serum tumor-associated antigen levels in women with pelvic masses. Obstet Gynecol. 1990;75(2):249–254. - PubMed

Publication types

MeSH terms