. 2018 Jun 12;11(6):dmm031013.
doi: 10.1242/dmm.031013.

Lifespan analysis of brain development, gene expression and behavioral phenotypes in the Ts1Cje, Ts65Dn and Dp(16)1/Yey mouse models of Down syndrome

Affiliations

Lifespan analysis of brain development, gene expression and behavioral phenotypes in the Ts1Cje, Ts65Dn and Dp(16)1/Yey mouse models of Down syndrome

Nadine M Aziz et al. Dis Model Mech. .

Abstract

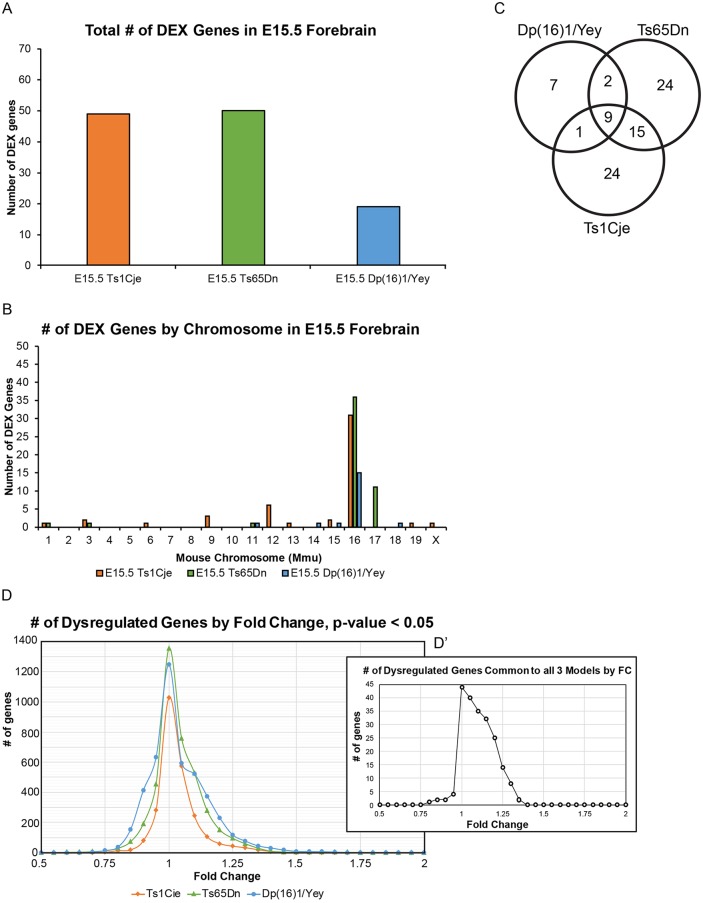
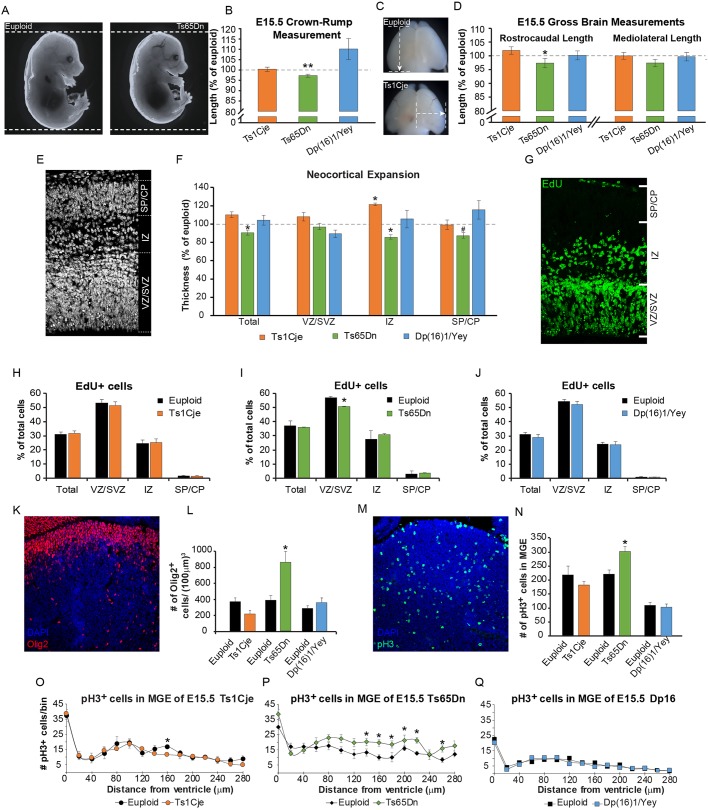
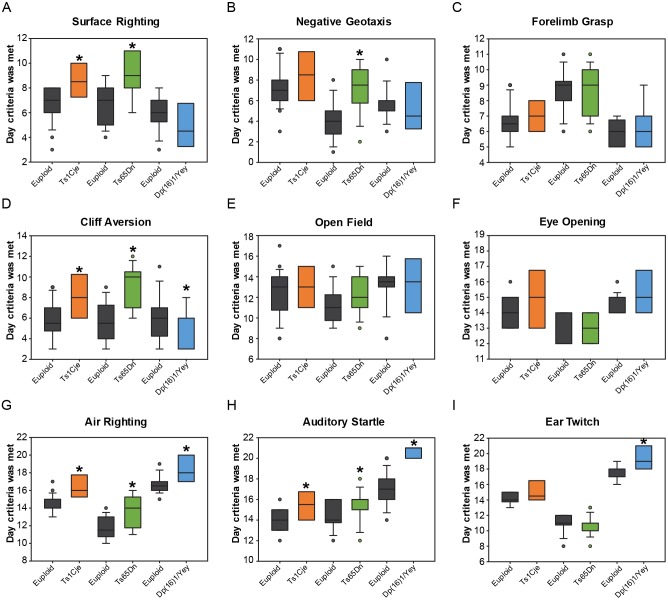
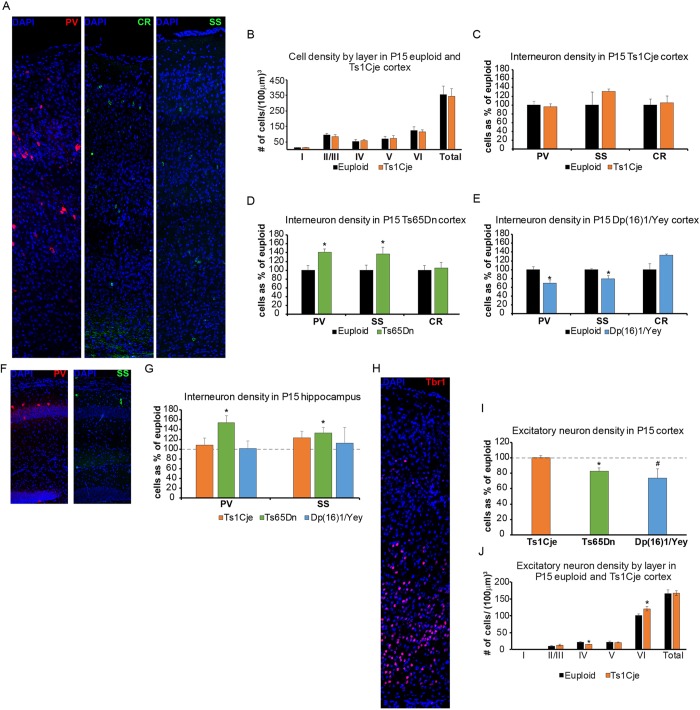
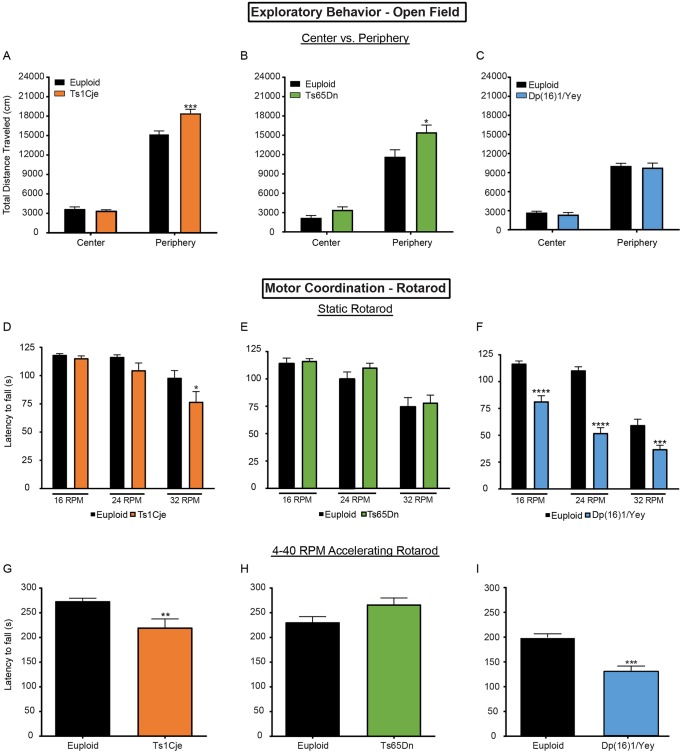
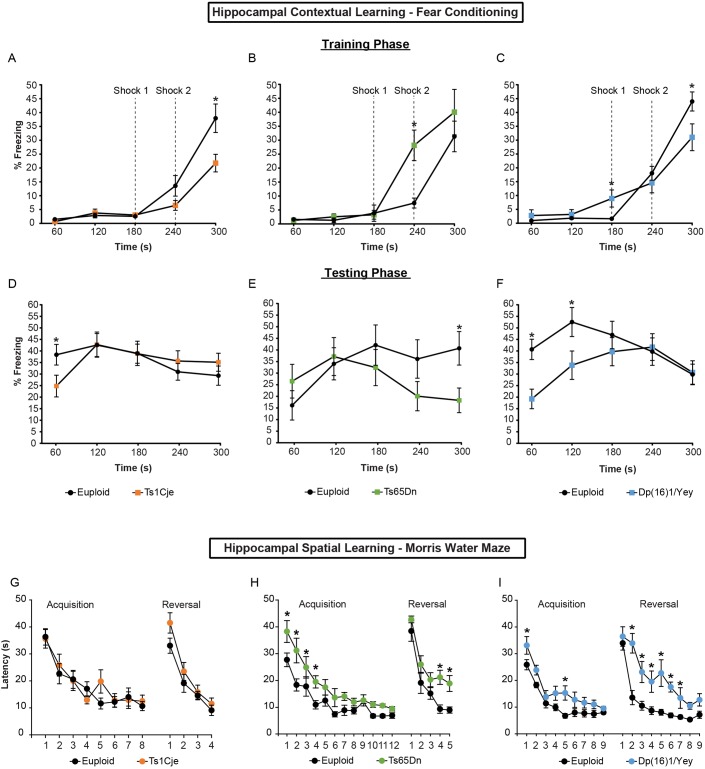
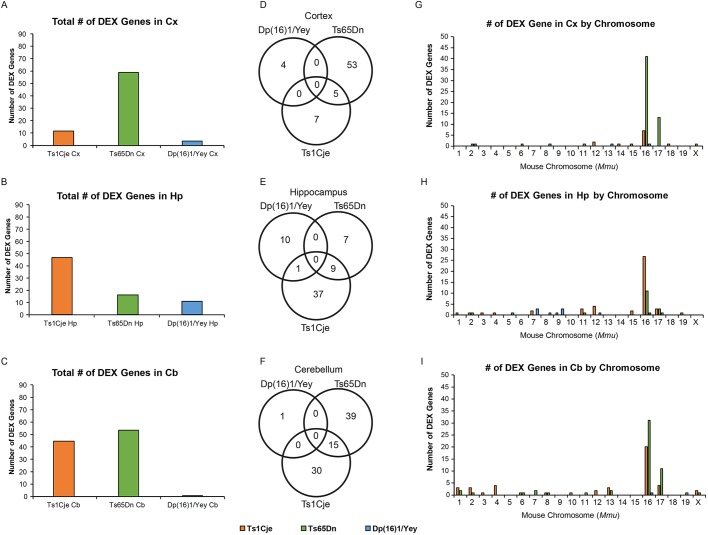
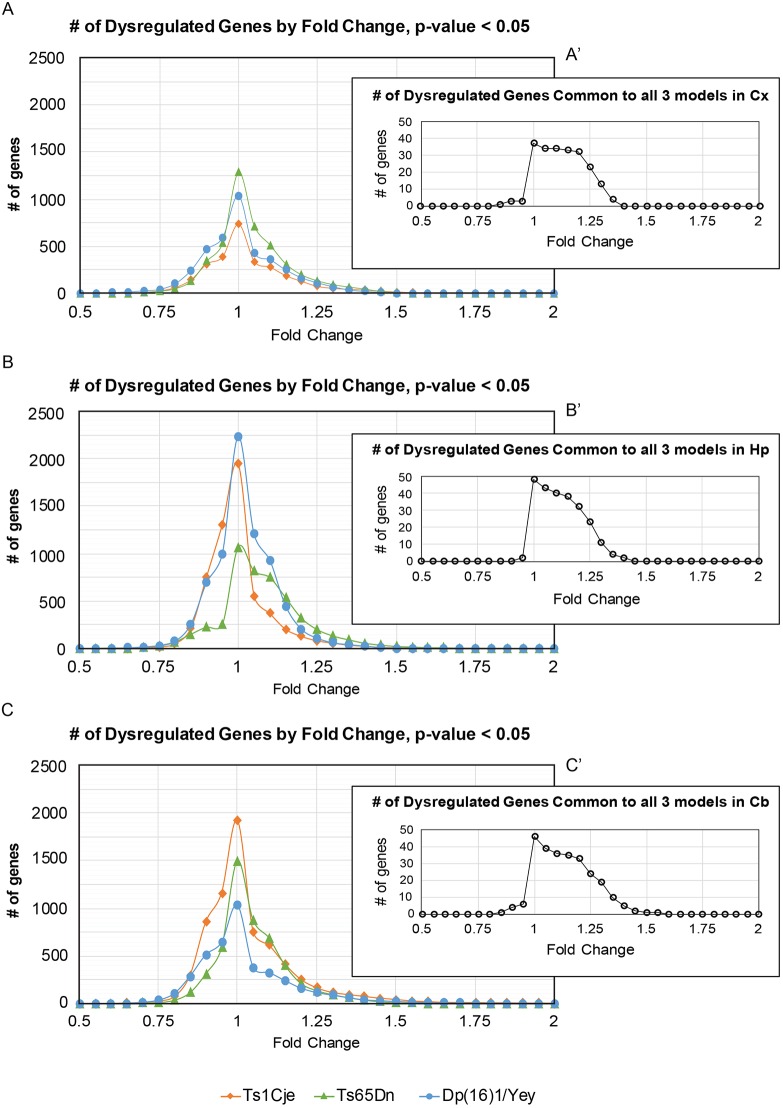
Down syndrome (DS) results from triplication of human chromosome 21. Neuropathological hallmarks of DS include atypical central nervous system development that manifests prenatally and extends throughout life. As a result, individuals with DS exhibit cognitive and motor deficits, and have delays in achieving developmental milestones. To determine whether different mouse models of DS recapitulate the human prenatal and postnatal phenotypes, here, we directly compared brain histogenesis, gene expression and behavior over the lifespan of three cytogenetically distinct mouse models of DS: Ts1Cje, Ts65Dn and Dp(16)1/Yey. Histological data indicated that Ts65Dn mice were the most consistently affected with respect to somatic growth, neurogenesis and brain morphogenesis. Embryonic and adult gene expression results showed that Ts1Cje and Ts65Dn brains had considerably more differentially expressed (DEX) genes compared with Dp(16)1/Yey mice, despite the larger number of triplicated genes in the latter model. In addition, DEX genes showed little overlap in identity and chromosomal distribution in the three models, leading to dissimilarities in affected functional pathways. Perinatal and adult behavioral testing also highlighted differences among the models in their abilities to achieve various developmental milestones and perform hippocampal- and motor-based tasks. Interestingly, Dp(16)1/Yey mice showed no abnormalities in prenatal brain phenotypes, yet they manifested behavioral deficits starting at postnatal day 15 that continued through adulthood. In contrast, Ts1Cje mice showed mildly abnormal embryonic brain phenotypes, but only select behavioral deficits as neonates and adults. Altogether, our data showed widespread and unexpected fundamental differences in behavioral, gene expression and brain development phenotypes between these three mouse models. Our findings illustrate unique limitations of each model when studying aspects of brain development and function in DS. This work helps to inform model selection in future studies investigating how observed neurodevelopmental abnormalities arise, how they contribute to cognitive impairment, and when testing therapeutic molecules to ameliorate the intellectual disability associated with DS.This article has an associated First Person interview with the first author of the paper.

Keywords: Brain development; Developmental disorders; Down syndrome; Dp(16)1/Yey; Lifespan analysis; Ts1Cje; Ts65Dn.


Conflict of interest statement

Competing interestsThe authors declare no competing or financial interests.

Figures

Fig. 1.
Fig. 1.
Number of DEX genes in Ts1Cje, Ts65Dn and Dp(16)1/Yey embryonic forebrains. Analysis of differentially expressed (DEX) genes in E15.5 forebrains of Ts1Cje mice (n=5 trisomic mice, n=5 euploid littermates); Ts65Dn mice (n=5 trisomic mice, n=6 euploid littermates); and Dp(16)1/Yey mice (n=6 trisomic mice, n=6 euploid littermates). A Benjamini-Hochberg FDR cut-off <10% was used to determine which genes are classified as DEX. (A) Overall number of DEX genes in each model. Ts1Cje and Ts65Dn mice display approximately double the number of DEX genes as Dp(16)1/Yey mice. (B) Number of DEX genes by chromosome in each model. (C) Venn diagram showing the number of common DEX genes among the models. (D) Distribution of dysregulated genes by fold change (FC), showing that the majority of dysregulated genes have small magnitude FCs that lie between 0.75 and 1.25. Relative gene expression in trisomic animals compared with their euploid littermates was deemed significant at P<0.05. (D′) Distribution of dysregulated genes that are common to all three models. The majority of dysregulated genes in common cluster between 0.75 and 1.25 FC.
Fig. 2.
Fig. 2.
Embryonic somatic growth, brain development, and neurogenesis in Ts1Cje, Ts65Dn and Dp(16)1/Yey mice. All images and data are generated at the level of the future somatosensory cortex. Data are mean±s.e.m., *P<0.05, **P<0.01. (A) Representative images of euploid and Ts65Dn embryos at E15.5. (B) Quantification of body length in Ts1Cje, Ts65Dn and Dp(16)1/Yey embryos, showing only a decrease in Ts65Dn body length. Mice used: (1) Ts1Cje strain (n=13 trisomic mice, n=11 euploid littermates); (2) Ts65Dn strain (n=7 trisomic mice, n=20 euploid littermates); (3) Dp(16)1/Yey strain (n=26 trisomic mice, n=19 euploid littermates). (C) Representative images displaying the rostrocaudal (top) and mediolateral (bottom) measurements used to assess gross brain size at E15.5. (D) Gross brain measurements in Ts1Cje, Ts65Dn and Dp(16)1/Yey mice, showing that only Ts65Dn embryonic forebrains have a decreased rostrocaudal length. Mice used: (1) Ts1Cje strain (n=13 trisomic mice, n=11 euploid littermates); (2) Ts65Dn strain (n=7 trisomic mice, n=20 euploid littermates); (3) Dp(16)1/Yey strain (n=26 trisomic mice, n=19 euploid littermates). (E) Representative image showing the dorsal pallium in E15.5 brain. Dashed lines demarcate the different layers of the germinal zone: ventricular/subventricular zones (VZ/SVZ), intermediate zone (IZ) and subplate/cortical plate (SP/CP). (F) Measures of neocortical expansion in Ts1Cje, Ts65Dn and Dp(16)1/Yey forebrains as a percentage of those of their respective euploid littermates. Ts65Dn embryos show a decrease in overall pallial thickness, as well as thickness of the IZ and SP/CP (#P=0.10). Ts1Cje embryos show an increase in the size of the IZ that is not reflected in any other layer or in overall thickness. Dp(16)1/Yey embryos show no change. Mice used: (1) Ts1Cje strain (n=6 trisomic mice, n=6 euploid littermates); (2) Ts65Dn strain (n=9 trisomic mice, n=9 euploid littermates); (3) Dp(16)1/Yey strain (n=11 trisomic mice, n=10 euploid littermates). (G) Representative image showing EdU staining (green) in the dorsal pallium. Again, the layers of the dorsal germinal zone are demarcated. (H) Ts1Cje embryos show no change in the percentage of EdU+ cells by layer in the dorsal pallium compared with euploid littermates. (I) Ts65Dn embryos show a decrease in the percentage of EdU+ cells only in the VZ/SVZ of the dorsal pallium compared with euploid littermates. (J) Dp(16)1/Yey embryos show no change in the percentage of EdU+ cells by layer in the dorsal pallium compared with euploid littermates. (K) Representative image showing OLIG2 (red) staining in the medial ganglionic eminence (MGE) of the ventral germinal zone at E15.5. Cell nuclei are stained with DAPI (blue). Mice used in H-K: (1) Ts1Cje strain (n=6 trisomic mice, n=6 euploid littermates); (2) Ts65Dn strain (n=9 trisomic mice, n=9 euploid littermates); (3) Dp(16)1/Yey strain (n=11 trisomic mice, n=10 euploid littermates). (L) Number of OLIG2+ cells per 100 µm3 of MGE in Ts1Cje, Ts65Dn and Dp(16)1/Yey embryos and their respective euploid littermates. Only Ts65Dn mice show a marked increase in OLIG2+ cells compared with euploid littermates. Mice used: (1) Ts1Cje strain (n=6 trisomic mice, n=6 euploid littermates); (2) Ts65Dn strain (n=9 trisomic mice, n=9 euploid littermates); (3) Dp(16)1/Yey strain (n=11 trisomic mice, n=10 euploid littermates). (M) Representative image showing phosphorylated histone 3 (pH3) (green) staining in the MGE of the ventral germinal zone at E15.5. Cell nuclei are stained with DAPI (blue). (N) Number of pH3+ cells in the MGE of Ts1Cje, Ts65Dn and Dp(16)1/Yey embryos and their respective euploid littermates. Only Ts65Dn mice show a significant increase in pH3+ cells compared with euploid littermates. (O-Q) Distribution of pH3+ into 20-µm bins starting at the ventricular surface. (O) Ts1Cje mice show a decrease only in one bin at 160 µm from the ventricular surface compared with euploid littermates. (P) Ts65Dn show a consistent increase in the area corresponding to the SVZ of the MGE (bins 140-260 µm from the ventricular surface) compared with euploid littermates. (Q) Dp(16)1/Yey shows no change in pH3+ cells by bin compared with euploid littermates. Mice used in N-Q: (1) Ts1Cje strain (n=6 trisomic mice, n=6 euploid littermates); (2) Ts65Dn strain (n=9 trisomic mice, n=9 euploid littermates); (3) Dp(16)1/Yey strain (n=11 trisomic mice, n=10 euploid littermates).
Fig. 3.
Fig. 3.
Developmental milestones in male Ts1Cje, Ts65Dn and Dp(16)1/Yey neonates. Developmental milestones were measured on a daily basis between birth and P21 in Ts1Cje mice (n=32 trisomic mice, n=64 euploid littermates); Ts65Dn mice (n=34 trisomic mice, n=23 euploid littermates); and Dp(16)1/Yey mice (n=30 trisomic mice, n=72 euploid littermates). Graphs showing day on which criteria were met on each task in trisomic mice compared with euploid littermates. Plots show median value for each group tested, first and third quartiles, data range and outliers; *P<0.05. (A) On surface righting, only Ts1Cje and Ts65Dn mice show an impairment compared with their euploid littermates. (B) On negative geotaxis, only Ts65Dn mice show a marked impairment compared with their euploid littermates. (C) On forelimb grasp, all trisomic mice perform similarly to their euploid littermates. (D) On cliff aversion, Ts1Cje and Ts65Dn mice show a significant impairment, whereas Dp(16)1/Yey mice show an improvement, compared with their respective euploid littermates. (E) On open field, all trisomic mice perform similarly to their euploid littermates. (F) On eye opening, all trisomic mice perform similarly to their euploid littermates, showing that there was no confound during testing from lack of vision in trisomic mice. (G) On air righting, all trisomic mice show an impairment compared with their euploid littermates. (H) On auditory startle, all trisomic mice show an impairment compared with their euploid littermates. (I) On ear twitch, only Dp(16)1/Yey mice show an impairment compared with euploid littermates.
Fig. 4.
Fig. 4.
Neuronal populations in P15 Ts1Cje, Ts65Dn and Dp(16)1/Yey forebrains. Both excitatory and inhibitory neuronal populations were measured in the somatosensory cortices of the Ts1Cje (n=6 trisomic mice, n=6 euploid littermates), Ts65Dn (n=4 trisomic mice, n=4 euploid littermates) and Dp(16)1/Yey (n=4 trisomic mice, n=5 euploid littermates) mouse models at P15. (A) Representative images of parvalbumin (PV, red), calretinin (CR, green) and somatostatin (SS, green) inhibitory interneuron (IN) staining in the somatosensory cortex. All nuclei are counterstained with DAPI (blue). (B) Cell density by neocortical layer in P15 Ts1Cje mice compared with euploids. No change is observed in density or layer thickness (data not shown). Data are mean±s.e.m. (C-E) IN density as a percentage of total cells. Each subtype is represented separately. No change in overall density or density by neocortical layer (data not shown) is seen in Ts1Cje mice compared with their euploid littermates (C). An increase in PV+ and SS+ IN density is seen in the neocortex of Ts65Dn mice compared with their euploid littermates. No change is observed in CR+ INs (D). A decrease in PV+ and SS+ IN density is seen in the neocortex of Dp(16)1/Yey mice compared with their euploid littermates. No change is observed in CR+ INs (E). (F) Representative images of PV+ (red) and SS+ (green) INs in the dorsal hippocampus. All nuclei are counterstained with DAPI (blue). (G) No change in IN populations in the hippocampus is seen in Ts1Cje (orange bars) and Dp(16)1/Yey (blue bars) mice compared with their euploid littermates. Ts65Dn mice show an increase in both PV+ and SS+ INs in the hippocampus compared with their euploid littermates. Data are mean±s.e.m., *P<0.05. (H) Representative images of Tbr1 (red) excitatory neuron staining in the somatosensory cortex. All nuclei are counterstained with DAPI (blue). (I) Ts65Dn mice show a significant decrease in excitatory neuron numbers in the somatosensory cortex compared with their euploid littermates (green bar). Dp(16)1/Yey mice show a trend towards a decrease in excitatory neuron numbers in the somatosensory cortex compared with their euploid littermates (blue bar). Ts1Cje mice show no change in overall number of excitatory neurons in the somatosensory cortex compared with their euploid littermates. (J) However, a shift in distribution from Layer IV, favoring Layer VI, is observed in these mice. Data are mean±s.e.m., *P<0.05; #P=0.07.
Fig. 5.
Fig. 5.
Motor-based tasks in adult Ts1Cje, Ts65Dn and Dp(16)1/Yey males. Exploratory motor behavior and coordination were investigated in the open field and rotarod tests in Ts1Cje mice (n=13 trisomic mice, n=15 euploid mice); Ts65Dn mice (n=12 trisomic mice, euploid mice=12); Dp(16)1/Yey mice(n=18 trisomic mice, n=17 euploid mice). (A-C) Measurement of distance traveled in the center versus periphery of testing space during the open field task. This measurement is a representation of exploratory behavior in animals. Ts1Cje mice travel more distance in the periphery compared with their euploid controls. Travel in the center is similar between genotypes (A). Ts65Dn mice also travel more distance in the periphery compared with their euploid controls. Travel in the center is similar between genotypes (B). Dp(16)1/Yey mice show no change in distance traveled in both center and periphery compared with their euploid controls (C). (D-F) Latency to fall during the nonaccelerating rotarod at three different speeds: 16, 24 and 32 RPM. This task measures motor coordination in animals. Ts1Cje mice only show a deficit at the highest rotational speed of 32 RPM (D). Ts65Dn mice show no difference in rotarod performance compared with a pooled cohort of B6C3Sn hybrid euploids at any speed (E). Dp(16)1/Yey mice show a marked impairment in rotarod performance at every speed compared with their euploid controls (F). (G-I) Latency to fall during the accelerating rotarod task, which gradually increases in rotational speed from 4 RPM to 40 RPM. This task measures motor coordination in animals. Ts1Cje mice show significant impairment in accelerating rotarod task compared with their euploid controls (G). Ts65Dn mice show no difference in rotarod performance compared with a pooled cohort of B6C3Sn hybrid euploids (H). Dp(16)1/Yey mice show a marked impairment in rotarod performance compared with their euploid controls (I). Data are mean±s.d., *P<0.05, **P<0.01, ***P<0.001, ****P<0.0001.
Fig. 6.
Fig. 6.
Hippocampal-based tasks in adult Ts1Cje, Ts65Dn and Dp(16)1/Yey males. Hippocampal-dependent spatial and contextual memory were investigated using the fear conditioning and Morris water maze (MWM) tests. (A-F) The contextual fear conditioning test has two phases: training and testing. During the training phase, mice are given two mild shocks 60 s apart. On the following day, mice are placed in the same chamber but no shocks are applied. Freezing behavior is documented. Animals used in A-F: Ts1Cje mice (n=13 trisomic mice, n=15 euploid mice); Ts65Dn (n=12 trisomic mice, n=12 euploid mice); and Dp(16)1/Yey mice (n=18 trisomic mice, n=17 euploid littermates). (G-I) The MWM test has two phases: acquisition and reversal. Both tests utilize a hidden platform to analyze learning (acquisition phase) and reversal learning (reversal phase). Mice are initially tested using a visible platform to exclude any confounds related to testing procedures or non-learning based deficits in the mice. Ts1Cje males show no deficits during either the acquisition phase or the reversal learning phase (G). Ts65Dn males show no deficits during the acquisition period after the 4 days needed to stop thigmotaxic behavior and acclimate to the task (previously published in Olmos-Serrano et al., 2016b). However, these mice show a deficit in reversal learning compared with their euploid controls (H). Dp(16)1/Yey males show impaired learning on days 1 and 5 of the acquisition phase. Additionally, these males also show a strong deficit in reversal learning compared with their euploid controls (I). Animals used in G-I: Ts1Cje mice (n=13 trisomic mice, n=11 euploid mice); Ts65Dn (n=14 trisomic mice, n=14 euploid mice); and Dp(16)1/Yey mice (n=13 trisomic mice, n=11 euploid littermates). Data are mean±s.d., *P<0.05.
Fig. 7.
Fig. 7.
Number of DEX genes and their chromosomal clustering in adult Ts1Cje, Ts65Dn and Dp(16)1/Yey brains by region. Global gene expression analysis of cortex, hippocampus and cerebellum in adult male Ts1Cje mice (n=5 per genotype); Ts65Dn mice (n=5 per genotype); and Dp(16)1/Yey mice (n=5 per genotype). DEX genes were designated as such using a Benjamini-Hochberg FDR cut-off of <10%. (A-C) Overall number of DEX genes in each model by region. Dp(16)1/Yey mice display the lowest number of total DEX genes. Ts1Cje and Ts65Dn mice display a similar number of total DEX genes to one another, but these genes differ in identity and in chromosomal location in each model (G-I). (D-F) Venn diagrams showing the number of common DEX genes among the models by brain region. (G-I) Analysis showing genome-wide chromosomal clustering of DEX genes in Ts1Cje mice, Ts65Dn mice and Dp(16)1/Yey mice by brain region.
Fig. 8.
Fig. 8.
Number of dysregulated genes by FC in adult male Ts1Cje, Ts65Dn and Dp(16)1/Yey brains by region. (A-C) Distribution of dysregulated genes in each brain region by FC, showing that the majority of dysregulated genes have small magnitude FCs that lie between 0.75 and 1.25. These genes show a significant FC value in trisomic mice compared with their euploid controls, P<0.05. (A′-C′) Distribution of dysregulated genes that are common to all three models, displayed by brain region. The majority of dysregulated genes in common cluster between 0.8 and 1.3 FC.

References

    1. Bahado-Singh R. O., Wyse L., Dorr M. A., Copel J. A., O'connor T. and Hobbins J. C. (1992). Fetuses with Down syndrome have disproportionately shortened frontal lobe dimensions on ultrasonographic examination. Am. J. Obstet. Gynecol. 167, 1009-1014. 10.1016/S0002-9378(12)80029-9 - DOI - PubMed
    1. Bartel D. P. (2009). MicroRNAs: target recognition and regulatory functions. Cell 136, 215-233. 10.1016/j.cell.2009.01.002 - DOI - PMC - PubMed
    1. Becker L. E., Armstrong D. L. and Chan F. (1986). Dendritic atrophy in children with Down's syndrome. Ann. Neurol. 20, 520-526. 10.1002/ana.410200413 - DOI - PubMed
    1. Becker L., Mito T., Takashima S. and Onodera K. (1991). Growth and development of the brain in Down syndrome. Prog. Clin. Biol. Res. 373, 133-152. - PubMed
    1. Belichenko P. V., Kleschevnikov A. M., Salehi A., Epstein C. J. and Mobley W. C. (2007). Synaptic and cognitive abnormalities in mouse models of Down syndrome: exploring genotype-phenotype relationships. J. Comp. Neurol. 504, 329-345. 10.1002/cne.21433 - DOI - PubMed

Publication types

MeSH terms