. 2018 May 1;9(1):1758.
doi: 10.1038/s41467-018-03750-7.

IL-21 drives expansion and plasma cell differentiation of autoreactive CD11chiT-bet+ B cells in SLE

Collaborators, Affiliations

IL-21 drives expansion and plasma cell differentiation of autoreactive CD11chiT-bet+ B cells in SLE

Shu Wang et al. Nat Commun. .

Abstract

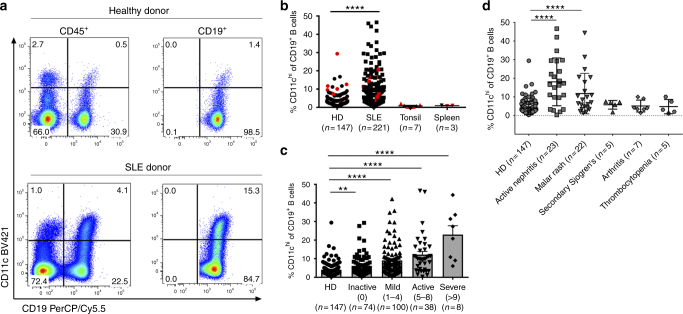
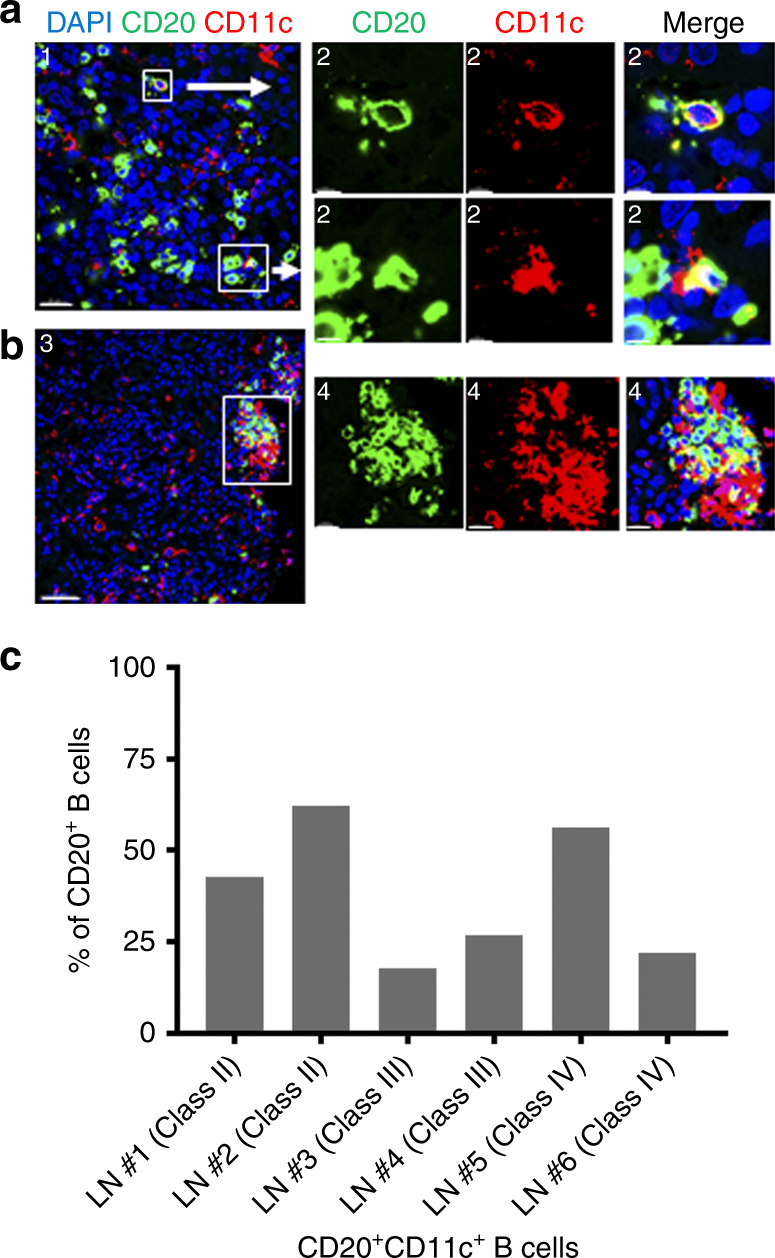
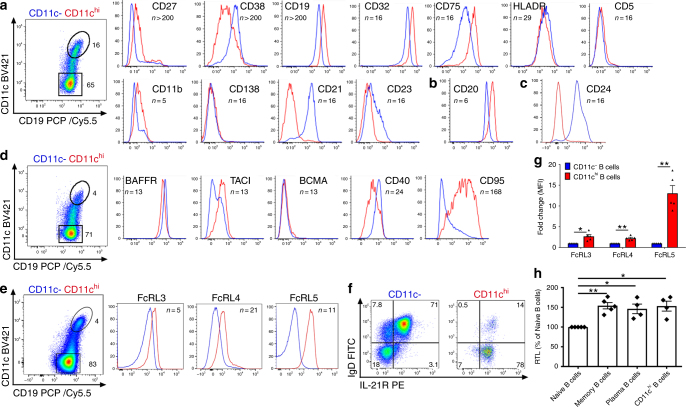
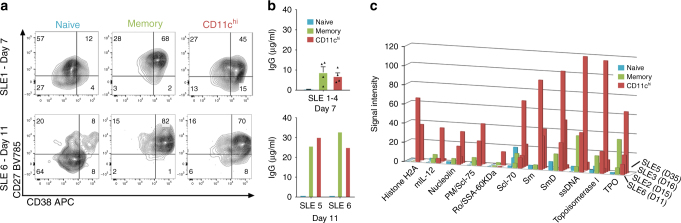
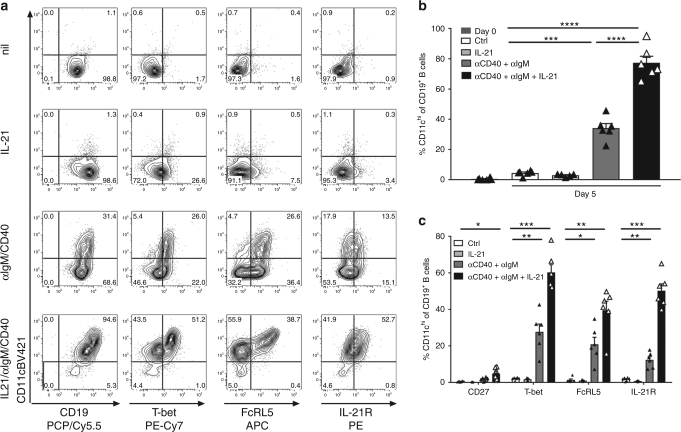
Although the aetiology of systemic lupus erythematosus (SLE) is unclear, dysregulated B cell responses have been implicated. Here we show that an unusual CD11chiT-bet+ B cell subset, with a unique expression profile including chemokine receptors consistent with migration to target tissues, is expanded in SLE patients, present in nephrotic kidney, enriched for autoreactive specificities and correlates with defined clinical manifestations. IL-21 can potently induce CD11chiT-bet+ B cells and promote the differentiation of these cells into Ig-secreting autoreactive plasma cells. While murine studies have identified a role for T-bet-expressing B cells in autoimmunity, this study describes and exemplifies the importance of CD11chiT-bet+ B cells in human SLE.


Conflict of interest statement

S.W., J.W., V.K., B.N., S.R., K.Z., R.H., C.M., H.L., N.H., Autoimmunity Molecular Medicine Team, K.S. and R.K. are full-time employees and shareholders of MedImmune/AstraZeneca. R.E. and J.L.K. were employees at MedImmune and owners of AstraZeneca stock. They are currently employees at and shareholder at Viela Bio. The remaining authors declare no competing interests.

Figures

Fig. 1
Fig. 1
CD11chi B cells are expanded in SLE and correlate to SLEDAI and specific clinical manifestations. ad % CD11chi B cells (of CD19+ cells) was determined as shown in a. b Distribution of %CD11chi B cells (of CD19+ cells) (healthy donors n = 147 (123 unique donors, 24 of which are repeats) or SLE patients n = 221 (112 unique donors, 109 of which are repeats), tonsil or spleen. Male donors labelled in red. c %CD11chi B cells (of CD19+cells) isolated from blood of healthy donors or SLE patients grouped by SLEDAI range. d %CD11chi B cells (of CD19+cells) from healthy donors was compared to SLE with different clinical manifestations. Patients with more than one manifestation were excluded (n = 10). bd (Data are represented as mean ± SEM, non-parametric Mann–Whitney test, **p < 0.01, ****p < 0.0001)
Fig. 2
Fig. 2
CD11chi B cells are present in nephritic kidney in SLE. Nephritic kidneys from SLE patients were examined for the presence of CD11chi B cells. A total of 11 kidney biopsies were examined, of which 6 contained B cell infiltrate as defined in methods where all 6 showed presence of CD20+CD11c+ double positive B cells. Green shows CD20, red shows CD11c, and yellow indicates double positive cells. a Kidney section of lupus nephritis Class II. b Kidney section of lupus nephritis Class IV-b. Space bars show length as indicated. Scale bars = 1, 20 μM; 2, 3 μM; 3, 50 μM; 4, 10 μM. c Frequencies of CD20+CD11c+ double positive B cells present in nephritic kidneys as indicated compared to CD20+ B cells from six unique lupus nephritis donors
Fig. 3
Fig. 3
CD11chi B cells express T-bet and largely do not express CD27 or CD38 and contain switched B cell receptors. a, b %CD11chi T-bet+ B cells (of CD19+cells) in blood was determined in SLE and cell surface phenotype determined. Data representative of 21 unique healthy donors and 39 unique SLE with four repeat SLE donors. c Cell surface expression of IgD by IgM or IgG by IgA was determined on CD19+CD11cCD27 naive (blue), CD11cCD27+ memory (green), or CD11chi (red) B cells from SLE (Data are represented as mean ± SEM, unpaired t test with Welch’s correction, ***p < 0.001, ****p < 0.0001, n = 11)
Fig. 4
Fig. 4
Phenotype of CD11chi B cells from SLE patients. ae Phenotype of CD11c (blue) or CD11chi (red) CD19+ B cell subsets as indicated was determined in SLE where a unique donor is shown for each panel. a Representative phenotype of B cell subsets from the same SLE donor. b, c CD20 or CD24 expression in B cell subsets from separate SLE donors. d Expression of TNF family members was determined on SLE B cell populations as indicated. e FcRL family members were assessed on SLE B cell populations as indicated from the same donor. f Expression of IgD by IL-21R was determined on SLE B cell populations as indicated. g Fold change of FcRL measured as Mean Fluorescence intensity (MFI) of B cell subsets compared to CD11c B cells as indicated. (Data are represented as mean ± SEM, unpaired t test with Welch’s correction *p < 0.05, **p < 0.01, n = 5 SLE). h Relative telomere length (RTL) was determined in B cell populations as indicated and plotted as % naive B cells. Sorting strategy shown in Supplementary Fig. 11a (Data are represented as mean ± SEM, unpaired t test with Welch’s correction, *p < 0.05; **p < 0.01, n = 5 unique donors in independent experiments
Fig. 5
Fig. 5
Unique transcriptome profile of CD11chi B cells in SLE. a Venn diagram showing number of genes with significant upregulation or downregulation comparing CD11chi cells with naive or memory B cells. Sorting strategy shown in Supplementary Fig. 11b. Significance is defined as Fold change (FC) >2 and False discovery rate (FDR) <0.05. b Heatmap showing expression pattern of genes with significant change (FC >2, FDR <0.05) in at least one of the group comparisons (CD11chi vs. naive or CD11chi vs. memory B cells), and passed cut-off of median counts per million (CPM) >50 in at least one of the three cell populations. Log2 transformed CPM values were used for plotting. Genes were clustered using hierarchical clustering. Red indicates higher expression, and blue indicates lower expression. Colour bar indicates Z score. c Heatmap showing expression pattern of representative genes with relevant functions. Median log2 transformed CPM values for each cell population were used for plotting. Yellow indicates higher expression, and blue indicates lower expression. Colour bar indicates Z score. d Gene set enrichment analysis (GSEA) showing pathways enriched in CD11chi B cells compared to naive B cells. Heatmap shows the expression of the core genes that contribute to pathway enrichment (red, high expression; blue, low expression). NES: normalised enrichment score, FDR: false discovery rate
Fig. 6
Fig. 6
Increase of CD11chi B cells significantly correlates to plasma cells and a distinct set of IgG autoantibodies in SLE. a %CD11chi B cells (of CD19+ cells) was correlated to %CD38hiCD27hi plasma cells (of CD19+ cells) in SLE blood. (r: Pearson correlation coefficient, ****p < 0.0001, n = 189). b Serum autoantibodies were screened for reactivity to 95 self-antigens. Scatter plots show the top 15 correlated autoantibodies (r: Pearson correlation coefficient, FDR: false discovery rate, n = 114 total SLE patients with 71 unique donors). Red dashed line indicates median log2 (signal intensity) of the autoantibodies of healthy donors (n = 49)
Fig. 7
Fig. 7
CD11chi B cells are poised to differentiate into plasma cells and are the major producers of autoantibody. ac B cells from SLE patients were sorted into CD19+CD11cCD27 naive (blue), CD11cCD27+ memory (green), or CD11chi (red) B cells and added to anti-CD3-activated T cells. Sorting strategy shown in Supplementary Fig. 11c. For several experiments, an early and late time point was evaluated from separate culture wells. Each SLE number represent an independent donor examined at one or more time points. a After 7 or 11 days of culture, CD19+CD3 B cells were analysed for CD27+CD38hi plasma cell phenotype. b IgG in the supernatant was determined by ELISA (for day 7, data are represented as mean ± SEM of four independent experiments, or day 11, two independent experiments). c Autoantibodies in the supernatant were screened for reactivity to 95 self-antigens on culture day indicated. Bar plot shows significantly increased autoantibodies (p < 0.05) in CD11chi vs. naive B cells as described in Methods
Fig. 8
Fig. 8
IL-21 co-stimulates the CD11chi B cell phenotype. CD11c naive B cells were sorted from the blood of 6 unique SLE patients and activated with a combination of stimulators as indicated. ac Cell surface phenotype was evaluated after 5 days of culture of CD19+ B cells excluding IgDCD38hi plasma cells. b Enumeration (mean ± SEM) of the frequencies of CD11chi cells of CD19+ B cells either post sort (day 0, n = 6) or after 5 days of culture. c Enumeration (mean ± SEM) of the frequencies of CD11chiCD19+ B cells with the indicated phenotype. b, c n = 6 independent experiments of unique SLE donors, expect for IL-21 stimulation only, where n = 5, *p < 0.05, **p < 0.01, ***p < 0.001, ****p < 0.0001 as determine by unpaired t test with Welch’s correction

References

    1. Dorner T, Giesecke C, Lipsky PE. Mechanisms of B cell autoimmunity in SLE. Arthritis Res. Ther. 2011;13:243. doi: 10.1186/ar3433. - DOI - PMC - PubMed
    1. Agematsu K, et al. CD27/CD70 interaction directly drives B cell IgG and IgM synthesis. Eur. J. Immunol. 1995;25:2825–2829. doi: 10.1002/eji.1830251017. - DOI - PubMed
    1. Kobata T, et al. CD27-CD70 interactions regulate B-cell activation by T cells. Proc. Natl. Acad. Sci. USA. 1995;92:11249–11253. doi: 10.1073/pnas.92.24.11249. - DOI - PMC - PubMed
    1. Ehrhardt GR, et al. Discriminating gene expression profiles of memory B cell subpopulations. J. Exp. Med. 2008;205:1807–1817. doi: 10.1084/jem.20072682. - DOI - PMC - PubMed
    1. Wei C, et al. A new population of cells lacking expression of CD27 represents a notable component of the B cell memory compartment in systemic lupus erythematosus. J. Immunol. 2007;178:6624–6633. doi: 10.4049/jimmunol.178.10.6624. - DOI - PubMed

Publication types