. 2018 May 1;9(1):1742.
doi: 10.1038/s41467-018-03953-y.

Contrast-enhanced ultrasound measurement of pancreatic blood flow dynamics predicts type 1 diabetes progression in preclinical models

Affiliations

Contrast-enhanced ultrasound measurement of pancreatic blood flow dynamics predicts type 1 diabetes progression in preclinical models

Joshua R St Clair et al. Nat Commun. .

Abstract

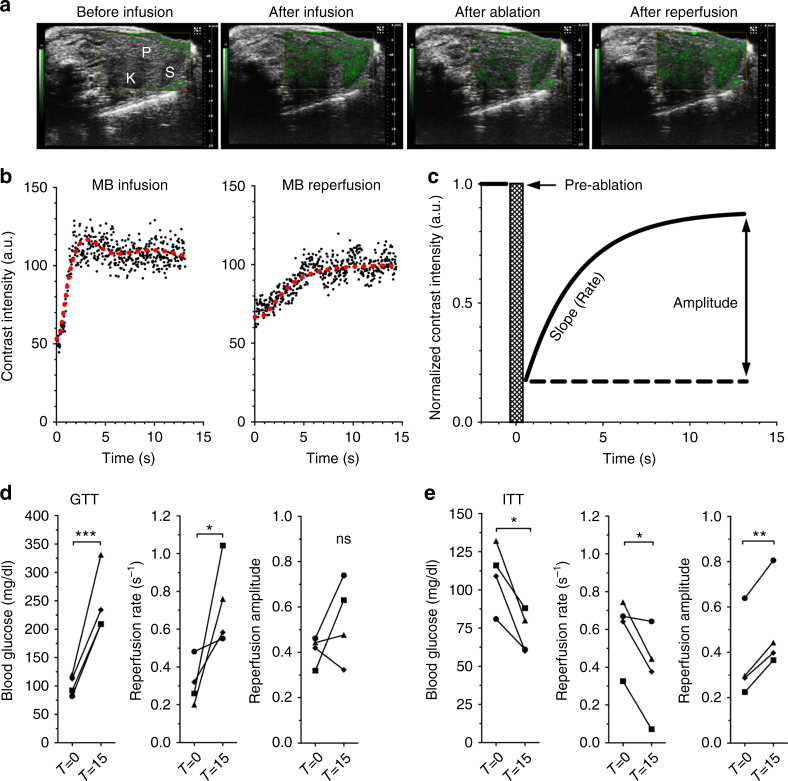
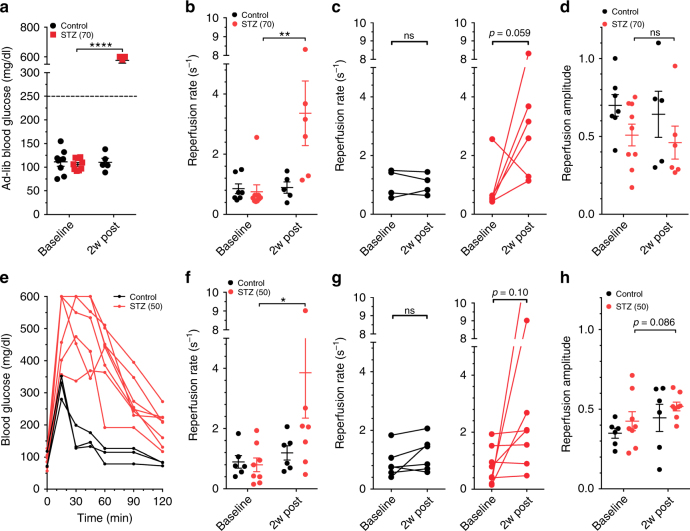
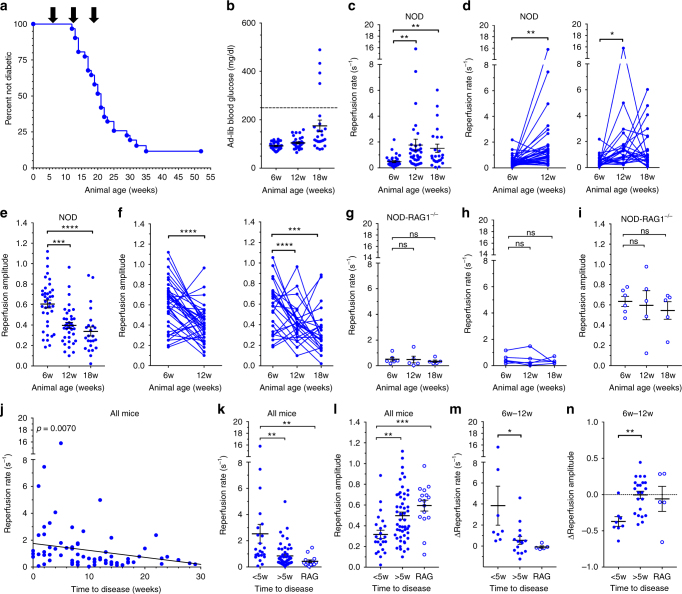
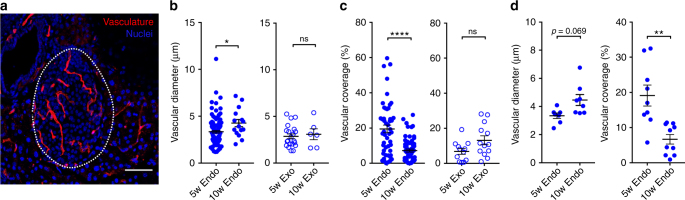
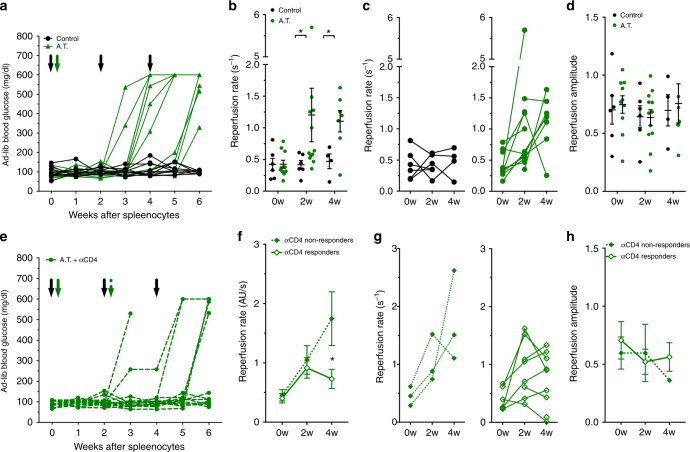
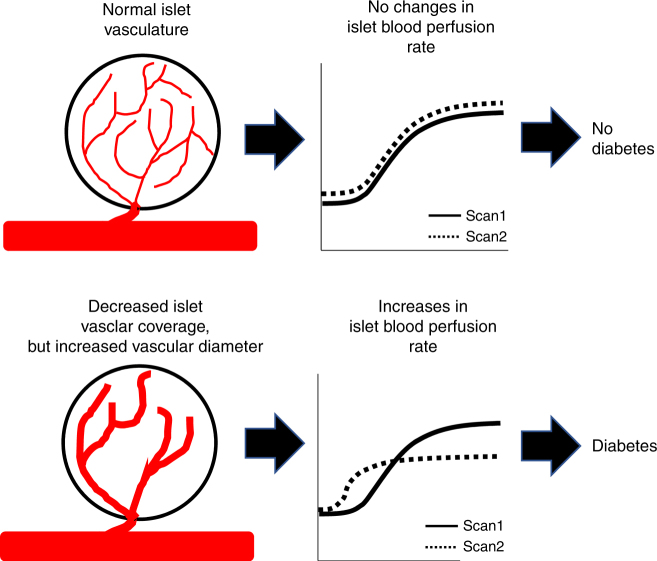
In type 1 diabetes (T1D), immune-cell infiltration into the islets of Langerhans (insulitis) and β-cell decline occurs many years before diabetes clinically presents. Non-invasively detecting insulitis and β-cell decline would allow the diagnosis of eventual diabetes, and provide a means to monitor therapeutic intervention. However, there is a lack of validated clinical approaches for specifically and non-invasively imaging disease progression leading to T1D. Islets have a denser microvasculature that reorganizes during diabetes. Here we apply contrast-enhanced ultrasound measurements of pancreatic blood-flow dynamics to non-invasively and predictively assess disease progression in T1D pre-clinical models. STZ-treated mice, NOD mice, and adoptive-transfer mice demonstrate altered islet blood-flow dynamics prior to diabetes onset, consistent with islet microvasculature reorganization. These assessments predict both time to diabetes onset and future responders to antiCD4-mediated disease prevention. Thus contrast-enhanced ultrasound measurements of pancreas blood-flow dynamics may provide a clinically deployable predictive marker for disease progression in pre-symptomatic T1D and therapeutic reversal.


Conflict of interest statement

The authors declare no competing interests.

Figures

Fig. 1
Fig. 1
CEUS measurements and glucose-dependent changes in the pancreatic blood-flow dynamics in vivo. a Representative overlay images of NL contrast signal (green) on regular B-mode ultrasound image of pancreas (P), kidney (K), and spleen (S), before and after contrast infusion, and immediately following flash destruction (ablation) and reperfusion. b Representative time course of NL contrast signal infusion (left) and reperfusion following flash destruction (right). Red line indicates moving average of the signal. c Exponential rise fit of reperfusion data normalized to pre-flash destruction (pre-ablation) intensity. d Changes in blood glucose, pancreas reperfusion rate, and pancreas reperfusion amplitude before (T = 0) and 15 min after (T = 15) glucose delivery. e As in d before and 15 min after insulin delivery in C57BL/6 mice. *p < 0.05, **p < 0.01, ***p < 0.001 comparing groups indicated (paired t-test data in d, e). Data in d, e represents n = 4 mice each, with each mouse indicated by a different symbol
Fig. 2
Fig. 2
CEUS non invasively detects changes in the pancreas blood flow dynamics following STZ-induced β-cell injury. a Ad-libidum blood glucose concentrations of female C57BL/6 mice injected with 70 mg/kg STZ or buffer (control) before (baseline) and 2 weeks post treatment (2w post). b Reperfusion rate measured in mice in a treated with 70 mg/kg STZ or control before and 2 weeks post treatment. c Data in b showing changes in individual mice for reperfusion rate. d As in b measuring reperfusion amplitude. e Glucose tolerance tests from female C57BL/6 mice 2 weeks following treatment with buffer (control) or 50 mg/kg STZ. f Reperfusion rate measured in mice treated as in e with 50 mg/kg STZ or control before and 2 weeks post treatment. g Data in f showing the changes in individual mice for reperfusion rate. h As in f measuring reperfusion amplitude. Error bars represent s.e.m. * p < 0.05 comparing groups indicated (paired t-test for data in c, g; ANOVA for data in a, b, d, f, h). Data in a–d represents n = 6 STZ-treated (n = 9 at baseline for b, d) and n = 5 control mice (n = 7 at baseline for b, d); data in e represents n = 8 STZ-treated and n = 3 control; data in fh represents n = 8 STZ-treated and n = 6 control mice
Fig. 3
Fig. 3
CEUS non-invasively detects changes in pancreas blood flow dynamics associated with the progression of diabetes in NOD mice. a Survival curves indicating time of diabetes onset for all NOD animals analyzed for this study. b Ad lib blood-glucose levels at the time of measurement for all NOD mice. c Reperfusion rate measured in NOD mice at ages indicated. d Data in b showing changes in individual NOD reperfusion rates between 6 and 12 weeks of age (left), or 6 to 18 weeks (right). e As in c for reperfusion amplitude. f As in d for changes in the reperfusion amplitude between 6 and 12 weeks of age (left), or 6 to 18 weeks (right). g Reperfusion rate measured in NOD-RAG1 KO immunodeficient mice at ages indicated. h Data in g showing changes in individual NOD-RAG1 KO reperfusion rates between 6 and 18 weeks. i As in g for reperfusion amplitude. j Correlations of reperfusion rate with time to diabetes from CEUS scan, in weeks. k Average reperfusion rate over animals that progressed to disease <5 weeks or >5 weeks from CEUS scan, along with measurements in NOD-RAG1 KO mice for comparison. l As in k, for average reperfusion amplitude. m Average change in the reperfusion rate between 6 and 12 weeks averaged over animals that progressed to disease <5 weeks or >5 weeks from CEUS scan, along with average changes in NOD-RAG1 KO mice for comparison. n As in m for change in reperfusion amplitude between 6 and 12 weeks. Error bars represent s.e.m. *p < 0.05, **p < 0.01, ***p < 0.001, ****p < 0.0001 comparing groups indicated (paired t-test data in d, f, h; unpaired t-test in kn; ANOVA data in c, e, g, i). Data in af represents n = 37 NOD mice (n = 24 for 18 weeks), data in gi represents n = 6 NOD-RAG1 KO mice (n = 5 at 12w, 18w), data in jl represents 71 scans over 27 NOD mice, data in m, n represents n = 27 NOD mice. A mixed-effects model was used to assess the statistical significance and generate the regression in j
Fig. 4
Fig. 4
Changes in islet, but not exocrine microvascular morphology, with age in the pancreata of NOD mice. a Representative maximum-projection confocal image over 10 μm depth of pancreas section from NOD mouse infused with texas-red labeled tomato lectin (red). Islet is circled with a dotted line, as determined from brightfield and DAPI-labeling morphology. b Mean vessel diameter in islet (Endo) and exocrine tissue (Exo) in 5- and 10-week-old NOD female mice. c As in b for vascular coverage. d Data for islet vessel diameter and vascular coverage in b, c plotted by mouse. Scale bar in a represents 100 μm. Error bars represent s.e.m. *p < 0.05, **p < 0.01, ***p < 0.001, ****p < 0.0001 comparing groups indicated (t-test data in bd). Data in b represents in total 65 islets (37 islets, at 5w, 28 islets at 10w) and 27 exocrine regions (21 at 5w, 6 at 10w) from 7 NOD mice per time point. Data in c represents in total 112 islets (49 at 5w, 63 at 10w) and 25 exocrine regions (12 at 5w, 13 at 10w) from 9 NOD mice per time point
Fig. 5
Fig. 5
CEUS non-invasively detects changes in pancreas blood flow dynamics associated with immunomodulatory halting of disease. a Ad-lib blood-glucose time courses in adoptive transfer animals treated with splenocytes from diabetic female NOD donors (A.T., green) or treated with buffer alone (Control, black). Black arrows indicate time points of CEUS scans, green arrow indicates delivery of splenocytes. b Reperfusion rate in A.T. animals (green) or control animals (black) at baseline (0w), 2 weeks (2w) and 4 weeks (4w) post splenocyte or vehicle transfer. c Data in b showing changes in individual mice for reperfusion rate. d As in b for reperfusion amplitude. e Ad-lib blood-glucose time courses of A.T. animals that were treated with 20 mg anti-CD4 antibody. Black arrows indicate time of CEUS scans, green solid arrow indicates time of splenocyte delivery, green striped arrow indicates time of anti-CD4 treatment. Animals that progressed to hyperglycemia within 6 weeks were denoted as non-responders. f Average reperfusion rate in anti-CD4 responders (open diamonds) and non-responders (closed diamonds) before (0w), 2 and 4 weeks post splenocyte transfer. g Data in f showing changes in individual responder and non-responder mice for reperfusion rate. h As in f for reperfusion amplitude. Error bars represent s.e.m. *p < 0.05, **p < 0.01, ***p < 0.001 comparing groups indicated (paired t-test for data in c, g; unpaired t-test for data in f, h; ANOVA for data in b, d. Data in ad represents n = 11 AT mice and n = 6 control mice, data in eh represents n = 9 responder mice and 3 non-responder mice
Fig. 6
Fig. 6
Summary by which CEUS measurement of the pancreatic blood-flow dynamics can be used to predict diabetes onset and immunotherapy efficacy. (Top) In an animal that is not progressing to diabetes, there is no change in the reperfusion rate or the amplitude over time, consistent with normal islet microvasculature organization. (Bottom) In an animal that is in pre-diabetes and/or progressing to overt disease, consecutive CEUS scans will show an increase in reperfusion rate, and potentially a decrease in reperfusion amplitude. This change is associated with a decrease in the islet vascular coverage, yet an increase in diameter of the remaining vessels. Thus we suggest that changes in the reperfusion rate (increases) indicate likely progression to diabetes. Furthermore, a defined threshold may also identify an “abnormal” reperfusion measurement to indicate the likely progression to diabetes, dispensing with “scan 1”

References

    1. Eisenbarth GS. Type I diabetes mellitus. N. Engl. J. Med. 1986;314:1360–1368. doi: 10.1056/NEJM198605223142106. - DOI - PubMed
    1. Atkinson MA, Eisenbarth GS, Michels AW. Type 1 diabetes. Lancet. 2014;383:69–82. doi: 10.1016/S0140-6736(13)60591-7. - DOI - PMC - PubMed
    1. Insel RA, et al. Staging presymptomatic Type 1 diabetes: a scientific statement of JDRF, the Endocrine Society, and the American Diabetes Association. Diabetes Care. 2015;38:1964–1974. doi: 10.2337/dc15-1419. - DOI - PMC - PubMed
    1. Skyler JS, et al. Type 1 diabetes TrialNet--an international collaborative clinical trials network. Ann. N. Y. Acad. Sci. 2008;1150:14–24. doi: 10.1196/annals.1447.054. - DOI - PMC - PubMed
    1. Bluestone JA, Herold K, Eisenbarth G. Genetics, pathogenesis and clinical interventions in Type 1 diabetes. Nature. 2010;464:1293–1300. doi: 10.1038/nature08933. - DOI - PMC - PubMed

Publication types