. 2018 May 1;8(1):6815.
doi: 10.1038/s41598-018-24578-7.

Genome-wide Analysis of Large-scale Longitudinal Outcomes using Penalization -GALLOP algorithm

Affiliations

Genome-wide Analysis of Large-scale Longitudinal Outcomes using Penalization -GALLOP algorithm

Karolina Sikorska et al. Sci Rep. .

Abstract

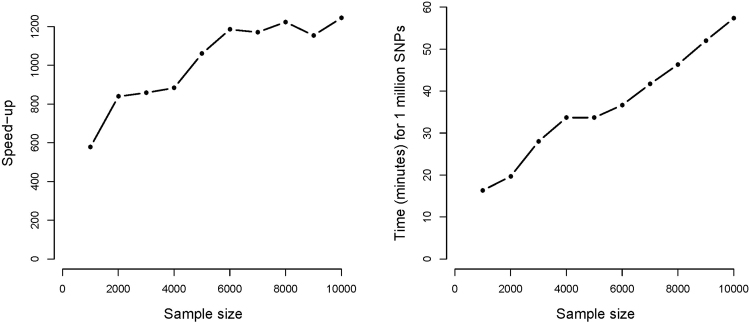
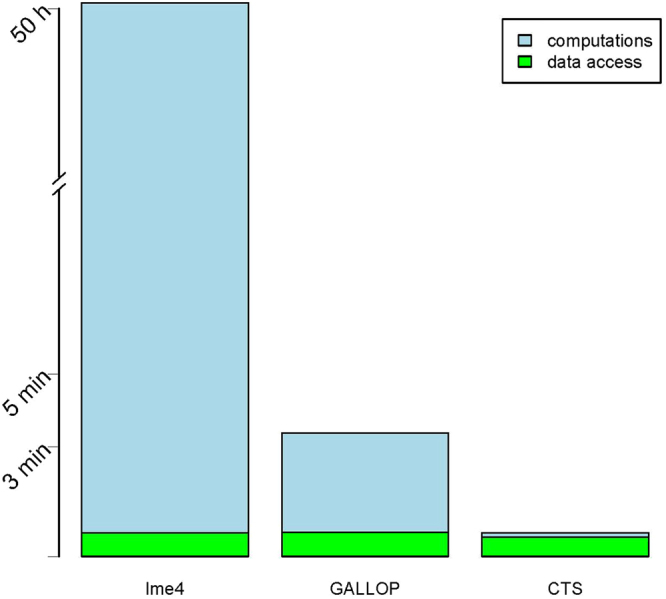
Genome-wide association studies (GWAS) with longitudinal phenotypes provide opportunities to identify genetic variations associated with changes in human traits over time. Mixed models are used to correct for the correlated nature of longitudinal data. GWA studies are notorious for their computational challenges, which are considerable when mixed models for thousands of individuals are fitted to millions of SNPs. We present a new algorithm that speeds up a genome-wide analysis of longitudinal data by several orders of magnitude. It solves the equivalent penalized least squares problem efficiently, computing variances in an initial step. Factorizations and transformations are used to avoid inversion of large matrices. Because the system of equations is bordered, we can re-use components, which can be precomputed for the mixed model without a SNP. Two SNP effects (main and its interaction with time) are obtained. Our method completes the analysis a thousand times faster than the R package lme4, providing an almost identical solution for the coefficients and p-values. We provide an R implementation of our algorithm.


Conflict of interest statement

The authors declare no competing interests.

Figures

Figure 1
Figure 1
Speed-up compared to the lmer function in R. Results based on the simulated data for 1000 SNPs, 4 time points and 3 covariates. Performed on a 64-bit Windows running on a laptop with CPU @ 2.3 GHz and 6 GB RAM.
Figure 2
Figure 2
Simulation study. Accuracy of the coefficients computed by GALLOP compared to lmer.
Figure 3
Figure 3
Simulation study. Accuracy of the p-values computed by GALLOP compared to lmer.
Figure 4
Figure 4
BMD data. Accuracy of the p-values for the GALLOP and CTS.
Figure 5
Figure 5
Time of the genome-wide analysis of the BMD data, 97384 SNPs from chromosome 22. Time spent on data access and time spent on computations are separated.

References

    1. Speed D, Hemani G, Johnson MR, Balding DJ. Improved heritability estimation. The American Journal of Human Genetics. 2012;91:1011–1021. doi: 10.1016/j.ajhg.2012.10.010. - DOI - PMC - PubMed
    1. Yang J, et al. Common SNPs explain a large proportion of the heritability for human height. Nature Genetics. 2010;42:565–569. doi: 10.1038/ng.608. - DOI - PMC - PubMed
    1. Shin J, Lee C. A mixed model reduces spurious genetic associations produced by population stratification in genome-wide association studies. Genomics. 2015;105:191–196. doi: 10.1016/j.ygeno.2015.01.006. - DOI - PubMed
    1. Price AL, Zaitlen NA, Reich D, Patterson N. New approaches to population stratification in genome-wide association studies. Nature Reviews Genetics. 2010;11:459–463. doi: 10.1038/nrg2813. - DOI - PMC - PubMed
    1. Lippert C, et al. FaST linear mixed models for genome-wide association studies. Nature Methods. 2011;8:833–835. doi: 10.1038/nmeth.1681. - DOI - PubMed

LinkOut - more resources