. 2018 Jun;83(6):1218-1227.
doi: 10.1038/pr.2018.49. Epub 2018 May 2.

Upregulation of cholesterol 24-hydroxylase following hypoxia-ischemia in neonatal mouse brain

Affiliations

Upregulation of cholesterol 24-hydroxylase following hypoxia-ischemia in neonatal mouse brain

Fuxin Lu et al. Pediatr Res. 2018 Jun.

Abstract

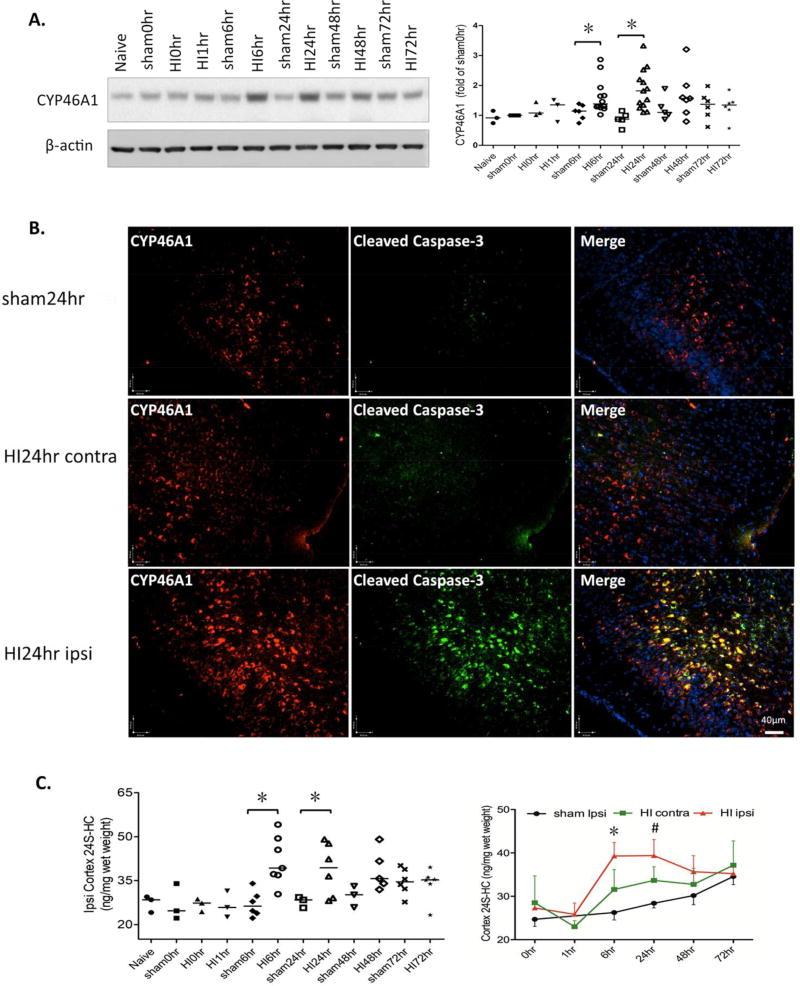
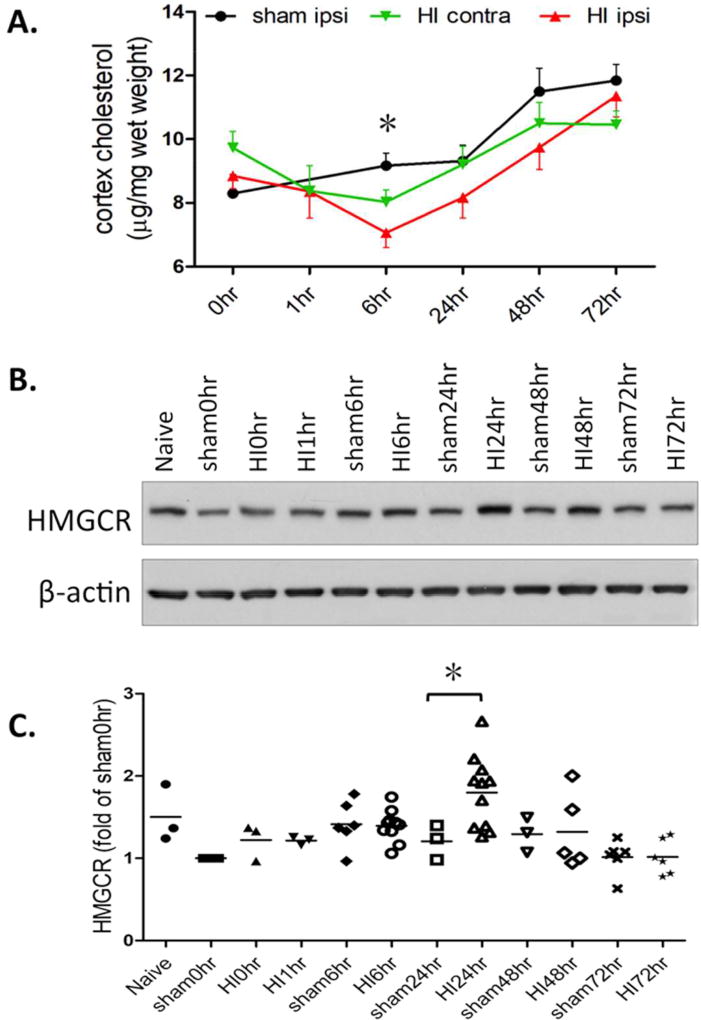
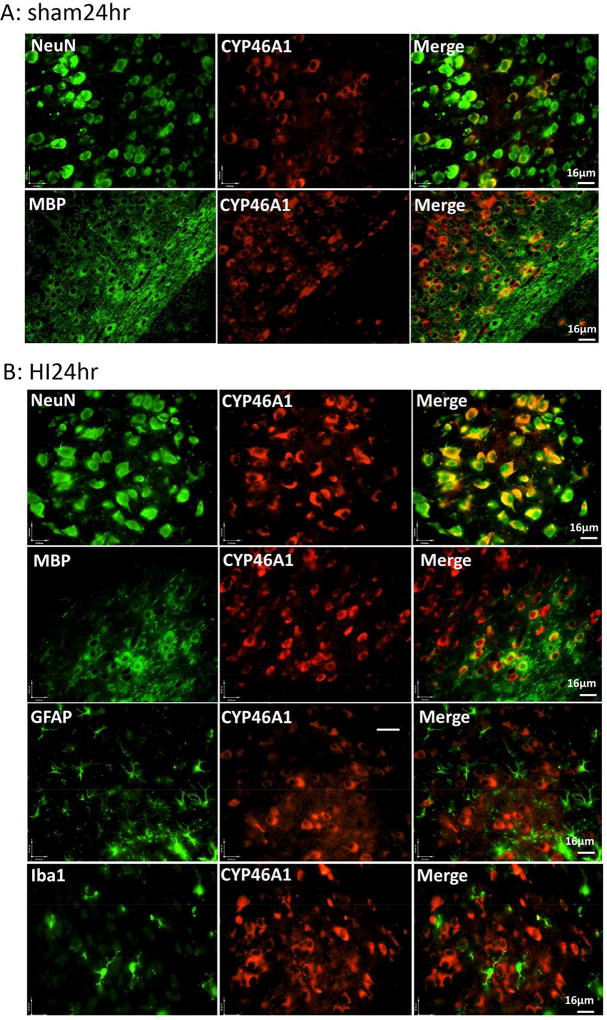
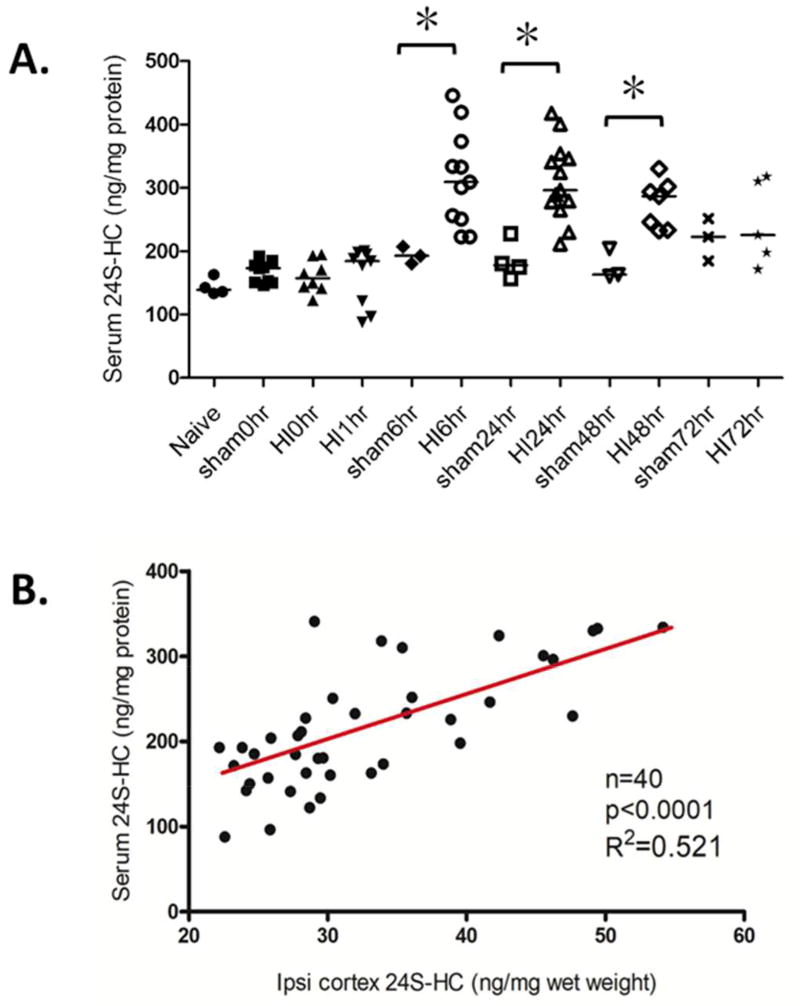
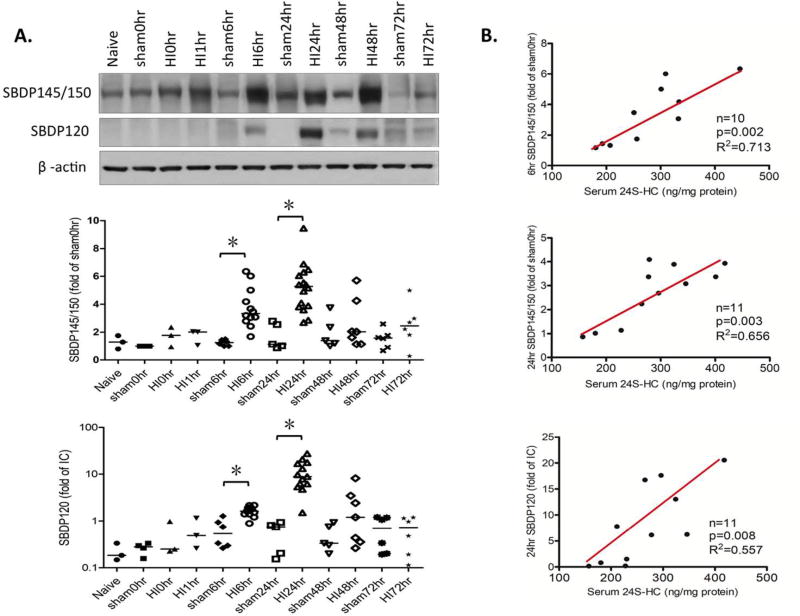
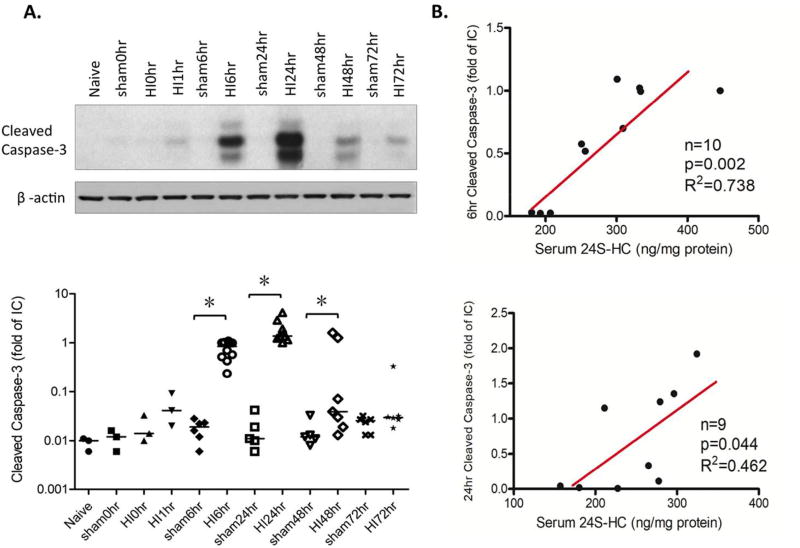
BackgroundMaintenance of cholesterol homeostasis is crucial for brain development. Brain cholesterol relies on de novo synthesis and is cleared primarily by conversion to 24S-hydroxycholesterol (24S-HC) with brain-specific cholesterol 24-hydroxylase (CYP46A1). We aimed to investigate the impact of hypoxia-ischemia (HI) on brain cholesterol metabolism in the neonatal mice.MethodsPostnatal day 9 C57BL/6 pups were subjected to HI using the Vannucci model. CYP46A1 expression was assessed with western blotting and its cellular localization was determined using immunofluorescence staining. The amount of brain cholesterol, 24S-HC in the cortex and in the serum, was measured with enzyme-linked immunosorbent assay (ELISA).ResultsThere was a transient cholesterol loss at 6 h after HI. CYP46A1 was significantly upregulated at 6 and 24 h following HI with a concomitant increase of 24S-HC in the ipsilateral cortex and in the serum. The serum levels of 24S-HC correlated with those in the brain, as well as with necrotic and apoptotic cell death evaluated by the expression of spectrin breakdown products and cleaved caspase-3 at 6 and 24 h after HI.ConclusionEnhanced cholesterol turnover by activation of CYP46A1 represents disrupted brain cholesterol homeostasis early after neonatal HI. 24S-HC might be a novel blood biomarker for severity of hypoxic-ischemic encephalopathy with potential clinical application.


Conflict of interest statement

Disclosure: The authors have no conflicts of interest and no financial relationships relevant to this article to disclose.

Figures

Figure 1
Figure 1
Up-regulation of CYP46A1 with a concomitant increase of 24S-HC in the ipsilateral cortex after neonatal HI. A. Protein expression of CYP46A1 was measured by western blotting at the indicated time points and presented as the OD ratio to β-actin and normalized to the values of sham 0hr (graph on the right, sham vs. HI: * p= 0.0339 at 6hr; * p=0.0026 at 24hr; n=5–6 for sham animals, n=6–12 for HI animals at 6–72hr). B. Immunofluorescent staining with anti-CYP46A1 antibody at 24hr after HI showed enhanced expression in the ipsilateral cortex than that in the contralateral side and in the sham animals (left panels). CYP46A1 staining in the ipsi-cortex was largely co-localized with the expression of cleaved caspase-3 (middle panels). C. Increased production of 24S-HC (ng/mg tissue wet weight) in the ipsilateral cortex at 6hr and 24hr after HI (sham vs. HI: *p= 0.0167 at 6hr; *p=0.0085 at 24hr; n=3–6 for sham animals, n=5–7 for HI animals at 6–72hr). The time course of the changes in 24S-HC in the sham-, contra- and ipsilateral cortex is shown on the right. At 6hr, 24S-HC in the ipsilateral cortex was higher than that in the contralateral side (ipsi- vs. contra-: *p=0.0493). #: Significant difference between the HI ipsi- and the sham animals only, but not between the HI ipsi- and HI contralateral hemisphere.
Figure 2
Figure 2
Transient cholesterol loss in the ipsilateral cortex at 6hr after neonatal HI. A. The time course of the changes in cholesterol amount in the sham-, contra- and ipsilateral cortex following neonatal HI (sham vs. HI ipsi: * p=0.0304 at 6hr; n=4–7 for each time points). B. Protein expression of HMGCR in the sham and HI-injured cortices was measured by western blotting at the indicated time points. C. HMGCR expression is presented as the OD ratio to β-actin and normalized to the values of sham 0hr (sham vs. HI: *p=0.047 at 24hr, n=3–11).
Figure 3
Figure 3
Expression of CYP46A1 in the neurons and oligodendrocytes. Images of double Immunofluorescent staining with CYP46A1 antibody (red, middle panels) paired with another antibody specific for neuron (NeuN), oligodendrocyte (MBP), astrocyte (GFAP), or microglia (Iba1), shown in green on the left panels. The representative images from the sham (A) and HI-injured animals at 24hr after HI (B).
Figure 4
Figure 4
Correlation of the 24S-HC levels in the serum and in the ipsilateral cortex after neonatal HI. A. Quantification of the serum levels of 24S-HC (ng/mg serum protein) at the indicated post-HI time points. Sham vs. HI, *p=0.0102 at 6hr; *p=0.0046 at 24hr; *p=0.0167 at 48hr; n=3–6 for sham animals, n=5–13 for HI animals at 6–72hr. B. Correlation of 24S-HC levels in the serum and in the ipsilateral cortex. The samples used in Pearson’s correlation coefficient analysis were those included in Fig. 1C. (n = 40, R2=0.521, p< 0.0001).
Figure 5
Figure 5
Correlation of the serum levels of 24S-HC with the expression of spectrin breakdown products (SBDP) at 6hr and 24hr after neonatal HI. A. Protein expression of SBDP145/150KD and SBDP120KD in the cortices was measured by western blotting at the indicated time points and presented as the OD ratio to β-actin and normalized to the values of sham 0hr (for SBDP145/150), or an internal control (IC, for SBDP120). For SBDP145/150KD, sham vs. HI, *p=0.0094 at 6hr, *p=0.0013 at 24hr. For SBDP120KD, sham vs. HI, *p=0.036 at 6hr, *p=0.0087 at 24hr. (n=4–6 for sham animals, n=6–15 for HI animals from 6–72hr). B. Correlation of the serum levels of 24S-HC with the expression of SBDP145/150KD at 6hr (top), at 24hr (middle), and with the expression of SBDP120KD at 24hr (bottom). Sample number, R2 and p values are shown in the graphs.
Figure 6
Figure 6
Correlation of the serum levels of 24S-HC with the expression of cleaved caspase-3 at 6hr and 24hr after neonatal HI. A. Protein expression of cleaved caspase-3 in the cortices was measured by western blotting at the indicated time points and presented as the OD ratio to β-actin and normalized to an internal control (IC). Sham vs. HI, *p=0.0112 at 6hr; *p=0.0027 at 24hr; *p=0.0228 at 72hr (n=5–6 for sham animals, n=7–10 for HI animals from 6–72hr). B. Correlation of the serum levels of 24S-HC with the expression of cleaved caspase-3 at 6hr (top) and at 24hr (bottom). Sample number, R2 and p values are shown in the graphs.

References

    1. Mauch DH, Nagler K, Schumacher S, et al. CNS synaptogenesis promoted by glia-derived cholesterol. Science. 2001;294:1354–7. - PubMed
    1. Saher G, Brugger B, Lappe-Siefke C, et al. High cholesterol level is essential for myelin membrane growth. Nat Neurosci. 2005;8:468–75. - PubMed
    1. Dietschy JM. Central nervous system: cholesterol turnover, brain development and neurodegeneration. Biol Chem. 2009;390:287–93. - PMC - PubMed
    1. Dietschy JM, Turley SD. Thematic review series: brain Lipids. Cholesterol metabolism in the central nervous system during early development and in the mature animal. J Lipid Res. 2004;45:1375–97. - PubMed
    1. Quan G, Xie C, Dietschy JM, Turley SD. Ontogenesis and regulation of cholesterol metabolism in the central nervous system of the mouse. Brain Res Dev Brain Res. 2003;146:87–98. - PubMed

Publication types

MeSH terms