. 2018 Aug 14;218(6):946-955.
doi: 10.1093/infdis/jiy223.

Drug-Resistance and Population Structure of Plasmodium falciparum Across the Democratic Republic of Congo Using High-Throughput Molecular Inversion Probes

Affiliations

Drug-Resistance and Population Structure of Plasmodium falciparum Across the Democratic Republic of Congo Using High-Throughput Molecular Inversion Probes

Ozkan Aydemir et al. J Infect Dis. .

Abstract

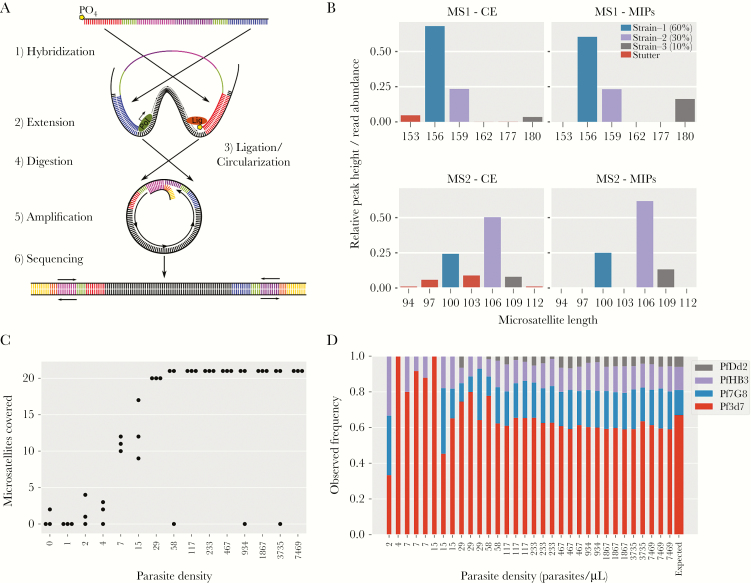
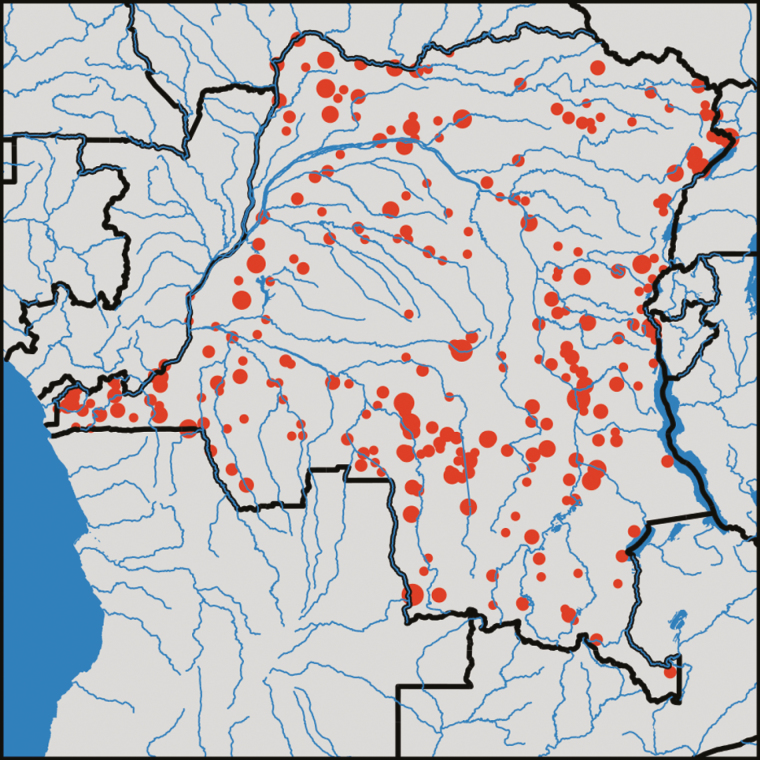
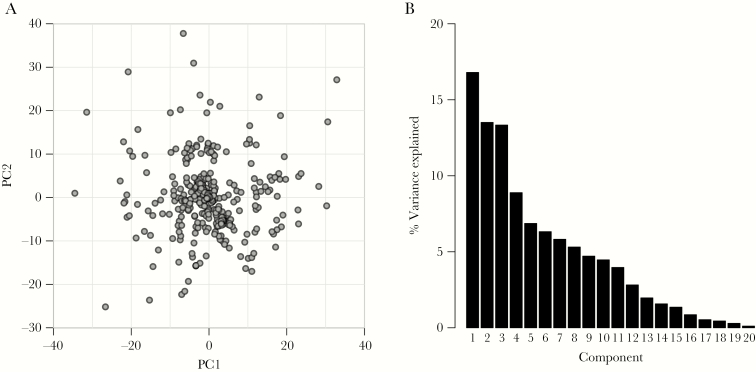
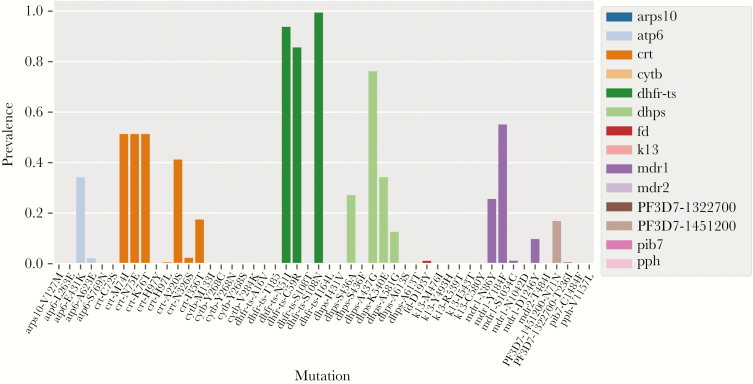
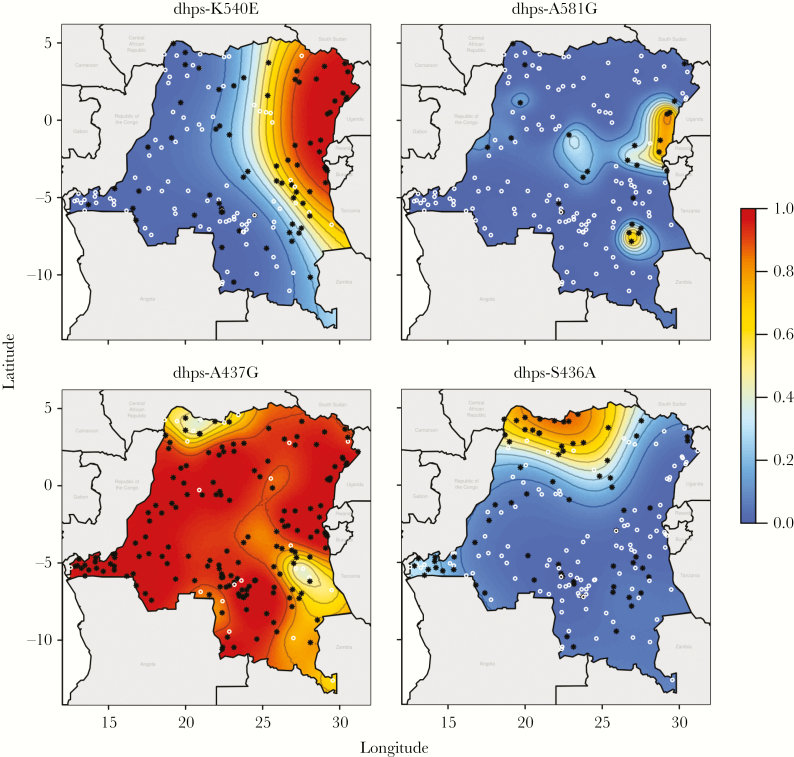
A better understanding of the drivers of the spread of malaria parasites and drug resistance across space and time is needed. These drivers can be elucidated using genetic tools. Here, a novel molecular inversion probe (MIP) panel targeting all major drug-resistance mutations and a set of microsatellites was used to genotype Plasmodium falciparum infections of 552 children from the 2013-2014 Demographic and Health Survey conducted in the Democratic Republic of the Congo (DRC). Microsatellite-based analysis of population structure suggests that parasites within the DRC form a homogeneous population. In contrast, sulfadoxine-resistance markers in dihydropteroate synthase show marked spatial structure with ongoing spread of double and triple mutants compared with 2007. These findings suggest that parasites in the DRC remain panmictic despite rapidly spreading antimalarial-resistance mutations. Moreover, highly multiplexed targeted sequencing using MIPs emerges as a cost-effective method for elucidating pathogen genetics in complex infections in large cohorts.


Figures

Figure 1.
Figure 1.
Molecular inversion probe (MIP) assay and performance on laboratory control mixtures. A, The MIP capture is illustrated showing the key steps of MIP arm hybridization, polymerase extension, and gap ligation to form a single-stranded circle. Exonuclease digestion removes linear template DNA, thereby relatively enriching for the circular captures, which are then amplified using universal primers along with a sample barcode. Important components are color coded: extension arm (blue), ligation arm (red) molecular identifiers (green), and backbone (pink+purple). B, An example of microsatellite (MS) stutter seen in standard capillary electrophoresis versus MIPs where stutter is detected and removed based on inconsistency within unique molecular identifiers. C, The coverage of the 21 assessed MSs, demonstrating that apart from a few failed reactions the vast majority of MSs are detected in every sample until dilutions of 29 parasites/uL. D, Frequency estimates of the 4-strain mixture compared with expected frequency (last bar on right, drawn wider for emphasis) based on relative amounts of DNA from each strain. Abbreviations: CE, capillary electrophoresis; MIP, molecular inversion probe; MS, microsatellite.
Figure 2.
Figure 2.
Distribution of 552 children with captured sequence. These samples were distributed across the Democratic Republic of the Congo without significant differences in the spatial distribution compared with the overall sample set or to the overall Demographic and Health Survey. The circle diameter is proportional to the number of samples from a given GPS location.
Figure 3.
Figure 3.
Principal component analysis across the Democratic Republic of the Congo. A, Scatterplot of the first and second principal components from the principal component analysis of the 20 microsatellites. B, Histogram of the percentage of variance accounted for by all 20 components. The first 2 components account for 30% of the total variation and show no clear population structure. Abbreviation: PC, principal component.
Figure 4.
Figure 4.
Countrywide prevalence of known drug-resistance mutations in infected individuals. Mutations are color-coded by gene showing the proportion of infections carrying known resistance-associated mutations. No known artemisinin-resistance mutations were observed.
Figure 5.
Figure 5.
Spatial distribution of pfdhps mutations. Estimated prevalence of pfdhps K540E, A581G, A437G, and S436A mutations in the Democratic Republic of the Congo. White circles indicate clusters where only wild-type alleles were found; black stars indicate clusters where at least 1 mutation was found. Contours are at 10% prevalence levels.

References

    1. World Health Organization. World malaria report 2017 http://www.who.int/malaria/publications/world-malaria-report-2017/report.... Accessed 2 February 2018.
    1. Nkumama IN, O’Meara WP, Osier FHA. Changes in malaria epidemiology in Africa and new challenges for elimination. Trends Parasitol 2017; 33:128–40. - PMC - PubMed
    1. Kaufmann C, Briegel H. Flight performance of the malaria vectors Anopheles gambiae and Anopheles atroparvus. J Vector Ecol 2004; 29:140–53. - PubMed
    1. Ferguson HM, Dornhaus A, Beeche A, et al. Ecology: a prerequisite for malaria elimination and eradication. PLoS Med 2010; 7:e1000303. - PMC - PubMed
    1. Anderson TJ, Roper C. The origins and spread of antimalarial drug resistance: lessons for policy makers. Acta Trop 2005; 94:269–80. - PubMed

Publication types