. 2018 Jun 20;46(11):5547-5560.
doi: 10.1093/nar/gky281.

The KDM4A/KDM4C/NF-κB and WDR5 epigenetic cascade regulates the activation of B cells

Affiliations

The KDM4A/KDM4C/NF-κB and WDR5 epigenetic cascade regulates the activation of B cells

Kuo-Hsuan Hung et al. Nucleic Acids Res. .

Abstract

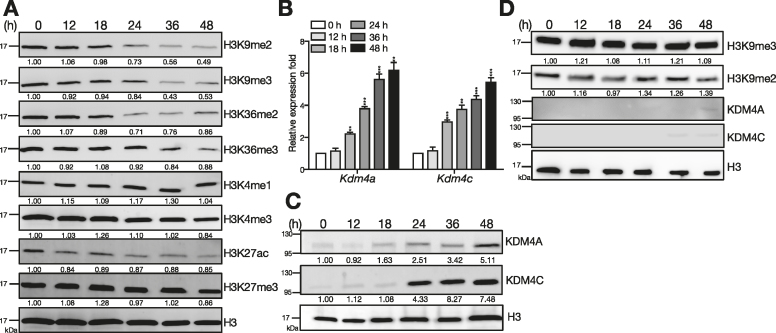
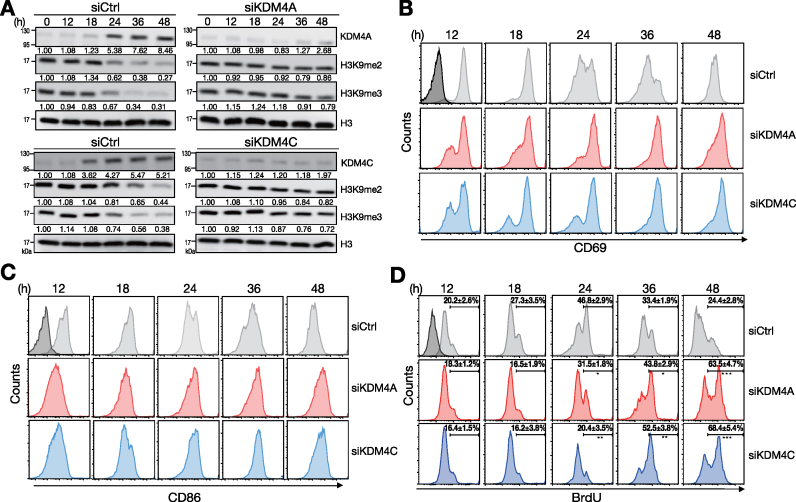
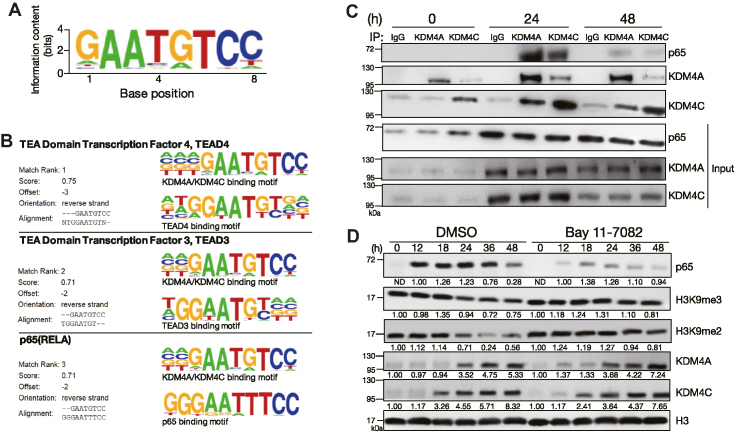
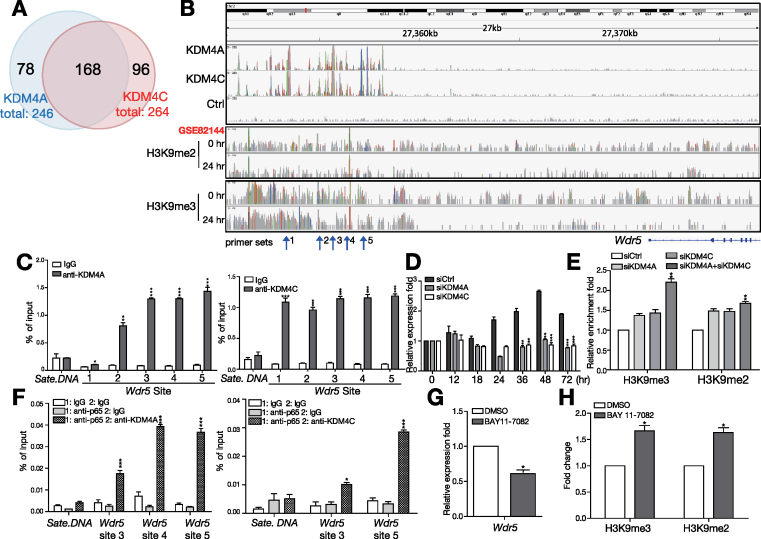
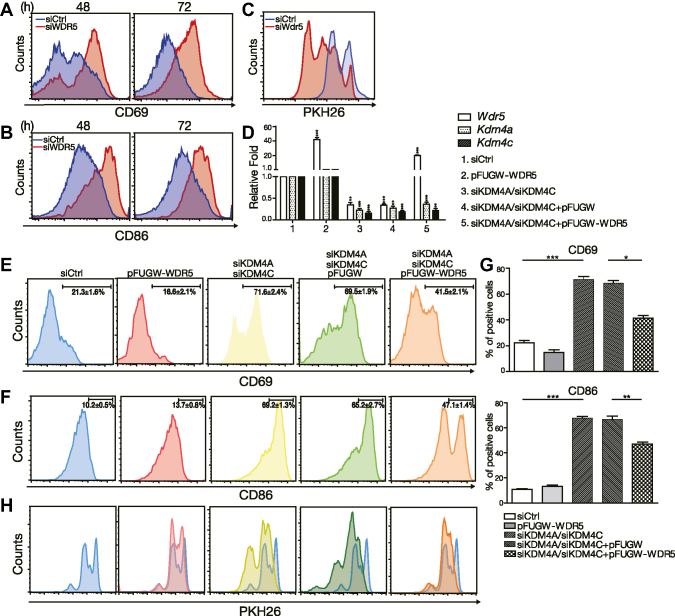
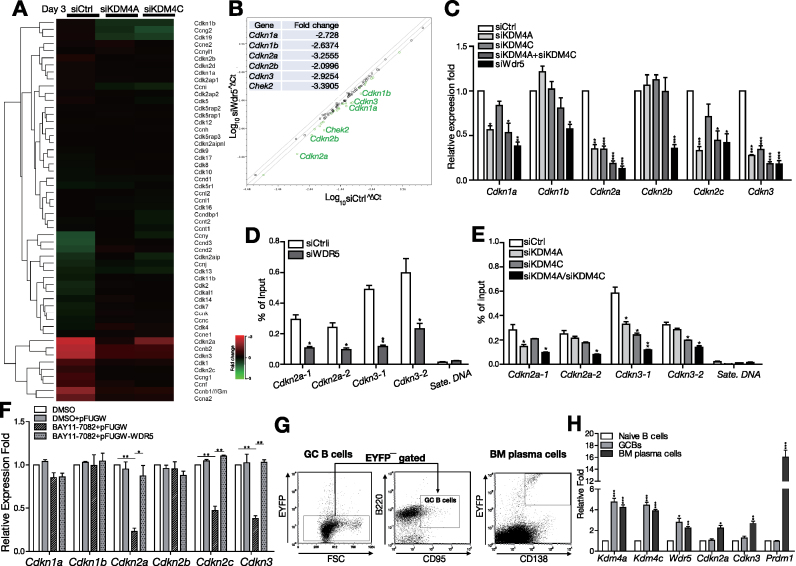
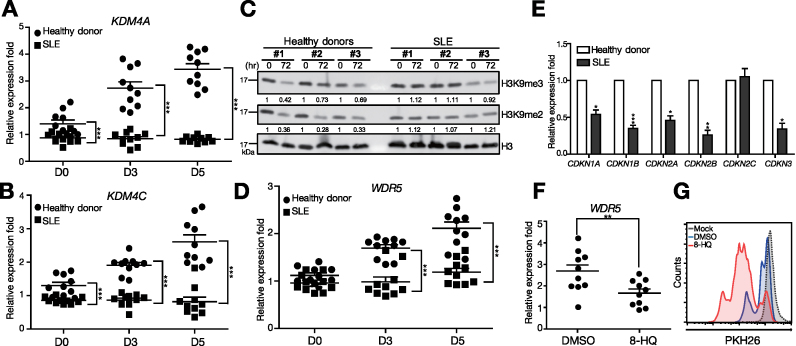
T follicular helper (Tfh) cell-derived signals promote activation and proliferation of antigen-primed B cells. It remains unclear whether epigenetic regulation is involved in the B cell responses to Tfh cell-derived signals. Here, we demonstrate that Tfh cell-mimicking signals induce the expression of histone demethylases KDM4A and KDM4C, and the concomitant global down-regulation of their substrates, H3K9me3/me2, in B cells. Depletion of KDM4A and KDM4C potentiates B cell activation and proliferation in response to Tfh cell-derived signals. ChIP-seq and de novo motif analysis reveals NF-κB p65 as a binding partner of KDM4A and KDM4C. Their co-targeting to Wdr5, a MLL complex member promoting H3K4 methylation, up-regulates cell cycle inhibitors Cdkn2c and Cdkn3. Thus, Tfh cell-derived signals trigger KDM4A/KDM4C - WDR5 - Cdkn2c/Cdkn3 cascade in vitro, an epigenetic mechanism regulating proper proliferation of activated B cells. This pathway is dysregulated in B cells from systemic lupus erythematosus patients and may represent a pathological link.


Figures

Figure 1.
Figure 1.
Up-regulation of KDM4A and KDM4C and reduction of H3K9me2/me3 is found following stimulation of B cells by Tfh-cell derived signals. (A) Levels of histone markers detected by immunoblotting (IB) with nuclear extracts from [HEL + anti-CD40 + IL-21]-stimulated splenic B cells from MD4 mice at indicated time points. (B, C) Kdm4a and Kdm4c mRNA (B) and protein (C) levels at indicated time points in stimulated splenic B cells isolated from MD4 mice. Lamin B was used as the protein loading control in (C). (D) Levels of H3K9me2, H3K9me3, KDM4A, and KDM4C detected by IB with nuclear extracts from LPS (2.5 μg/ml) stimulated splenic B cells from C57BL/6 mice at indicated time points. H3 is served as the loading control. The relative levels of indicated proteins in (A) (C) and (D) after quantification were indicated. Results in (B) represent the mean ± SEM (n = 3). **P < 0.01, ***P < 0.005 (Student's t-test).
Figure 2.
Figure 2.
B cell activation and proliferation sustains by depletion of KDM4A or KDM4C. (A) Immunoblot showing the levels of KDM4A, KDM4C and H3K9me2/me3 histone modification markers in [HEL + anti-CD40 + IL-21]-stimulated MD4 splenic B cells transfected with control siRNA or siRNA-pools against KDM4A or KDM4C. (B, C) FACS analysis showing the levels of activation markers CD69 (B) and CD86 (C) on stimulated MD4 splenic B cells after depletion of KDM4A or KDM4C at indicated time points. (D) FACS analysis showing the frequencies of BrdU incorporation in stimulated MD4 splenic B cells transfected with siCtrl, siKDM4A- or siKDM4C-pools at indicated time points. Relative levels of indicated proteins in (A) after quantification were indicated. Results are the mean ± SD (n = 3) in (D). *P < 0.05, **P < 0.01, *** P < 0.005 (Student's t-test). Dark-shaded histograms in (B), (C) and (D) represent the levels of indicated molecules at day 0.
Figure 3.
Figure 3.
KDM4A, KDM4C and NF-κB temporarily form a complex during B cell activation. (A) Consensus KDM4A and KDM4C-binding motif identified using the de novo motif-discovery program Homer Software, P = 1 × 10−42. (B) Analysis of de novo discovery of ChIP-seq peaks derived from the common motif of KDM4A and KDM4C binding sites revealed the top three transcription factor binding motifs. (C) Co-immunoprecipitation (co-IP) using nuclear extracts from MD4 mouse splenic B cells stimulated with HEL + anti-CD40 + IL-21, followed by immunoblot showing the interaction of NF-κB p65 with KDM4A and KDM4C 24 h after stimulation. Rabbit IgG was used as the control antibody in the immunoprecipitation. (D) Immunoblot and quantitative analysis showing the levels of indicated nuclear proteins in stimulated MD4 mouse splenic B cells treated with 15 μM of BAY 11-7082 NF-κB inhibitor at indicated time points. Relative levels of indicated proteins in (D) after quantification were indicated.
Figure 4.
Figure 4.
WDR5 is identified as the direct target of KDM4A and KDM4C in activated B cells primed by Tfh-derived signals. (A) Venn diagram of the number of overlapping genes identified by ChIP-seq with anti-KDM4A and anti-KDM4C. (B) Representative Integrative Genomics Viewer (IGV) tracks near Wdr5 loci showing the binding profiles of KDM4A, KDM4C and indicated histone marks. Tracks from top to bottom are ChIP-seq peaks of KDM4A, KDM4C, Ctrl in 24 hr stimulated with HEL + anti-CD40 + IL-21 in B cells, ChIP-seq peaks of H3K9me2 and H3K9me3 in resting or stimulated B cells. (C) qPCR using primer sets indicated in (B) and anti-KDM4A (left panel) and anti-KDM4C (right panel) immunoprecipitated chromatin from MD4 mouse splenic B cells stimulated with HEL + anti-CD40 + IL-21 for 24 h. Satellite DNA (Sate. DNA) was used as the negative control locus. (D) RT-qPCR showing Wdr5 mRNA levels in stimulated MD4 B cells transfected with indicated siRNA at various time points. (E) ChIP showing the levels of H3K9me2/me3 on Wdr5 site 5 in stimulated B cells transfected with indicated siRNA. (F) ChIP and re-ChIP showing the co-binding of NF-κB p65 with KDM4A (left panel) or KDM4C (right panel) to indicated Wdr5 loci in stimulated MD4 B cells at 24 h. (G) RT-qPCR showing the levels of WDR5 mRNA in stimulated B cells treated with DMSO or 15 μM BAY 11-7082 for 24 h. (H) ChIP showing the levels of H3K9me2/me3 on WDR5 in stimulated B cells in (G). Results in (C)−(H) represent the mean ± SEM (n = 3). *P < 0.05, **P < 0.01, *** P < 0.005 (Student's t-test).
Figure 5.
Figure 5.
WDR5 regulates B cell activation. (A, B) FACS analysis showing the levels of surface CD69 (A) and CD86 (B) on [HEL + anti-CD40 + IL-21]-stimulated MD4 mouse splenic B cells depleted of WDR5 by siRNA-pools. (C) PKH26 labeling assay showing cell proliferation of siCtrl or siWdr5-pools transfected MD4 B cells, and [HEL + anti-CD40 + IL-21]-stimulated MD4 B cells. (D) The indicated mRNA levels from 3-day [HEL + anti-CD40 + IL-21]-stimulated MD4 B cells treated with the indicated reagents, siCtrl or siWDR5-pools, and/or lentiviral vector alone (vector) or vector expressing WDR5. (E−H) FACS analysis of cells from (D) showing the levels of surface CD69 (E) and CD86 (F) as well as the dilution of PKH26 (H). Bar graphs of the percentage of CD69 (E) and CD86 (F) positive cells were shown in (G). Blue histograms in (H) are overlaid from the DMSO treated group for comparison. Results in (D)-(G) represent the mean ± SEM (n = 3). *P < 0.05, ** P< 0.01, *** P < 0.005 (Student's t-test).
Figure 6.
Figure 6.
WDR5 controls the induction of CDKNs in the activation of B cells. (A) Heatmap showing the expression levels of several cell cycle-related genes after 3 days culturing of stimulated MD4 splenic B cells transfected with siCtrl, siKDM4A or siKDM4C. (B) Scatter plot of the results of RT-multiplex qPCR from stimulated MD4 B cells treated with either siWDR5-pools or siCtrl for 72 h. The most significantly reduced fold changes in gene expression in siWdr5 cells are indicated in the inserted table. (C) RT-qPCR validating that the mRNA levels of several Cdkns were decreased at 72 h in stimulated MD4 B cells transfected with siWDR5-pools, siKDM4A-pools and/or siKDM4C-pools. (D, E) ChIP showing the levels of H3K4me3 on the indicated gene loci in stimulated mouse MD4 B cells transfected with indicated siRNAs for 24 h. Satellite DNA (Sate. DNA) was used as the negative control locus. (F) The mRNA levels of indicated Cdkns at 72 h after stimulation with [HEL + anti-CD40 + IL-21] and treatment with the indicated reagents, DMSO or Bay11-7082, and/or lentiviral vector alone (pFUGW) or vector expressing WDR5, in MD4 B cells. (G, H) The indicated mRNA levels in B220+ splenic B cells isolated from naïve C57BL/6 mice, EYFPB220+CD95+ GC B cells isolated from the spleen of Prdm1EYFP/+ mice 2 weeks after primary immunization, and EYFP+CD138+ plasma cells isolated from the bone marrow of Prdm1EYFP/+ mice 1 week after secondary immunization. The cell sorting strategies used to isolate splenic EYFPB220+CD95+ GC B and EYFP+CD138+ plasma cells are shown in (G). Results in (C), (D), (E), (F) and (H) are the mean ± SEM (n = 3). *P < 0.05, **P < 0.01, *** P < 0.005 (Student's t-test).
Figure 7.
Figure 7.
The expression of KDM4A, KDM4C and WDR5 is dys-regulated in SLE B cells. (A, B) mRNA levels of KDM4A (A) and KDM4C (B) in [anti-IgM + IL-21 + anti-CD40 + BAFF]-stimulated CD19+ human B cells isolated from peripheral blood of healthy donors and SLE patients. (C) Immunoblotting showing the levels of H3K9me2/me3 histone marks at the indicated time point of [anti-IgM + IL-21 + anti-CD40 + BAFF]-stimulated CD19+ human B cells isolated from three healthy donors and three SLE patients. (D) mRNA levels of WDR5 in normal and SLE B cells as described in (A and B) at indicated days. (E) mRNA levels of various CDKNs in normal and SLE B cells as described in (A and B) at day 3. (F) WDR5 mRNA levels in healthy donor peripheral blood B cells stimulated with anti-IgM + IL-21 + anti-CD40 + BAFF and treated with 8-HQ (200 μM) or DMSO for 3 days. (G) Analysis showing PKH26 dilution in stimulated healthy donor peripheral blood B cells treated with either 8-HQ or DMSO for 3 days. Results in (A), (B), (D), (E) and (F) represent the mean ± SEM (n = 10). *P < 0.05, **P < 0.01, ***P < 0.005 (Student's t-test).

References

    1. Kouzarides T. Chromatin modifications and their function. Cell. 2007; 128:693–705. - PubMed
    1. Barski A., Cuddapah S., Cui K., Roh T.Y., Schones D.E., Wang Z., Wei G., Chepelev I., Zhao K.. High-resolution profiling of histone methylations in the human genome. Cell. 2007; 129:823–837. - PubMed
    1. Kim K.C., Geng L., Huang S.. Inactivation of a histone methyltransferase by mutations in human cancers. Cancer Res. 2003; 63:7619–7623. - PubMed
    1. Mosammaparast N., Shi Y.. Reversal of histone methylation: biochemical and molecular mechanisms of histone demethylases. Annu. Rev. Biochem. 2010; 79:155–179. - PubMed
    1. Shi Y., Lan F., Matson C., Mulligan P., Whetstine J.R., Cole P.A., Casero R.A., Shi Y.. Histone demethylation mediated by the nuclear amine oxidase homolog LSD1. Cell. 2004; 119:941–953. - PubMed

Publication types

MeSH terms

Substances