. 2018 Aug 14;218(6):966-978.
doi: 10.1093/infdis/jiy243.

Identification of Key Bacteria Involved in the Induction of Incident Bacterial Vaginosis: A Prospective Study

Affiliations

Identification of Key Bacteria Involved in the Induction of Incident Bacterial Vaginosis: A Prospective Study

Christina A Muzny et al. J Infect Dis. .

Abstract

Background: The sequence of events preceding incident bacterial vaginosis (iBV) is unclear.

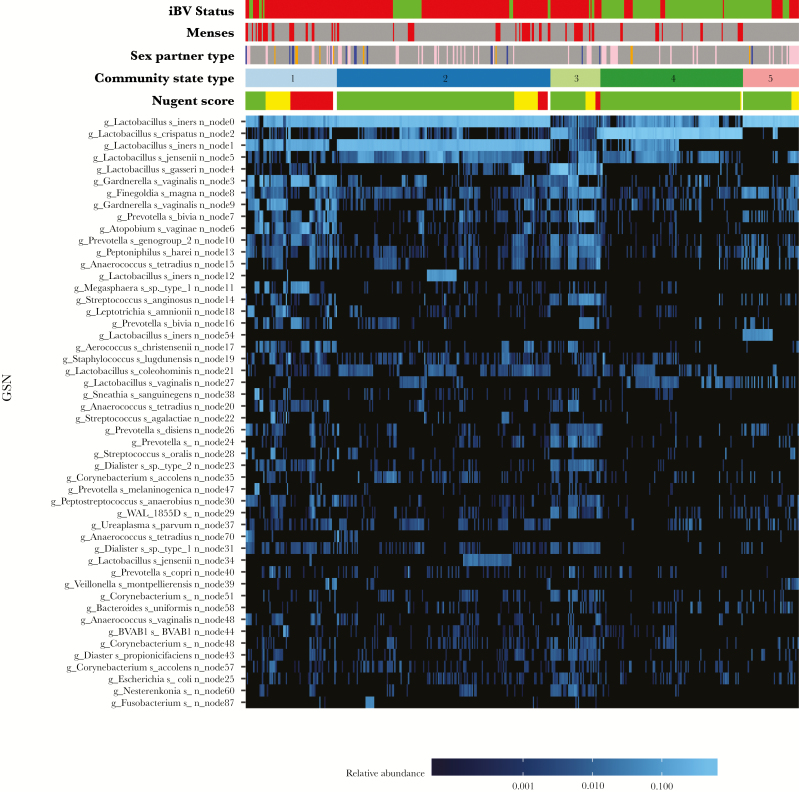
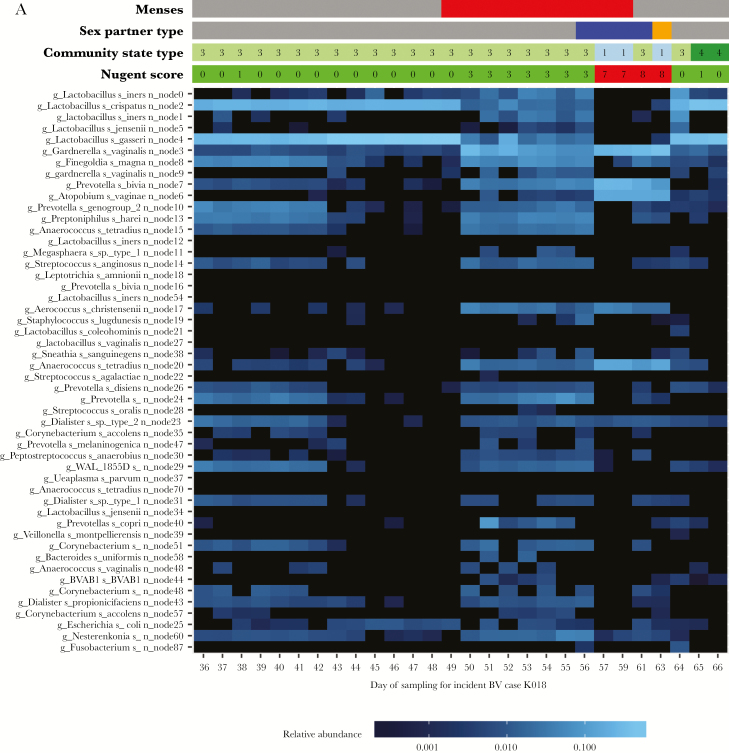
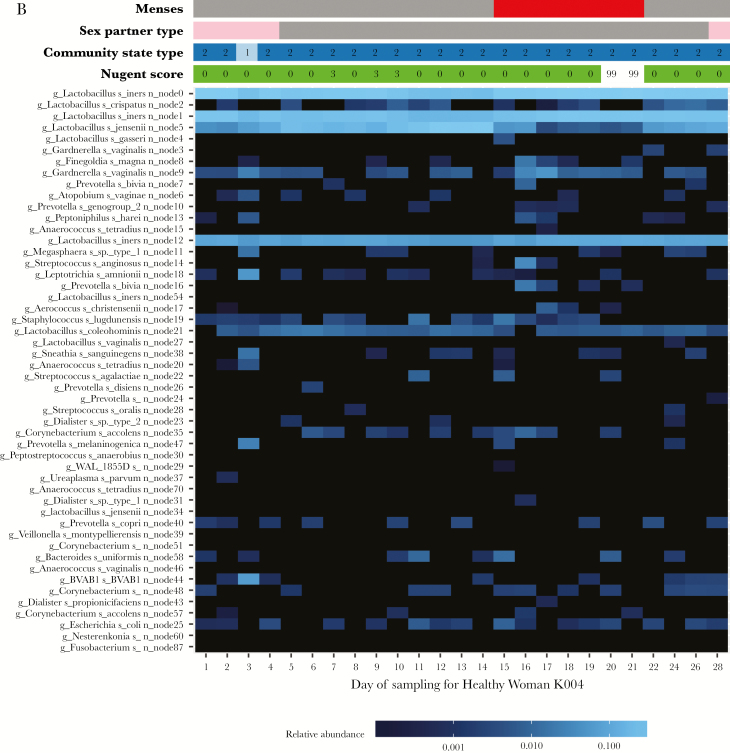
Methods: African American women who have sex with women, who had no Amsel criteria and Nugent scores of 0-3, were followed for 90 days to detect iBV (defined as a Nugent score of 7-10 on at least 2-3 consecutive days), using self-collected vaginal swab specimens. For women with iBV (cases) and women maintaining normal vaginal flora (healthy women), 16S ribosomal RNA gene sequencing targeting V4 was performed. Longitudinal vaginal microbiome data were analyzed.

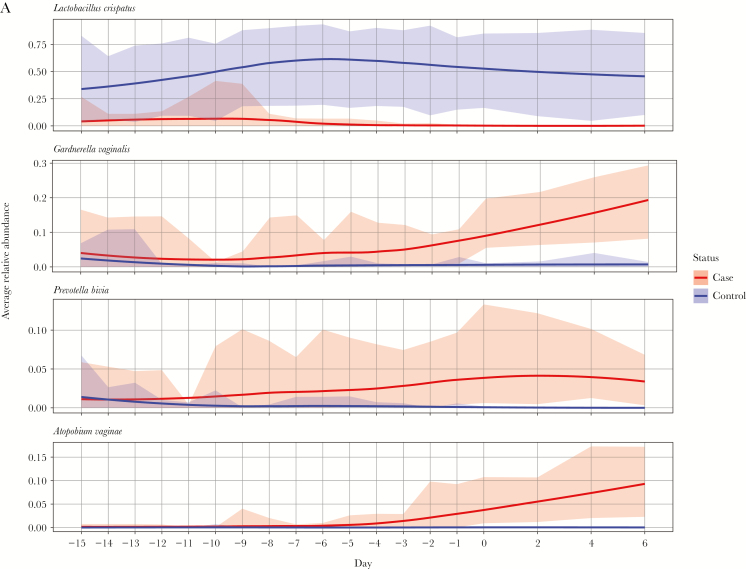
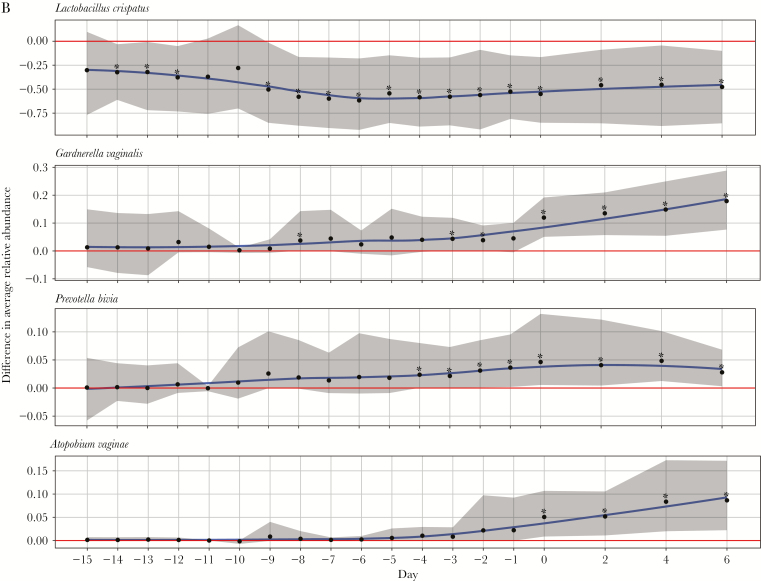
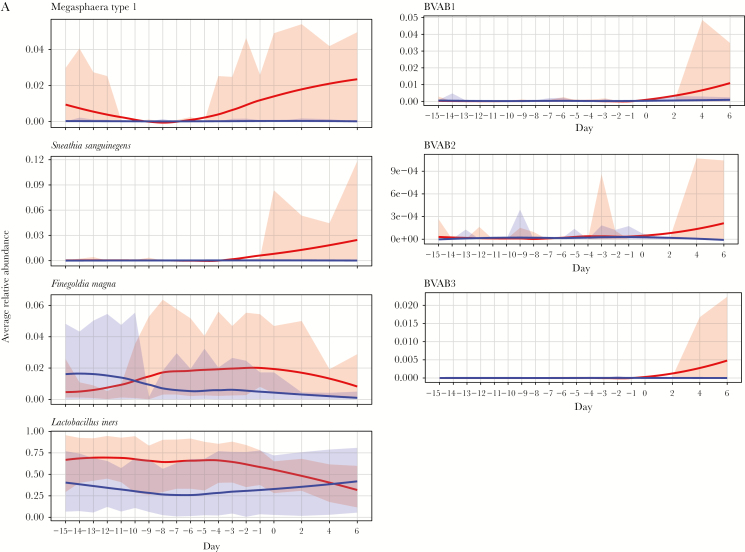
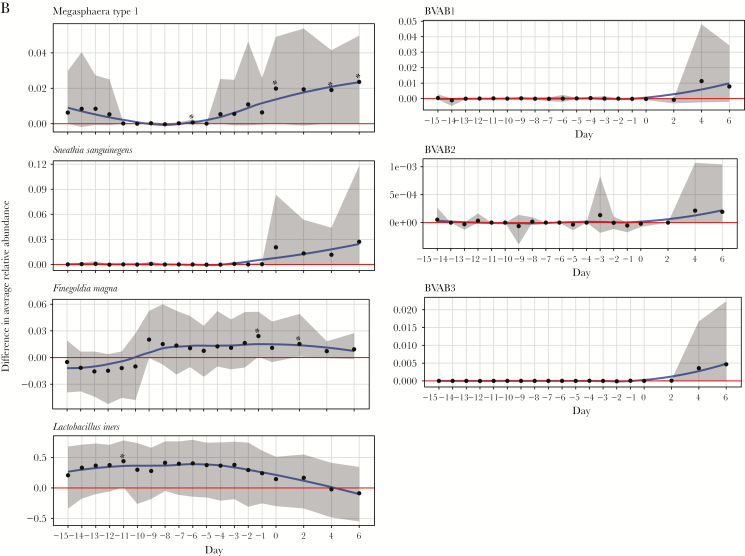
Results: Of 204 women screened, 42 enrolled; of these, 45% developed iBV. Sequencing was performed on 448 specimens from 14 cases and 8 healthy women. Among healthy women, Lactobacillus crispatus dominated the vaginal microbiota in 75%. In contrast, prior to iBV, the vaginal microbiota in 79% of cases was dominated by Lactobacillus iners and/or Lactobacillus jensenii/Lactobacillus gasseri. The mean relative abundance of Prevotella bivia, Gardnerella vaginalis, Atopobium vaginae, and Megasphaera type I became significantly higher in cases 4 days before (P. bivia), 3 days before (G. vaginalis), and on the day of (A. vaginae and Megasphaera type I) iBV onset. The mean relative abundance of Sneathia sanguinegens, Finegoldia magna, BV-associated bacteria 1-3, and L. iners was not significantly different between groups before onset of iBV.

Conclusion: G. vaginalis, P. bivia, A. vaginae, and Megasphaera type I may play significant roles in iBV.


Figures

Figure 1.
Figure 1.
Heat map displaying the top 50 most highly abundant microorganisms (in descending order) composing >95% of all reads in 443 vaginal swab specimens. Nodes, identified by the DADA2 algorithm, are unique identifiers for individual inferred sequence variants found in the sequence reads [30]. The node level classification is included in this heat map and others because there could be patterns to different sequence variants of a given species that may have biological relevance or importance. Metadata at the top of the heat map include sexual activity, by partner sex (female, pink; male, blue; and unknown, orange); incident bacterial vaginosis (iBV) status (present, red; and absent, green); menstruation status (menses, red); Nugent score (0–3, green; 4–6, yellow; and 7–10, red); and community state type (CST1, light blue; CST2, dark blue; CST3, light green; CST4, dark green; and CST5, dark pink). The scale bar (at the bottom of the heat map) provides the fractional relative abundance of a given species, on a log scale. As the blue color bar gets brighter, the relative abundance of each microorganism increases.
Figure 2.
Figure 2.
A, Heat map of a study participant with incident bacterial vaginosis (case K018). Time runs from left to right on the bottom of the heat map and is indicated by the days of study enrollment. Metadata at the top of the heat map includes sexual activity, by partner sex (female, pink; male, blue; and orange, unknown); menstruation status (menses = red); Nugent score (0–3, green; 4–6, yellow; 7–10, red; and 99, missing data); and community state type (CST1, light blue; CST2, dark blue; CST3, light green; CST4, dark green; and CST5, dark pink). The scale bar (at the bottom of the heat map) provides the fractional relative abundance of a given species, on a log scale. As the blue color bar gets brighter, the relative abundance of each microorganism increases. B, Heat map of a study participant with normal vaginal flora for the majority of the study (healthy woman K004). Time runs from left to right on the bottom of the heat map. Metadata at the top of the heat map include sexual activity, by partner sex (female, pink; male, blue; unknown, orange); menstruation status (menses, red); Nugent score (0–3, green; 4–6, yellow; and 7–10, red; missing data, 99); and community state type (CST1, light blue; CST2, dark blue; CST3, light green; CST4, dark green; and CST5, dark pink). The scale bar (at the bottom of the heat map) provides the fractional relative abundance of a given species, on a log scale. As the blue color bar gets brighter, the relative abundance of each microorganism increases.
Figure 2.
Figure 2.
A, Heat map of a study participant with incident bacterial vaginosis (case K018). Time runs from left to right on the bottom of the heat map and is indicated by the days of study enrollment. Metadata at the top of the heat map includes sexual activity, by partner sex (female, pink; male, blue; and orange, unknown); menstruation status (menses = red); Nugent score (0–3, green; 4–6, yellow; 7–10, red; and 99, missing data); and community state type (CST1, light blue; CST2, dark blue; CST3, light green; CST4, dark green; and CST5, dark pink). The scale bar (at the bottom of the heat map) provides the fractional relative abundance of a given species, on a log scale. As the blue color bar gets brighter, the relative abundance of each microorganism increases. B, Heat map of a study participant with normal vaginal flora for the majority of the study (healthy woman K004). Time runs from left to right on the bottom of the heat map. Metadata at the top of the heat map include sexual activity, by partner sex (female, pink; male, blue; unknown, orange); menstruation status (menses, red); Nugent score (0–3, green; 4–6, yellow; and 7–10, red; missing data, 99); and community state type (CST1, light blue; CST2, dark blue; CST3, light green; CST4, dark green; and CST5, dark pink). The scale bar (at the bottom of the heat map) provides the fractional relative abundance of a given species, on a log scale. As the blue color bar gets brighter, the relative abundance of each microorganism increases.
Figures 3.
Figures 3.
Variation in trends of mean relative abundance of Lactobacillus crispatus, Gardnerella vaginalis, Prevotella bivia, and Atopobium vaginae over time between study participants with incident bacterial vaginosis (iBV; cases) and study participants who maintained normal vaginal flora (healthy women). 16S ribosomal RNA gene sequencing was performed on stored vaginal specimens obtained from cases for 21 days leading up to iBV (and aligned menstrual cycle days for healthy women) and every other day for 1 week thereafter. To perform this analysis, the sequencing data were organized so that the first day of iBV was labeled as day 0 and aligned between cases. The x-axis on each figure represents time, while the y-axis represents the average difference in relative abundance of each microorganism between cases and healthy women. A, Mean relative abundances of L. crispatus, G. vaginalis, P. bivia, and A. vaginae over time among cases (red line, with 95% confidence intervals [CIs] shaded in red) and healthy women (purple line with 95% CIs shaded in purple) are displayed as smooth curves, using the loess smoothing technique. B, Difference in mean relative abundances of these microorganisms between cases and healthy women over time is represented by a blue smooth curve, again using the loess smoothing technique (with 95% CIs shaded in gray). The horizontal red line indicates no difference in the mean relative abundance of the microorganism between cases and healthy women. Days with a statistically significant difference in the mean relative abundance of the microorganism between cases and healthy women are denoted by asterisks. Scales may differ among y-axes. Standardizing these scales would make a subset of the figures difficult to read.
Figures 3.
Figures 3.
Variation in trends of mean relative abundance of Lactobacillus crispatus, Gardnerella vaginalis, Prevotella bivia, and Atopobium vaginae over time between study participants with incident bacterial vaginosis (iBV; cases) and study participants who maintained normal vaginal flora (healthy women). 16S ribosomal RNA gene sequencing was performed on stored vaginal specimens obtained from cases for 21 days leading up to iBV (and aligned menstrual cycle days for healthy women) and every other day for 1 week thereafter. To perform this analysis, the sequencing data were organized so that the first day of iBV was labeled as day 0 and aligned between cases. The x-axis on each figure represents time, while the y-axis represents the average difference in relative abundance of each microorganism between cases and healthy women. A, Mean relative abundances of L. crispatus, G. vaginalis, P. bivia, and A. vaginae over time among cases (red line, with 95% confidence intervals [CIs] shaded in red) and healthy women (purple line with 95% CIs shaded in purple) are displayed as smooth curves, using the loess smoothing technique. B, Difference in mean relative abundances of these microorganisms between cases and healthy women over time is represented by a blue smooth curve, again using the loess smoothing technique (with 95% CIs shaded in gray). The horizontal red line indicates no difference in the mean relative abundance of the microorganism between cases and healthy women. Days with a statistically significant difference in the mean relative abundance of the microorganism between cases and healthy women are denoted by asterisks. Scales may differ among y-axes. Standardizing these scales would make a subset of the figures difficult to read.
Figures 4.
Figures 4.
Variation in trends of mean relative abundance of Megasphaera type I, Sneathia sanguinegens, Finegoldia magna, bacterial vaginosis (BV)–associated bacteria 1–3 (BVAB1–3), and Lactobacillus iners over time between study participants with incident bacterial vaginosis (iBV; cases) and study participants who maintained normal vaginal flora (healthy women). 16S ribosomal RNA gene sequencing was performed on stored vaginal specimens obtained from cases for 21 days leading up to iBV (and aligned menstrual cycle days for healthy women) and every other day for 1 week thereafter. To perform this analysis, the sequencing data were organized so that the first day of iBV was labeled as day 0 and aligned between cases. The x-axis on each figure represents time, while the y-axis represents the difference in mean relative abundance of each microorganism between cases and healthy women. A, Mean relative abundances of Megasphaera type I, S. sanguinegens, F. magna, BVAB1–3, and L. iners over time in cases (red line with 95% confidence intervals [CIs] shaded in red) and healthy women (purple line with 95% CIs shaded in purple) are displayed as smooth curves, using the loess smoothing technique. B, Differences in mean relative abundances of these microorganisms between cases and healthy women over time are represented by a blue smooth curve, again using the loess smoothing technique (with 95% CIs shaded in gray). The horizontal red line indicates no difference in the mean relative abundance of the microorganism between cases and healthy women. Days with a statistically significant difference in the mean relative abundance of the microorganism between cases and healthy women are denoted by asterisks. Scales may differ among y-axes. Standardizing these scales would make a subset of the figures difficult to read.
Figures 4.
Figures 4.
Variation in trends of mean relative abundance of Megasphaera type I, Sneathia sanguinegens, Finegoldia magna, bacterial vaginosis (BV)–associated bacteria 1–3 (BVAB1–3), and Lactobacillus iners over time between study participants with incident bacterial vaginosis (iBV; cases) and study participants who maintained normal vaginal flora (healthy women). 16S ribosomal RNA gene sequencing was performed on stored vaginal specimens obtained from cases for 21 days leading up to iBV (and aligned menstrual cycle days for healthy women) and every other day for 1 week thereafter. To perform this analysis, the sequencing data were organized so that the first day of iBV was labeled as day 0 and aligned between cases. The x-axis on each figure represents time, while the y-axis represents the difference in mean relative abundance of each microorganism between cases and healthy women. A, Mean relative abundances of Megasphaera type I, S. sanguinegens, F. magna, BVAB1–3, and L. iners over time in cases (red line with 95% confidence intervals [CIs] shaded in red) and healthy women (purple line with 95% CIs shaded in purple) are displayed as smooth curves, using the loess smoothing technique. B, Differences in mean relative abundances of these microorganisms between cases and healthy women over time are represented by a blue smooth curve, again using the loess smoothing technique (with 95% CIs shaded in gray). The horizontal red line indicates no difference in the mean relative abundance of the microorganism between cases and healthy women. Days with a statistically significant difference in the mean relative abundance of the microorganism between cases and healthy women are denoted by asterisks. Scales may differ among y-axes. Standardizing these scales would make a subset of the figures difficult to read.

References

    1. Allsworth JE, Peipert JF. Prevalence of bacterial vaginosis: 2001–2004 National Health and Nutrition Examination Survey data. Obstet Gynecol 2007;109:114–20. - PubMed
    1. Cohen CR, Lingappa JR, Baeten JM et al. . Bacterial vaginosis associated with increased risk of female-to-male HIV-1 transmission: a prospective cohort analysis among African couples. PLoS Med 2012; 9:e1001251. - PMC - PubMed
    1. Hillier SL, Nugent RP, Eschenbach DA et al. . Association between bacterial vaginosis and preterm delivery of a low-birth-weight infant. The Vaginal Infections and Prematurity Study Group. N Engl J Med 1995; 333:1737–42. - PubMed
    1. Eschenbach DA. Bacterial vaginosis and anaerobes in obstetric-gynecologic infection. Clin Infect Dis 1993; 16(Suppl 4):S282–7. - PubMed
    1. Muzny CA, Schwebke JR. Gardnerella vaginalis: Still a prime suspect in the pathogenesis of bacterial vaginosis. Curr Infect Dis Rep 2013; 15:130–5. - PubMed

Publication types