. 2018 Jun 20;46(11):5618-5633.
doi: 10.1093/nar/gky293.

Regional conformational flexibility couples substrate specificity and scissile phosphate diester selectivity in human flap endonuclease 1

Affiliations

Regional conformational flexibility couples substrate specificity and scissile phosphate diester selectivity in human flap endonuclease 1

Ian A Bennet et al. Nucleic Acids Res. .

Abstract

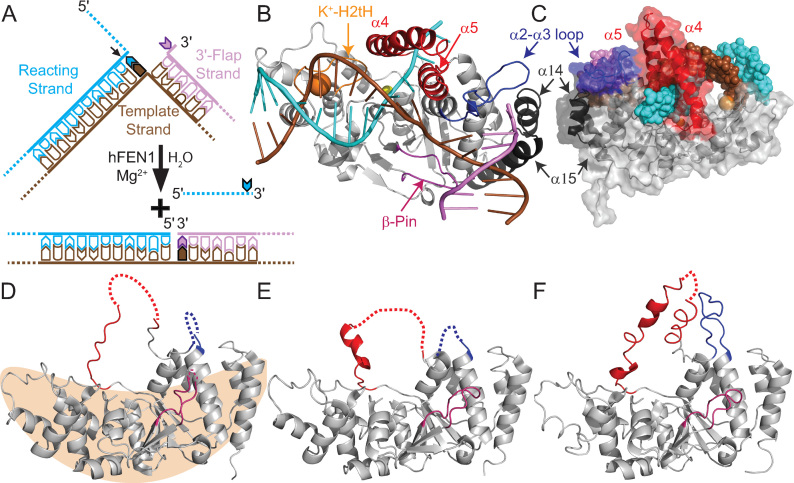
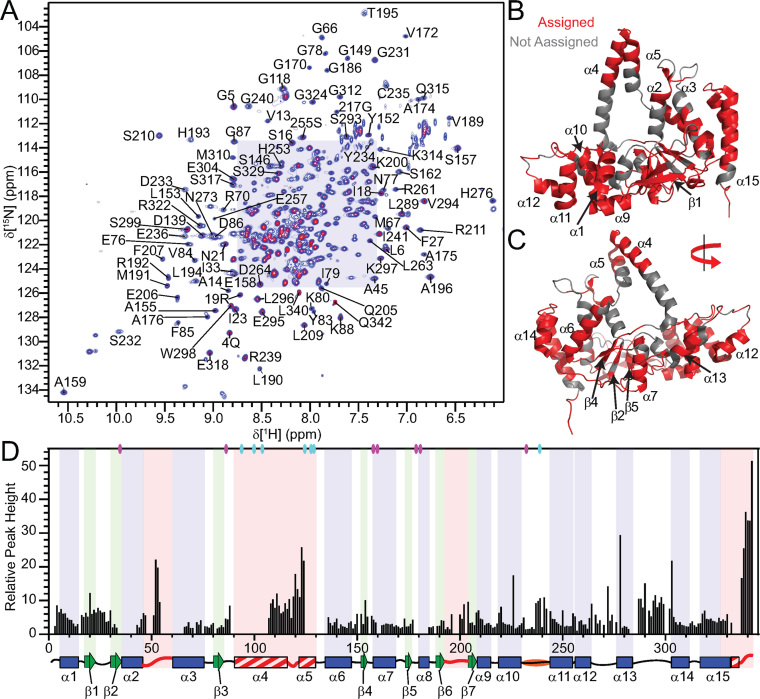
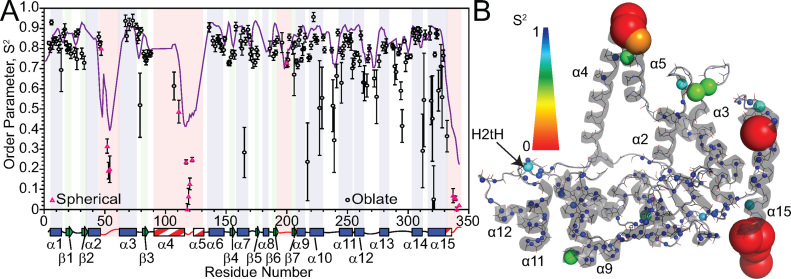
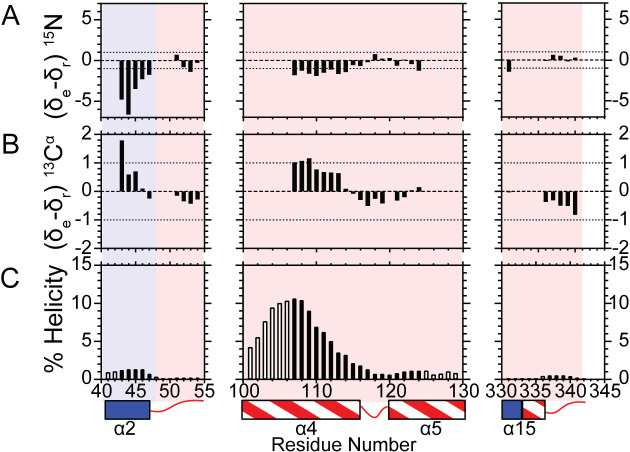
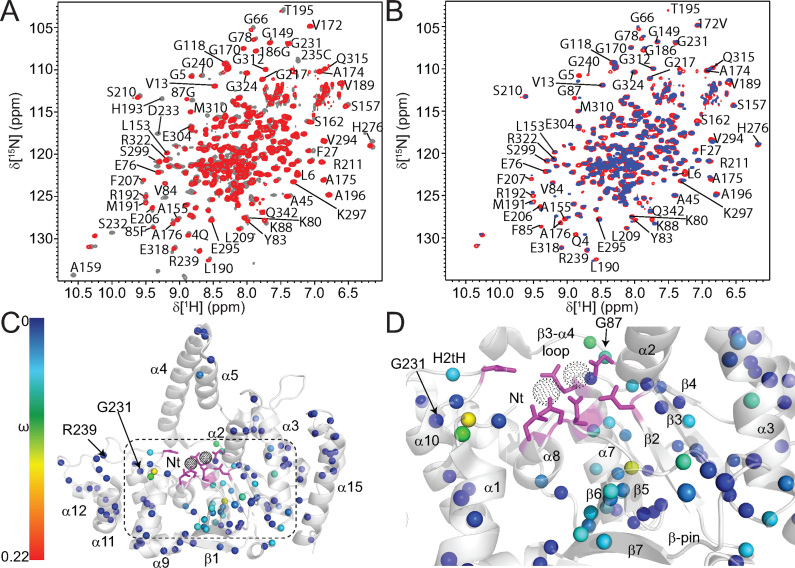
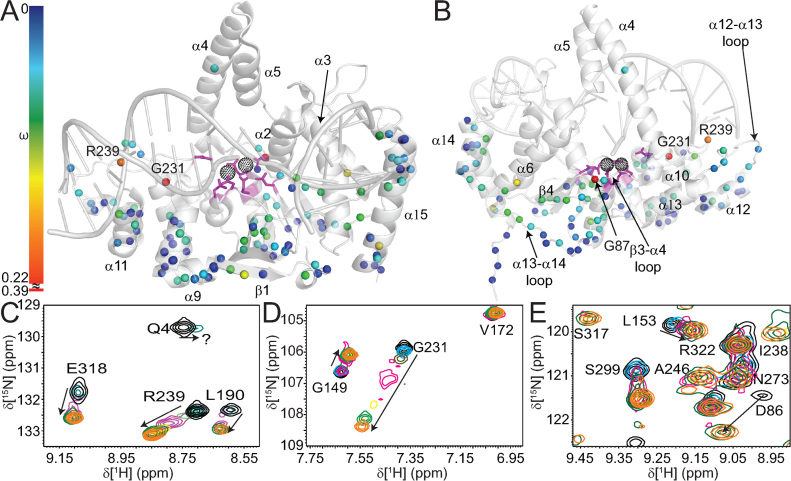
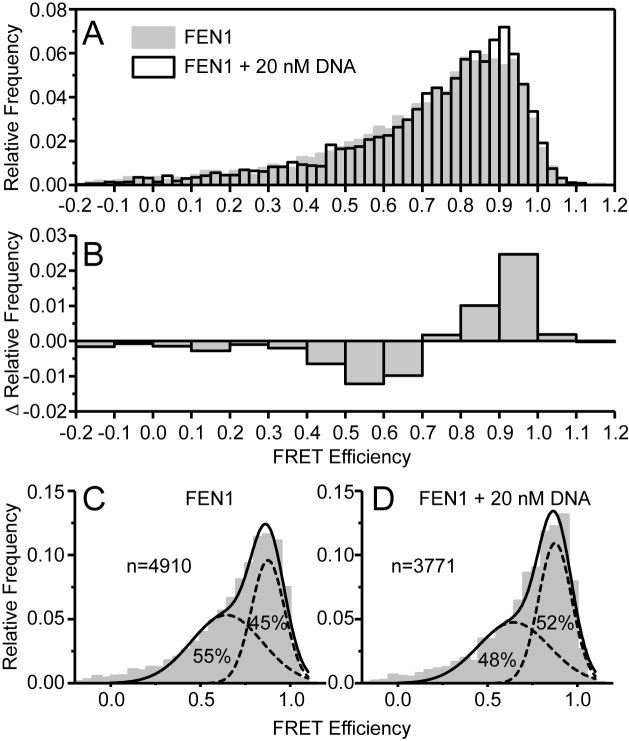
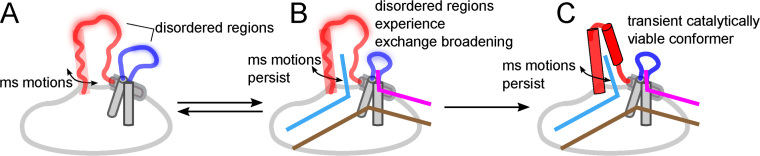
Human flap endonuclease-1 (hFEN1) catalyzes the divalent metal ion-dependent removal of single-stranded DNA protrusions known as flaps during DNA replication and repair. Substrate selectivity involves passage of the 5'-terminus/flap through the arch and recognition of a single nucleotide 3'-flap by the α2-α3 loop. Using NMR spectroscopy, we show that the solution conformation of free and DNA-bound hFEN1 are consistent with crystal structures; however, parts of the arch region and α2-α3 loop are disordered without substrate. Disorder within the arch explains how 5'-flaps can pass under it. NMR and single-molecule FRET data show a shift in the conformational ensemble in the arch and loop region upon addition of DNA. Furthermore, the addition of divalent metal ions to the active site of the hFEN1-DNA substrate complex demonstrates that active site changes are propagated via DNA-mediated allostery to regions key to substrate differentiation. The hFEN1-DNA complex also shows evidence of millisecond timescale motions in the arch region that may be required for DNA to enter the active site. Thus, hFEN1 regional conformational flexibility spanning a range of dynamic timescales is crucial to reach the catalytically relevant ensemble.


Figures

Figure 1.
Figure 1.
Regions of hFEN1 assume various conformations in crystal structures. (A) Representation of hFEN1-catalyzed reaction of double-flap DF#,1 creating ssDNA and nicked dsDNA products (2). # denotes a 5′-flap of any length, 1 denotes a single nucleotide 3′-flap. (B) The hFEN1D86N-(DF2,1) complex (5UM9) (21) shows that the arch (α4-α5, red), α2–α3 loop (blue) and β-pin (β6-β7 loop) (pink) are ordered in the presence of DNA substrate (colored as in panel A). The α10-α11 loop (H2tH motif) that binds the reacting duplex approximately 20 Å from the scissile phosphate and the α14-loop-α15 that is unique to FEN proteins are shown in orange and black, respectively. The potassium and active site samarium cations are shown as orange and yellow spheres, respectively. (C) Rear view of 5UM9 (cartoon with transparent surface representation) with regions colored as in panels A and B and the DNA (DF2,1) shown as spheres. (DF) The three crystal structures of apo-hFEN1 (1UL1) show the arch, α2–α3 loop and β-pin regions in various states of order and disorder, dashed lines indicate missing electron density (22). (D) The tan shape illustrates the saddle-region of hFEN1 that binds the dsDNA and active site metals.
Figure 2.
Figure 2.
Relative peak heights suggest differences in dynamics in regions of hFEN1. (A) 1H–15N-TROSY spectrum of hFEN1 under experimental conditions. Peaks from amide side chains and the two tryptophan side-chain indole groups (Hϵ–Nϵ) are also observed. Expanded views of the shaded region can be found in Supplementary Figure S4. (B) Front and (C) rear views of the hFEN1 structure (3Q8K) (11) with labeled secondary structure elements and colored backbone to denote assigned (red) or unassigned (gray) residues. (D) Relative peak height (based on the lowest intensity peak E257) obtained from the 1H–15N-TROSY spectrum of hFEN1 plotted versus residue number show that loops are generally more intense and are flanked by decreasing peak intensities and sometimes missing residues. A secondary structure schematic of hFEN1 (3Q8K) is included (11). Blue rectangles, green arrows and black lines indicate α-helices, β-strands and loops, respectively. Loops known to have structural heterogeneity (1UL1 versus 3Q8K) are indicated by red lines (11,22). Red and white stripped rectangles highlight regions of structural heterogeneity. The H2tH α10–α11 loop is highlighted in orange. The location of the active site carboxylate (D34, D86, E158, E160, D179, D181 and D233) and basic residues (K93, R100, R104, K125, K128, R129 and R238) with respect to secondary structure elements are indicated by magenta and cyan ovals, respectively.
Figure 3.
Figure 3.
Model-free analysis of hFEN1 relaxation data identifies regions with increased flexibility. (A) Generalized order parameters (S2) were derived from relax (52) using backbone 15N relaxation data acquired at two field strengths and plotted versus residue number. Black circles represent data fitted to the oblate spheroid diffusion tensor, whereas pink triangles were fitted to a spherical diffusion tensor. The purple line in (A) represents the TALOS-N (32) random coil index S2 prediction. Secondary structure map as described in Figure 2D. (B) S2 values plotted on a cartoon depiction of the hFEN1 protein structure (3Q8K) (11). The spheres represent the nitrogen nuclei for which data were derived. The S2 and Rex spectrum bars illustrate the magnitude of S2 and Rex values with respect to sphere color and size.
Figure 4.
Figure 4.
15NH and 13Cα chemical shifts for the disordered arch region indicate that only some of the residues are sampling helical conformations. Bar graphs indicate the magnitude of the difference of experimental (δe) and sequence-corrected random coil chemical shifts (δr) for (A) 15NH and (B) 13Cα for the indicated regions. Differences less than one (dotted line) suggest disorder. The anti-correlated nature of 15NH and 13Cα is used to suggest which segments of the disordered region populate either helical or extended peptide backbone angles. Positive and negative 15NH and 13Cα chemical shift differences, respectively, imply extended backbone angles, whereas negative and positive 15NH and 13Cα chemical shift differences, respectively, suggest sampling α-helical backbone angles (53). (C) Agadir helical percentage predictions for the indicated residues assessed at 114 mM ionic strength, pH 7.5 and 25°C (NMR conditions) (54). Black bars indicate the residues for which NMR data is available to validate the prediction, whereas open bars indicate an absence of NMR assignments. A secondary structure map is illustrated below as described in Figure 2D.
Figure 5.
Figure 5.
Addition of Ca2+ ions to hFEN1K93A perturbs chemical shifts nearest the active site. (A) Superposed 1H–15N TROSY spectra of hFEN1 (gray) and hFEN1K93A (red) shows only minimal changes in localized regions close to the mutation site indicating no widespread effects on global structure. (B) Superposed 1H-15N TROSY spectra of hFEN1K93A in the absence (red) and presence (blue) of Ca2+. Well-dispersed residues are labeled accordingly. (C) Chemical shift changes observed on the addition of Ca2+ ions to hFEN1K93A are mapped onto a cartoon representation of the hFEN1 structure (3Q8K) (11). The black-dotted spheres indicate the locations of active site metal ions that are coordinated by the side chains of carboxylate residues shown as magenta sticks. Secondary structure elements, the H2tH motif and the N-terminus (Nt) are labeled. The locations of the G231 and R239 spheres are highlighted. The magnitudes of the nitrogen nuclei chemical shift perturbations (ω) are represented by sphere color according to the associated spectrum bar. The absence of a sphere either indicates the lack of assignment in the protein or the inability to follow chemical shift changes due to peak overlap. (D) Magnified view of the area indicated by the dashed box in panel C to highlight the location of residues most affected by the addition of Ca2+ ions to hFEN1K93A. Labels are as described in panel C except for the omission of R239 and addition of G87.
Figure 6.
Figure 6.
Addition of Ca2+ ions to the hFEN1K93A–DNA complex show chemical shift perturbations (ω) throughout the protein. (A) Front and (B) rear views of a cartoon depiction of the hFEN1–DNA structure (3Q8K) (11) with the magnitudes of nitrogen nuclei chemical shift perturbations (ω) on addition of Ca2+ represented by sphere color according to the associated spectrum bar. Note, because the chemical shift change for G231 was larger than for most other residues, the spectrum bar is discontinuous. (C−E) Highlighted regions from Supplementary Figure S8C showing several residues with significant chemical shift perturbations that occur upon titration with Ca2+ at 0 mM (black), 0.5 mM (cyan), 1 mM (olive), 2 mM (magenta), 4 mM (yellow), 6 mM (green) and 8 mM (orange). The panels show a large ω for (C) L190, R239 and E318, (D) G149 and G231 and (E) the appearance of S317 at higher Ca2+ concentrations. Intermediate exchange behavior is highlighted for (C) Q4 and (E) D86.
Figure 7.
Figure 7.
smFRET shows a change in conformational ensemble upon addition of DNA and reveals millisecond conformational dynamics occurring in the arch region. (A) Relative frequencies of FRET efficiencies for hFEN1QF alone (gray) and in complex with 20 nM DNA (white). (B) The difference in relative frequencies of FRET efficiencies upon addition of 20nM DNA. (C) hFEN1QF alone and (D) hFEN1QF with 20 nM DNA showing the unrestrained fit to the sum of two Gaussian functions (see Supplementary Table S4 for fitting parameters) to show that upon addition of DNA the lower FRET population decreases and the higher FRET population increases.
Figure 8.
Figure 8.
The flexible regions of hFEN1 respond to the appropriate structural features of the substrate, resulting in a shift to the catalytically viable ensemble. (A) In the absence of substrate, hFEN1 contains flexible regions in the ‘arch’ (red) and the α2–α3 loop (blue). The tops of these regions are disordered and display very fast motions (∼109 s−1), whereas the flanking regions are absent presumably due to intermediate exchange broadening. The observable regions of the arch and loop are likely in fast exchange because they experience little to no change in chemical environment from the millisecond timescale motion. (B) Upon binding DNA, the disordered regions experience exchange broadening, likely due to a change in chemical environment and/or change in rate of motions. However, the slow millisecond timescale movements persist in both the arch and the α2–α3 loop despite the change in the conformational ensemble. (C) Eventually, the catalytically viable ensemble forms possibly coupling motions within the arch, the α2–α3 loop and the DNA.

References

    1. Balakrishnan L., Bambara R.A.. Flap endonuclease 1. Annu. Rev. Biochem. 2013; 82:119–138. - PMC - PubMed
    1. Finger L.D., Atack J.M., Tsutakawa S., Classen S., Tainer J., Grasby J., Shen B.. MacNeill S. The Eukaryotic Replisome: A Guide to Protein Structure and Function. 2012; Dordrecht: Springer; 301–326.
    1. Grasby J.A., Finger L.D., Tsutakawa S.E., Atack J.M., Tainer J.A.. Unpairing and gating: sequence-independent substrate recognition by FEN superfamily nucleases. Trends Biochem. Sci. 2012; 37:74–84. - PMC - PubMed
    1. Zheng L., Jia J., Finger L.D., Guo Z., Zer C., Shen B.. Functional regulation of FEN1 nuclease and its link to cancer. Nucleic Acids Res. 2011; 39:781–794. - PMC - PubMed
    1. van Pel D.M., Barrett I.J., Shimizu Y., Sajesh B.V., Guppy B.J., Pfeifer T., McManus K.J., Hieter P.. An evolutionarily conserved synthetic lethal interaction network identifies FEN1 as a broad-spectrum target for anticancer therapeutic development. PLoS Genet. 2013; 9:e1003254. - PMC - PubMed

Publication types