. 2018 Jul 1;29(13):1571-1589.
doi: 10.1091/mbc.E18-04-0228. Epub 2018 May 2.

Matrix stiffness modulates infection of endothelial cells by Listeria monocytogenes via expression of cell surface vimentin

Affiliations

Matrix stiffness modulates infection of endothelial cells by Listeria monocytogenes via expression of cell surface vimentin

Effie E Bastounis et al. Mol Biol Cell. .

Abstract

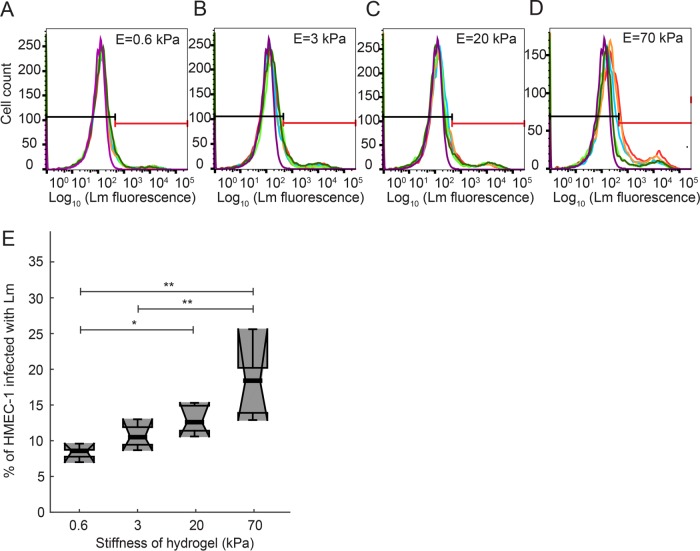
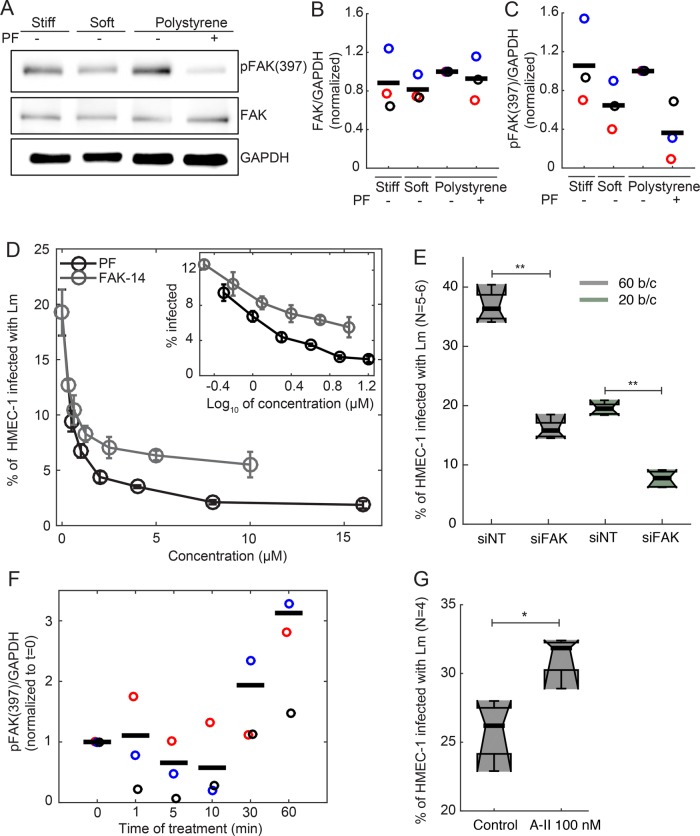
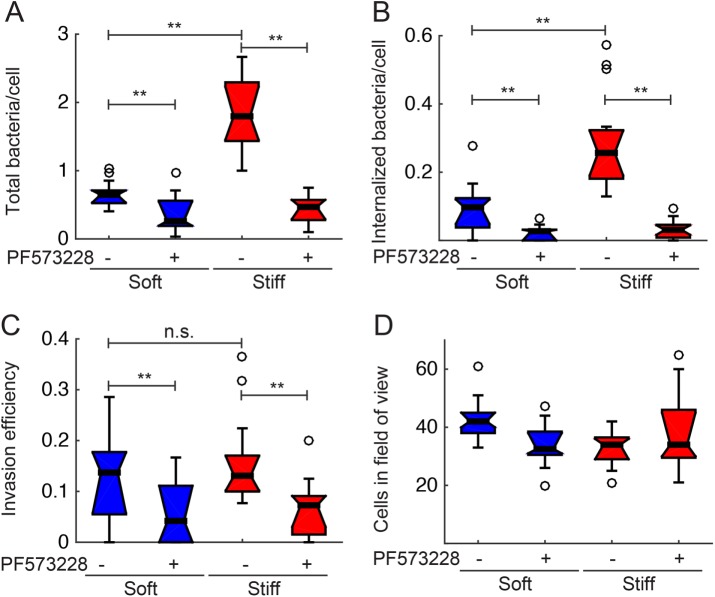
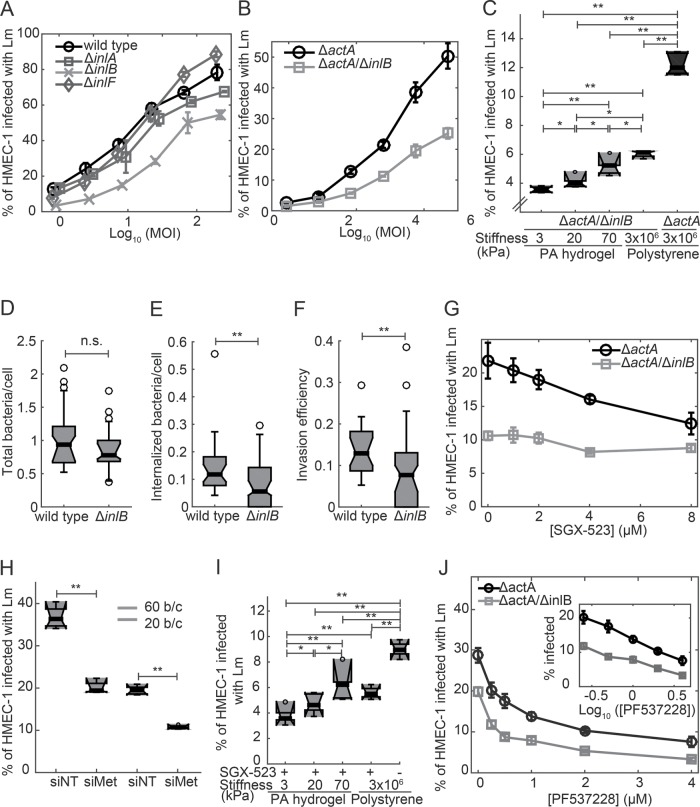
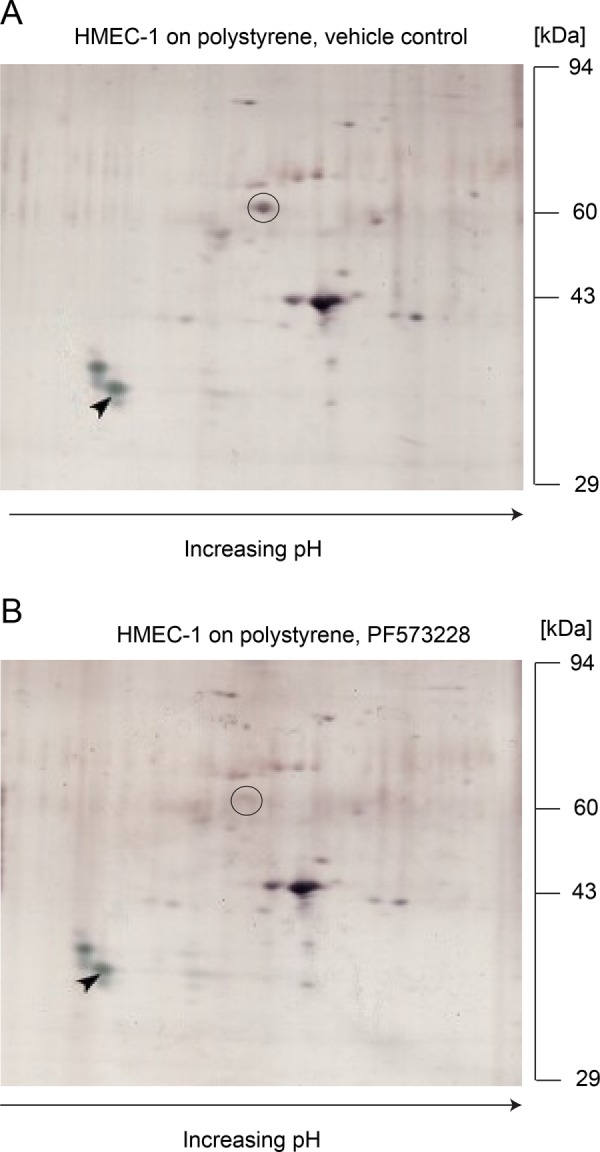
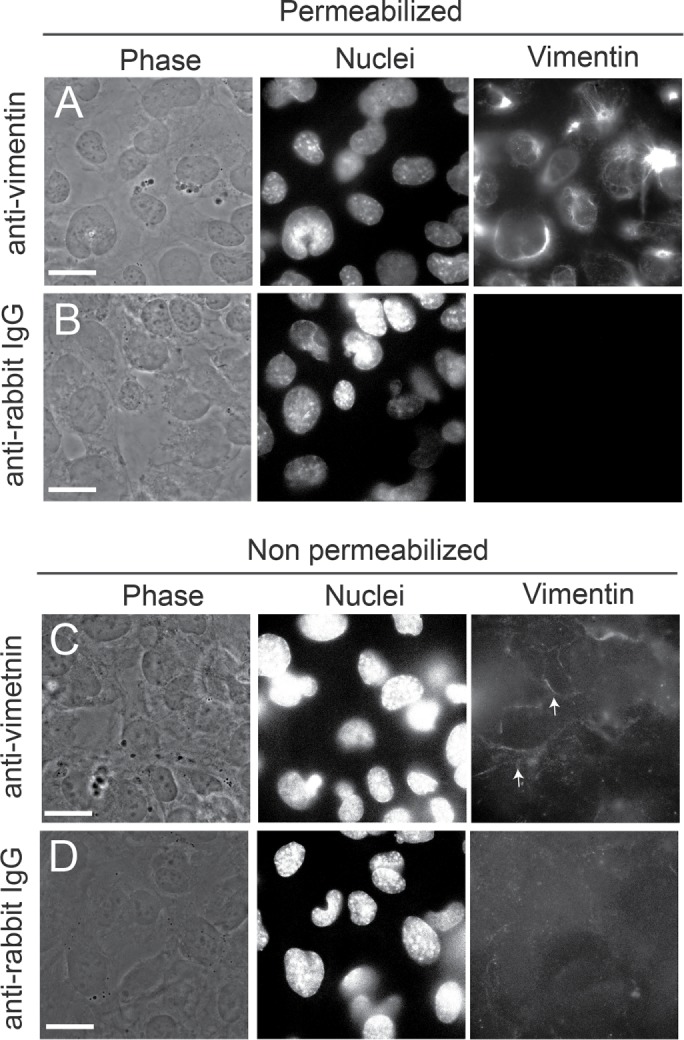
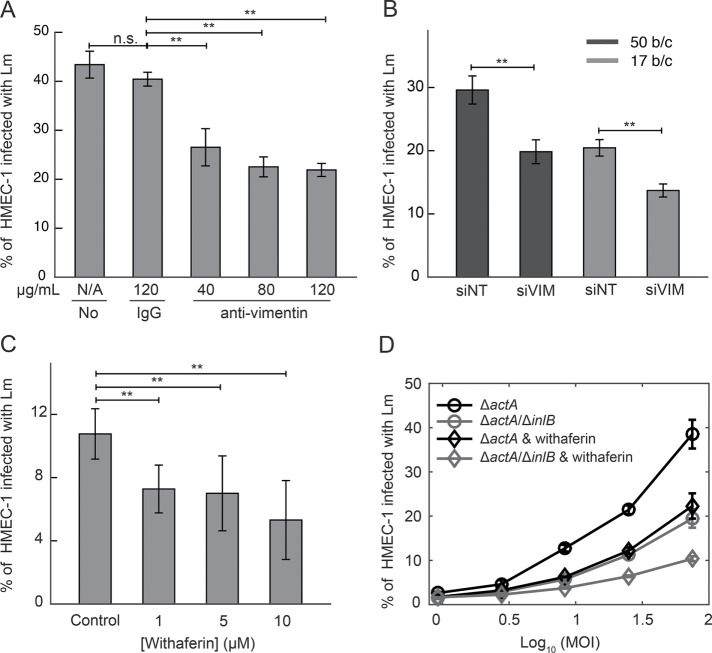
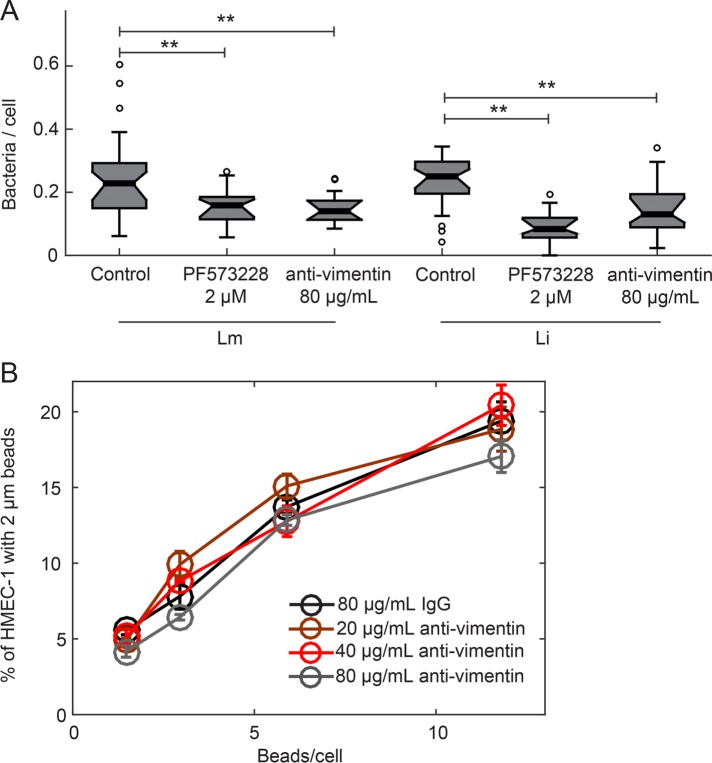
Extracellular matrix stiffness (ECM) is one of the many mechanical forces acting on mammalian adherent cells and an important determinant of cellular function. While the effect of ECM stiffness on many aspects of cellular behavior has been studied previously, how ECM stiffness might mediate susceptibility of host cells to infection by bacterial pathogens is hitherto unexplored. To address this open question, we manufactured hydrogels of varying physiologically relevant stiffness and seeded human microvascular endothelial cells (HMEC-1) on them. We then infected HMEC-1 with the bacterial pathogen Listeria monocytogenes (Lm) and found that adhesion of Lm to host cells increases monotonically with increasing matrix stiffness, an effect that requires the activity of focal adhesion kinase (FAK). We identified cell surface vimentin as a candidate surface receptor mediating stiffness-dependent adhesion of Lm to HMEC-1 and found that bacterial infection of these host cells is decreased when the amount of surface vimentin is reduced. Our results provide the first evidence that ECM stiffness can mediate the susceptibility of mammalian host cells to infection by a bacterial pathogen.


Figures

FIGURE 1:
FIGURE 1:
Uptake of Lm by HMEC-1 depends on the stiffness of the matrix on which cells reside. HMEC-1 residing on PA hydrogels of varying stiffness coated with collagen I were infected with ΔactA Lm (actAp::mTagRFP). Infection was analyzed by flow cytometry 7–8 h postinfection. Bacteria were added at a multiplicity of infection (MOI) between 30 and 50 bacteria per host cell. (A–D) Histograms of the logarithm of bacterial fluorescence intensity per cell for HMEC-1 plated on 0.6-kPa (A), 3-kPa (B), 20-kPa (C), and 70-kPa (D) PA hydrogels. Histograms for N = 5 replicates are shown in different colors. The histogram of control uninfected cells is shown in purple. Based on the autofluorescence of the control group, a gate is defined (see black and red lines) showing what is considered uninfected (left, black line) and infected (right, red line). (E) Boxplots of percentage of HMEC-1 infected with ΔactA Lm vs. hydrogel stiffness for the data shown in panels A–D. Circles represent outliers, and the boxplots’ notched sections show the 95% confidence interval around the median (Wilcoxon–Mann–Whitney test; for details about boxplots see Materials and Methods). One or two asterisks denote statistically significant differences between the medians of two distributions (<0.05 or <0.01, respectively; Wilcoxon rank-sum test).
FIGURE 2:
FIGURE 2:
FAK activity of HMEC-1 residing on soft PA hydrogels is decreased, as is Lm uptake. (A) Western blots from whole HMEC-1 lysates showing expression of phosphorylated FAK (Tyr397) and total FAK for cells residing on soft gels (3 kPa), stiff gels (70 kPa), and TC polystyrene substrates with or without 2 μM PF537228 FAK inhibitor. In each Western blot, equal quantities of protein were loaded and equal loading was confirmed in relation to glyceraldehyde 3-phosphate dehydrogenase (GAPDH) expression. In each case, the Western blots shown are representative of three independent experiments. (B, C) Normalized ratios of FAK/GAPDH (B) and pFAK (Tyr397)/GAPDH (C) for HMEC-1 residing on varying-stiffness substrates and treated or not with 2 μM PF537228 FAK inhibitor. Different color circles correspond to data from three independent experiments. Black bars represent the means of the three independent experiments. For each experiment, values have been normalized relative to the ratio for cells residing on polystyrene substrates. (D) Inhibition of bacterial uptake by FAK inhibitors. FAK-14, PF573228, or vehicle control was added 1 h before addition of bacteria to HMEC-1 residing on polystyrene substrates. Percentage of HMEC-1 infected with ΔactA Lm (actAp::mTagRFP) as a function of inhibitor concentration (mean ± SD, N = 4 replicates). x = 0 corresponds to cells treated with vehicle control. Inset shows the same data with concentration on a log scale. Infection was analyzed by flow cytometry, 7–8 h after infection. MOI is 80. Representative data come from one of three independent experiments. (E) Boxplots of percentage of HMEC-1 infected with ΔactA Lm (actAp::mTagRFP) for cells treated either with nontargeting siRNA (siNT) or FAK siRNA (siFAK) (means ± SD, three independent experiments and N = 6 replicates per experiment). MOI is 60 (gray) or 20 (green). Circles represent outliers, and the boxplots’ notched sections show the 95% confidence interval around the median (Wilcoxon–Mann–Whitney test; for details about boxplots see Materials and Methods). One or two asterisks denote statistically significant differences between the medians of two distributions (<0.05 or <0.01, respectively; Wilcoxon rank-sum test). (F) Normalized ratio of pFAK (Tyr397)/GAPDH for HMEC-1 residing on polystyrene substrates and treated for various amounts of time (min) with 100 nM Angiotensin-II. Different-colored circles correspond to Western blot data from three independent experiments. In each Western blot, equal quantities of protein were loaded and equal loading was confirmed in relation to glyceraldehyde 3-phosphate dehydrogenase (GAPDH) expression. Black bars represent the means of the three independent experiments. For each experiment, values have been normalized relative to the ratio for untreated cells (t = 0 min). (G) Boxplots of percentage of HMEC-1 infected with ΔactA Lm (actAp::mTagRFP) for cells pretreated for 2 h either with vehicle control or 100 nM angiotensin-II (means ± SD, three independent experiments and N = 4 replicates per experiment). One or two asterisks denote statistically significant differences between the medians of two distributions (<0.05 or <0.01, respectively; Wilcoxon rank-sum test).
FIGURE 3:
FIGURE 3:
Lm adhesion, but not invasion efficiency, is increased when HMEC-1 reside on stiff hydrogels. HMEC-1 residing on soft (3-kPa) or stiff (70-kPa) PA hydrogels and treated with vehicle control or 2 μM PF537228 FAK inhibitor were infected with Lm (constitutively expressing GFP) at an MOI between 1.5 and 15. At 30 min postinfection, samples were fixed and immunostained, and infection was analyzed by microscopy followed by image processing. Boxplots show (A) total bacteria per cell; (B) internalized bacteria per cell; (C) invasion efficiency (ratio of internalized bacteria to total bacteria); (D) cells in the field of view. Representative data come from one of three independent experiments. N = 800–1000 cells were analyzed for each condition. Two asterisks denote statistically significant differences between the medians of two distributions (<0.01; Wilcoxon rank-sum test).
FIGURE 4:
FIGURE 4:
Infection of HMEC-1 by Lm is in part mediated by InlB in a manner independent of matrix stiffness. (A) Percentage of HMEC-1 infected with Lm as a function of the logarithm of MOI (mean ± SD, N = 4 replicates). HMEC-1 were infected with the indicated strains: wild type (circle); ΔinlA (square); ΔinlB (cross); ΔinlF (diamond; actAp::mTagRFP). The frequency of infected HMEC-1 was determined by flow cytometry 7–8 h postinfection. Representative data come from one of three independent experiments. (B) Percentage of HMEC-1 infected with Lm as a function of the logarithm of MOI (mean ± SD, N = 4 replicates). HMEC-1 were infected with the indicated strains: ΔactA (black circles); ΔactA/ΔinlB (gray squares; actAp::mTagRFP). The frequency of infected HMEC-1 was determined by flow cytometry 7–8 h postinfection. Representative data come from one of three independent experiments. (C) Boxplots of percentage of HMEC-1 infected with Lm as a function of substrate stiffness (N = 5–6 replicates). HMEC-1 were infected with the indicated Lm strains: ΔactA (gray); ΔactA/ΔinlB (black; actAp::mTagRFP) at an MOI of 20. Infection was analyzed by flow cytometry 7–8 h after infection. Representative data come from one of three independent experiments. One or two asterisks denote statistically significant differences between the medians of two distributions (<0.05 or <0.01, respectively; Wilcoxon rank-sum test). (D–F) HMEC-1 residing on collagen I–coated glass substrates were infected with Lm (constitutively expressing GFP) or ΔinlB Lm at an MOI of 3.5. At 30 min postinfection, samples were fixed and, immunostained and infection was analyzed by microscopy followed by image processing. Boxplots show (D) total bacteria per cell; (E) internalized bacteria per cell; (F) invasion efficiency (ratio of internalized bacteria to total bacteria). For each condition, 500–550 cells were analyzed in total. (G) Percentage of HMEC-1 infected with Lm as a function of SGX-523 Met inhibitor concentration (mean ± SD, N = 4 replicates). SGX-523 or vehicle control was added 1 h before addition of bacteria. HMEC-1 were infected with the indicated strains: ΔactA (black circles); ΔactA/ΔinlB (gray squares; actAp::mTagRFP) at an MOI of 75. Infection was analyzed by flow cytometry 7–8 h after infection. Representative data come from one of three independent experiments. (H) Boxplots of percentage of HMEC-1 infected with ΔactA Lm (actAp::mTagRFP) for cells treated either with nontargeting siRNA (siNT) or with Met siRNA (siFAK; means ± -SD, three independent experiments and N = 6 replicates per experiment). MOI is 60 (gray) or 20 (green). Circles represent outliers, and the boxplots’ notched sections show the 95% confidence intervals around the medians (Wilcoxon–Mann–Whitney test; for details about boxplots see Materials and Methods). One or two asterisks denote statistically significant differences between the medians of two distributions (<0.05 or <0.01, respectively; Wilcoxon rank-sum test). (I) Boxplots of percentage of HMEC-1 infected with Lm as a function of substrate stiffness (N = 5–6 replicates). HMEC-1 were treated with vehicle control or 1 μM SGX-523 Met inhibitor for 1 h prior to infection and then infected with ΔactA Lm (actAp::mTagRFP). Infection was analyzed by flow cytometry 7–8 h after infection. MOI is 20. Representative data come from one of three independent experiments. (J) Percentage of HMEC-1 infected with Lm as a function of PF537228 inhibitor concentration (mean ± SD, N = 4 replicates). PF537228 or vehicle control was added 1 h before addition of bacteria (see Supplemental Figure S1D). HMEC-1 were infected with the indicated strains: ΔactA (black circles); ΔactA/ΔinlB (gray squares; actAp::mTagRFP) at an MOI of 75. Infection was analyzed by flow cytometry 7–8 h after infection. Representative data come from one of three independent experiments. Inset shows the same data with concentration on a log scale.
FIGURE 5:
FIGURE 5:
Lower FAK activity leads to reduced amount of cell surface vimentin. (A, B) 2D-PAGE gels of plasma membrane proteins of HMEC-1 grown on TC polystyrene substrates treated for 1 h with vehicle control (A) or 2 µM PF537228 FAK inhibitor (B). pH increases from left to right. Gels were silver-stained and one isoelectric point marker (tropomyosin), added to each sample as an internal standard, is marked with a black arrow. The one spot that differed consistently between three independent experiments is indicated with a black circle and corresponds to vimentin (55 kDa).
FIGURE 6:
FIGURE 6:
Surface vimentin is localized along the periphery of HMEC-1. (A–D) Cells were stained for vimentin using the rabbit anti-vimentin H-84 antibody. For negative controls, cells were stained with secondary anti-rabbit IgG antibody alone. Representative phase image of cells (left column), image of the nuclei (middle column), and H-84 anti-vimentin antibody fluorescence (right column) are shown for (A) permeabilized HMEC-1 strained for intracellular vimentin; (B) permeabilized HMEC-1 incubated with anti-rabbit IgG alone as negative controls; (C) nonpermeabilized HMEC-1 stained for surface vimentin; (D) nonpermeabilized HMEC-1 incubated with anti-rabbit IgG alone as negative controls. Scale bar shown in white is 20 μm. White arrows point at the localization of surface vimentin at cell–cell junctions.
FIGURE 7:
FIGURE 7:
Surface vimentin of HMEC-1 is implicated in Lm uptake. (A) Decrease in bacterial uptake after blocking HMEC-1 with anti-vimentin antibody H-84. Barplots of percentage of HMEC-1 infected with ΔactA Lm (actAp::mTagRFP) as a function of antibody concentration (means ± SD and N = 6 replicates per experiment). Representative data come from one of three independent experiments. Infection was analyzed by flow cytometry, 7–8 h after infection. (B) Barplots of percentage of HMEC-1 infected with ΔactA Lm (actAp::mTagRFP) for cells treated either with nontargeting siRNA (siNT) or with vimentin siRNA (siVIM) (means ± SD, and N = 6 replicates per experiment). Representative data come from one of three independent experiments. MOI is 50 (black barplots) and 17 (gray barplots). (C) Decreased uptake of Lm when HMEC-1 are treated with withaferin that captures soluble vimentin 30 min prior to infection. Barplots of percentage of HMEC-1 infected with ΔactA Lm (actAp::mTagRFP) as a function of withaferin concentration (means ± SD and N = 6 replicates per experiment). Representative data come from one of three independent experiments. Infection was analyzed by flow cytometry 7–8 h after infection. (D) Percentage of HMEC-1 infected with Lm as a function of the logarithm of MOI (mean ± SD, N = 4 replicates). HMEC-1 were infected with the indicated strains: ΔactA (black), ΔactA/ΔinlB (gray; actAp::mTagRFP), and HMEC-1 were treated with vehicle control (circle) or withaferin (diamond) for 30 min prior to infection. The frequency of infected HMEC-1 was determined by flow cytometry 7–8 h postinfection. Representative data come from one of three independent experiments. MOI ranged from 50 to120. Two asterisks denote statistically significant differences between the medians of infection fraction of control vs. all other groups (p < 0.01; Wilcoxon rank-sum test).
FIGURE 8:
FIGURE 8:
Blocking HMEC-1 with anti-vimentin antibody reduces Li adhesion onto HMEC-1 but not uptake of beads. (A) Boxplots showing the number of bacteria per cell, for HMEC-1 residing on glass substrates and treated with vehicle control, 2 μM PF537228 FAK inhibitor, or 80 μg/ml H-84 anti-vimentin antibody prior to infection. Cells were infected with Lm or Li at an MOI of 4. At 30 min postinfection, samples were fixed and immunostained and adhesion of bacteria was analyzed by microscopy followed by image processing. For each condition, 2300–2600 cells were analyzed in total and data refer to one of two independent experiments. Two asterisks denote statistically significant differences between the median values of control cells vs. all other groups (<0.01; Wilcoxon rank-sum test). (B) HMEC-1 residing on TC polystyrene substrates and blocked for 1 h with various concentrations of H-84 anti-vimentin antibody or isotype control were “infected” with 2 μm beads at different concentrations. The frequency of microbead uptake by HMEC-1 was determined by flow cytometry 2 h post–addition of beads. Plot shows percentage of cells that internalized beads as a function of the beads/cell added for different H-84 antibody concentrations (mean ± SD, N = 4 replicates).

References

    1. Acerbi I, Cassereau L, Dean I, Shi Q, Au A, Park C, Chen YY, Liphardt J, Hwang ES, Weaver VM. (2015). Human breast cancer invasion and aggression correlates with ECM stiffening and immune cell infiltration. Integr Biol (Camb) , 1120–1134. - PMC - PubMed
    1. Ahmed EM. (2015). Hydrogel: preparation, characterization, and applications: a review. J Adv Res , 105–121. - PMC - PubMed
    1. Aird WC. (2007). Phenotypic heterogeneity of the endothelium: I. Structure, function, and mechanisms. Circ Res , 158–173. - PubMed
    1. Aird WC. (2012). Endothelial cell heterogeneity. Cold Spring Harb Perspect Med , a006429. - PMC - PubMed
    1. Bargagna-Mohan P, Deokule SP, Thompson K, Wizeman J, Srinivasan C, Vooturi S, Kompella UB, Mohan R. (2013). Withaferin A effectively targets soluble vimentin in the glaucoma filtration surgical model of fibrosis. PLoS One , e63881. - PMC - PubMed

Publication types

MeSH terms

Substances

LinkOut - more resources