. 2018 Jul-Sep;8(3):2045894018778155.
doi: 10.1177/2045894018778155. Epub 2018 May 2.

Rare variants in RNF213, a susceptibility gene for moyamoya disease, are found in patients with pulmonary hypertension and aggravate hypoxia-induced pulmonary hypertension in mice

Affiliations

Rare variants in RNF213, a susceptibility gene for moyamoya disease, are found in patients with pulmonary hypertension and aggravate hypoxia-induced pulmonary hypertension in mice

Hatasu Kobayashi et al. Pulm Circ. 2018 Jul-Sep.

Abstract

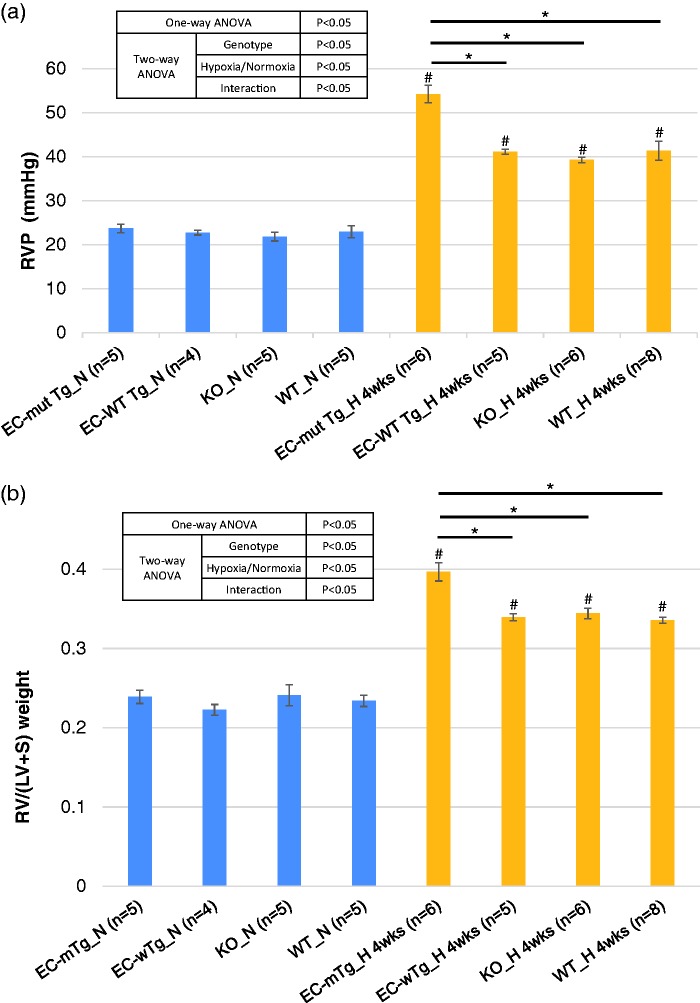
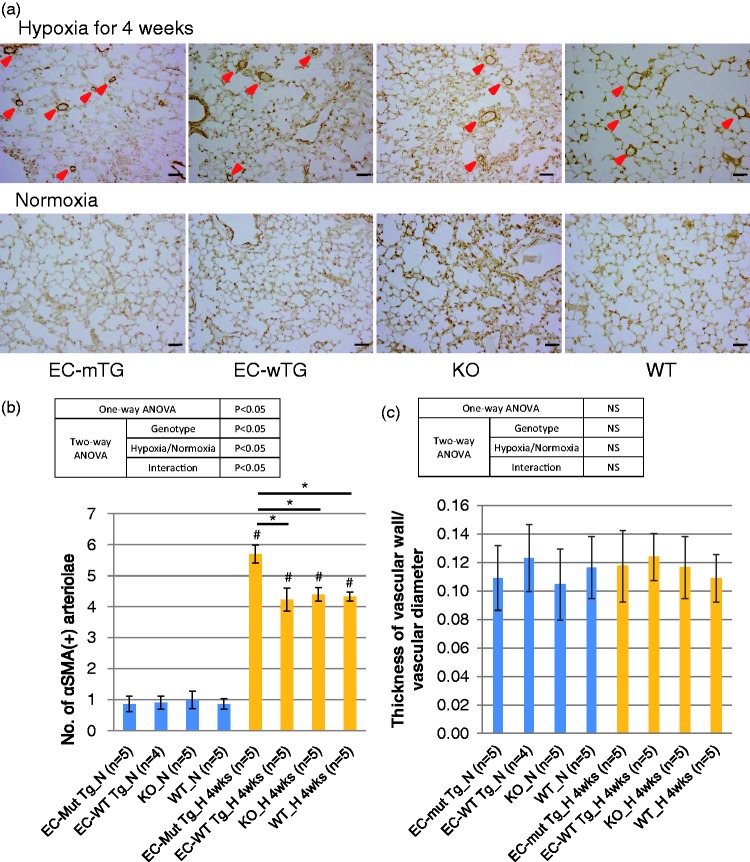
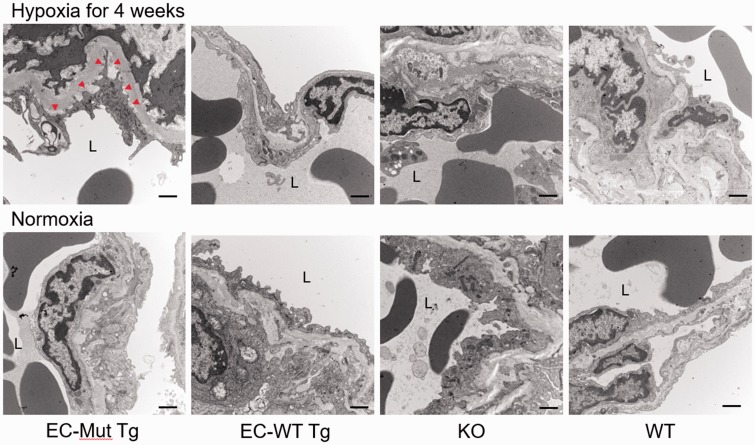
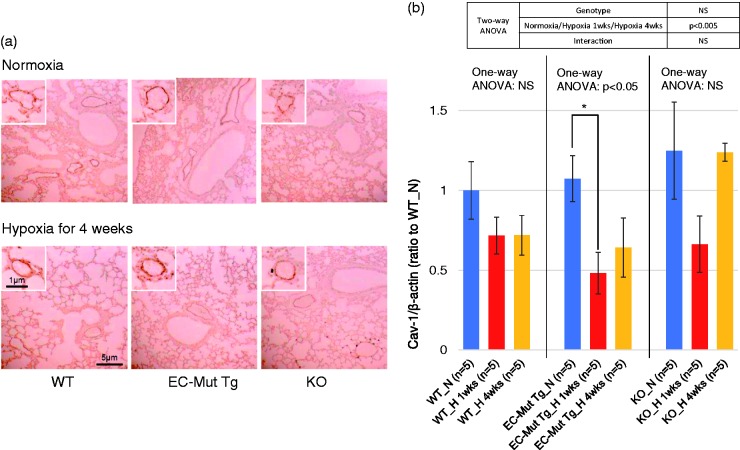
Ring finger 213 ( RNF213) is a susceptibility gene for moyamoya disease (MMD), a progressive cerebrovascular disease. Recent studies suggest that RNF213 plays an important role not only in MMD, but also in extracranial vascular diseases, such as pulmonary hypertension (PH). In this study, we undertook genetic screening of RNF213 in patients with PH and performed functional analysis of an RNF213 variant using mouse models. Direct sequencing of the exons in the C-terminal region of RNF213, where MMD-associated mutations are highly clustered, and of the entire coding exons of BMPR2 and CAV1, the causative genes for PH, was performed in 27 Japanese patients with PH. Two MMD-associated rare variants (p.R4810K and p.A4399T) in RNF213 were identified in two patients, three BMPR2 mutations (p.Q92H, p.L198Rfs*4, and p.S930X) were found in three patients, whereas no CAV1 mutations were identified. To test the effect of the RNF213 variants on PH, vascular endothelial cell (EC)-specific Rnf213 mutant transgenic mice were exposed to hypoxia. Overexpression of the EC-specific Rnf213 mutant, but neither Rnf213 ablation nor EC-specific wild-type Rnf213 overexpression, aggravated the hypoxia-induced PH phenotype (high right ventricular pressure, right ventricular hypertrophy, and muscularization of pulmonary vessels). Under hypoxia, electron microscopy showed unique EC detachment in pulmonary vessels, and western blots demonstrated a significant reduction in caveolin-1 (encoded by CAV1), a key molecule involved in EC functions, in lungs of EC-specific Rnf213 mutant transgenic mice, suggestive of EC dysfunction. RNF213 appears to be a genetic risk factor for PH and could play a role in systemic vasculopathy.

Keywords: animal models; caveolin-1; endothelium; epigenetics; genetics; genomics.


Figures

Fig. 1.
Fig. 1.
CT scan data of PH patients with RNF213 and BMPR2 variants. (a) Axial CT scan with lung windows in a 45-year-old IPAH patient with RNF213 p.R4810K. Neovascularity, shown as tiny and serpiginous intrapulmonary vessels, can be seen in the periphery of the lungs and GGO is observed within the lungs. (b) Axial CT scan with lung windows in an IPAH patient with BMPR2 p.L198Rfs*4. Neovascularity, shown as tiny and serpiginous intrapulmonary vessels, can also be seen in the periphery of the lungs and GGO appears within the lungs.
Fig. 2.
Fig. 2.
Physiological PH phenotypes of EC-Mut Tg, EC-WT Tg, KO, and WT mice exposed to hypoxia. (a) RVP and (b) RV/(LV + S) of EC-Mut Tg, EC-WT Tg, KO, and WT mice under conditions of normoxia (N) and hypoxia for four weeks (H_4wks). Data with bars represent mean ± SEM. The number of experiments (n) is indicated in each figure. There were significant differences (P < 0.05) in the values of RVP and RV/(LV + S) among the eight groups (grouped by genotype and normoxia/hypoxia) using one-way ANOVA. *P < 0.05, by Tukey’s post-hoc test compared with EC-Mut Tg mice. #P < 0.05, by Tukey’s post-hoc test compared with normoxia.
Fig. 3.
Fig. 3.
Histopathological changes in pulmonary vessels in EC-Mut Tg, EC-WT Tg, KO, and WT mice exposed to hypoxia. (a) Representative images of αSMA-stained sections of the lungs of EC-Mut Tg, EC-WT Tg, KO, and WT mice under normoxia and hypoxia for four weeks. Red arrowheads indicate αSMA-positive (muscularized) vessels. Scale bars indicate 50 µm. (b, c) Quantified results of (b) the number and (c) thickness of αSMA-positive pulmonary vessels in EC-Mut Tg, EC-WT Tg, KO, and WT mice under conditions of normoxia (N) and hypoxia for four weeks (H_4wks). Data with bars represent mean ± SEM. The number of experiments (n) is indicated in each figure. There were significant differences (P < 0.05) in the number, but not in the thickness, of vessels among the eight groups (grouped by genotype and normoxia/hypoxia) using one-way ANOVA. *P < 0.05, by Tukey’s post-hoc test compared with EC-Mut Tg mice. #P < 0.05, by Tukey’s post-hoc test compared with normoxia. NS, not significant.
Fig. 4.
Fig. 4.
Electron microscopy of pulmonary vessels in EC-Mut Tg, EC-WT Tg, KO, and WT mice exposed to hypoxia. Representative electron micrographs of pulmonary vessels of EC-Mut Tg, EC-WT Tg, KO, and WT mice under normoxia or hypoxia for four weeks. Red arrowheads show areas of EC detachment from the basement membrane. “L” indicates the lumen of vessels. Scale bars indicate 2 µm.
Fig. 5.
Fig. 5.
Cav-1 expression in lungs of EC-Mut Tg, KO, and WT mice exposed to hypoxia. (a) Representative images o.f lung immunohistochemistry for Cav-1 in EC-Mut Tg, KO, and WT mice under normoxia or hypoxia for four weeks. Similar results were obtained from three independent experiments. The small boxes showCav-1 immunostaining in pulmonary vascular ECs. The scale bars represent the indicated dimensions. (b) Quantified data of western blotting for Cav-1 levels in lungs of EC-Mut Tg, KO, and WT mice under normoxia (N), hypoxia for one week (H 1wks) and hypoxia for four weeks (H 4wks). Western blot images are shown in Fig. S3. β-actin was used as internal control. The values are relative intensities normalized to WT mice under normoxia (WT_N). Data with bars represent mean ± SEM. The number of experiments (n) is indicated in the figure. There were no significant differences among WT_N, EC-Mut Tg_N and KO_N by one-way ANOVA (P > 0.05). One-way ANOVA comparing Cav-1 levels among normoxia, hypoxia for one week and hypoxia for four weeks in each genotype shows that there were significant differences (P < 0.05) in EC-Mut Tg mice, but not in WT and KO mice. *P < 0.05, by Tukey’s post-hoc test compared with normoxia. NS, not significant.

References

    1. Liu W, Morito D, Takashima S, et al. Identification of RNF213 as a susceptibility gene for moyamoya disease and its possible role in vascular development. PLoS One 2011; 6: e22542. - PMC - PubMed
    1. Kamada F, Aoki Y, Narisawa A, et al. A genome-wide association study identifies RNF213 as the first Moyamoya disease gene. J Hum Genet 2011; 56: 34–40. - PubMed
    1. Kudo T. Spontaneous occlusion of the circle of Willis. A disease apparently confined to Japanese. Neurology 1968; 18: 485–496. - PubMed
    1. Suzuki J, Takaku A. Cerebrovascular “moyamoya” disease. Disease showing abnormal net-like vessels in base of brain. Arch Neurol 1969; 20: 288–299. - PubMed
    1. Takeuchi K, Shimizu K. Hypoplasia of bilateral internal carotid arteries (in Japanese). Brain Nerve 1957; 9: 37–43.

LinkOut - more resources