Review
. 2018 Aug;7(16):e1800066.
doi: 10.1002/adhm.201800066. Epub 2018 May 2.

Real-Time Imaging of Brain Tumor for Image-Guided Surgery

Affiliations
Review

Real-Time Imaging of Brain Tumor for Image-Guided Surgery

Shuang Hu et al. Adv Healthc Mater. 2018 Aug.

Abstract

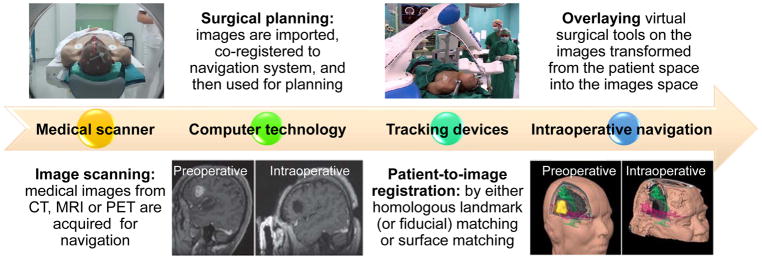
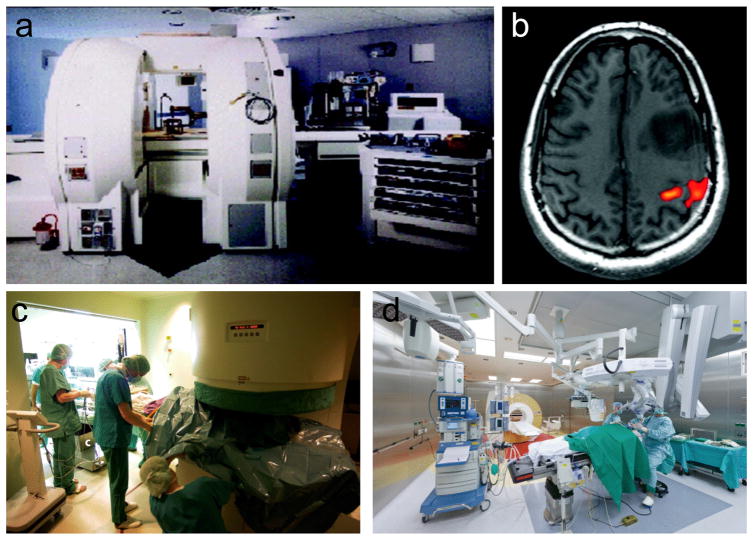
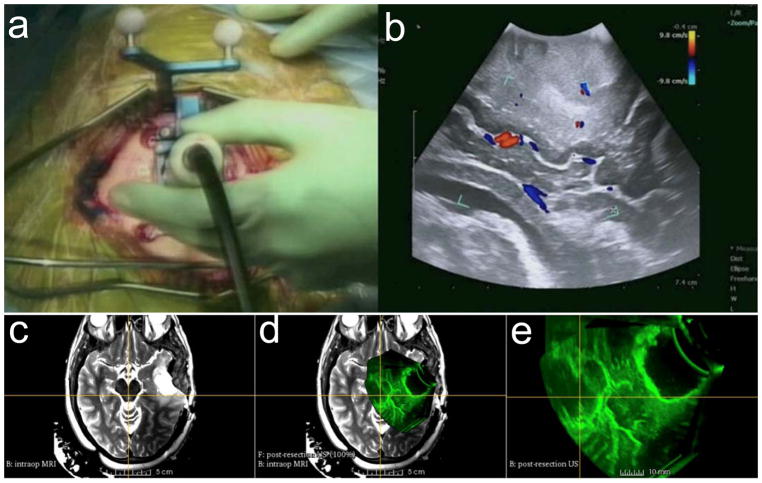
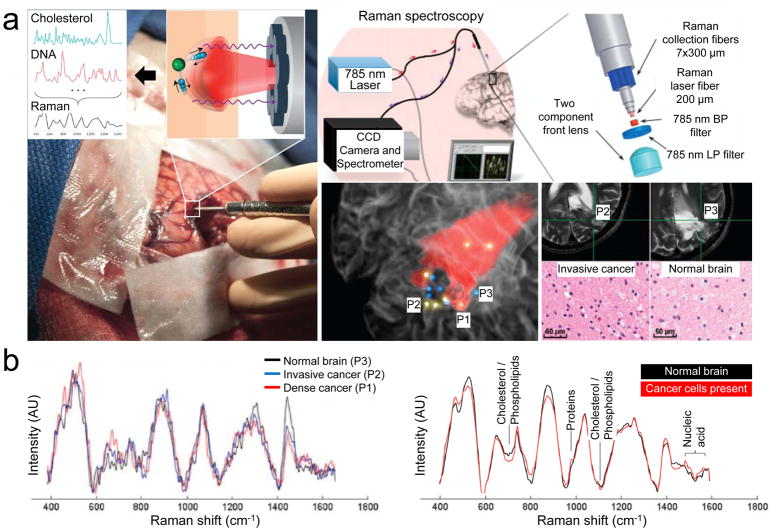
The completion of surgical resection is a key prognostic factor in brain tumor treatment. This requires surgeons to identify residual tumors in theater as well as to margin the proximity of the tumor to adjacent normal tissue. Subjective assessments, such as texture palpation or visual tissue differences, are commonly used by oncology surgeons during resection to differentiate cancer lesions from normal tissue, which can potentially result in either an incomplete tumor resection, or accidental removal of normal tissue. Moreover, malignant brain tumors are even more difficult to distinguish from normal brain tissue, and resecting noncancerous tissue may create neurological defects after surgery. To optimize the resection margin in brain tumors, a variety of intraoperative guidance techniques are developed, such as neuronavigation, magnetic resonance imaging, ultrasound, Raman spectroscopy, and optical fluorescence imaging. When combined with appropriate contrast agents, optical fluorescence imaging can provide the neurosurgeon real-time image guidance to improve resection completeness and to decrease surgical complications.

Keywords: brain tumors; contrast agents; image-guided therapy; intraoperative imaging; real-time imaging.


Conflict of interest statement

Conflict of Interest

The authors declare no conflict of interest.

Figures

Figure 1
Figure 1
Neuronavigation workflow. 1) Prescanning of patient for neuronavigation using medical imaging. 2) Surgical planning by importing the medical images into the neuronavigation system. 3) Registration of the image space with the patient space. 4) Overlaying virtual surgical tools on the images transformed from the patient space into the images space. Reproduced with permission.[18] Copyright 2017, John Wiley & Sons. Reproduced with permission.[19] Copyright 2013, Springer Nature.
Figure 2
Figure 2
Intraoperative MR-guided neurosurgery. a) 0.5 T Double coil design iMRI system. b) Activated brain area showing the motor cortex after finger tapping. Reproduced with permission.[24] Copyright 2008, John Wiley & Sons. c) Intraoperative installation of 0.2 T Siemens Magnetom Open. d) Brain tumor surgery in the integrated iMRI hybrid operating room. Reproduced with permission.[25] Copyright 2017, Springer Nature.
Figure 3
Figure 3
Intraoperative ultrasound. a) Intraoperative 2D color Doppler ultrasound during tumor resection. b) 2D ultrasound image with superimposed color Doppler imaging. c) Intraoperative T2-FLAIR MRI after initial tumor resection. d) Coregistered image of intraoperative 3D US and intraoperative T2-FLAIR MRI. e) Intraoperative 3D US after initial tumor resection at the advanced multimodality image guided operating (AMIGO) suite at Brigham and Women’s Hospital. Reproduced with permission.[31] Copyright 2017, John Wiley & Sons.
Figure 4
Figure 4
The handheld contact fiber optic probe for Raman spectroscopy during glioma surgery collocated on preoperative MRI. a) The spectral differences occur owing to the vibrational modes of various molecular species, including cholesterol and DNA. Regions associated with colored dots were interrogated by Raman spectroscopy and were histologically analyzed: yellow indicates the presence of cancer cells; blue for negative cancer cells. P1, P2, and P3 are dense cancer, invasive cancer, and normal brain tissue, respectively. b) Raman spectra acquired for P1–P3 (left) and for discrimination of cancer tissue (right). The corresponding molecular contributors are identified for the most significant differences between the spectra for normal and cancer tissues. CCD, charge coupled device; BP, band-pass; LP, long-pass; AU, arbitrary unit. Reproduced with permission.[33] Copyright 2015, American Association for the Advancement of Science.
Figure 5
Figure 5
Intraoperative optical fluorescence imaging. a) Schematic drawing and optical paths of the FLARE imaging platform. Color video (400–650 nm) and two independent channels (700/800 nm) of NIR fluorescence images are acquired simultaneously with custom software over a 15 cm diameter field of view. Reproduced with permission.[43] Copyright 2009, Springer Nature. b) NIR imaging of resected mouse brain (left, 700 nm) and pig brain (right, 800 nm). Imaged in color and NIR fluorescence under the FLARE imaging system. Red and lime green pseudocolors were used for 700 and 800 nm NIR in the merged image, respectively. Arrows = choroid plexus. Scale bars = 5 mm.
Figure 6
Figure 6
Major strategies for brain tumor targeting: 1) passive targeting, 2) active targeting, 3) activatable targeting. Reproduced with permission.[57] Copyright 2015, American Chemical Society.
Figure 7
Figure 7
Intraoperative brain tumor resection with the assistance of fluorophores. a) Regular white light. b) Blue light excitation (400 nm) using 5-ALA and PpIX. c) Green light excitation (500 nm) using fluorescein. d) NIR light excitation (800 nm) using ICG. Reproduced with permission.[64] Copyright 2017, Codon Publications.
Figure 8
Figure 8
Tumor-specific fluorescent agent. a) Folate is conjugated to fluorescein isothiocyanate (FITC). b) Schematic drawing of ovarian cancer targeting using folate–FITC. c) Color and fluorescence images of the abdominal cavity. d) Ex vivo quantitative scoring of tumor deposits. p < 0.001 by five independent surgeons. Reproduced with permission.[36] Copyright 2011, Springer Nature.
Figure 9
Figure 9
Glioblastoma imaging in the NIR-II window. a) Chemical structure of PEGylated NIR fluorophore, CH1055-PEG. b) Schematic drawing for the location of U87MG orthotopic glioblastoma. T2-color weighted MRI images in the c) sagittal and d) coronal planes showing the implanted U87MG brain tumors (red arrows). e) High-magnified NIR-II fluorescence image of mouse brain through the scalp and skull 6 h post-intravenous injection of CH1055-PEG. Reproduced with permission.[84] Copyright 2016, Springer Nature.
Figure 10
Figure 10
Brain tumor detection using trimodalities in living mice. a) Chemical structure of trimodal nanoparticles and experimental scheme. b) 2D axial MRI, photoacoustic and Raman images. c) 3D rendering of the segmented tumor with MRI (red; top), photoacoustic (green; middle), and their merged image (bottom). d) Quantitative analysis of tumor signals pre- and postinjection of trimodal nanoprobes (n = 4). **p < 0.01, ***p < 0.001 (one-sided Student’s t-test). AU, arbitrary units. Reproduced with permission.[115] Copyright 2012, Springer Nature.

References

    1. Giraudeau C, Geffroy F, Meriaux S, Boumezbeur F, Robert P, Port M, Robic C, Le Bihan D, Lethimonnier F, Valette J. Angiogenesis. 2013;16:171. - PubMed
    1. Wen PY, Kesari S. N Engl J Med. 2008;359:492. - PubMed
    1. Wakimoto H, Kesari S, Farrell CJ, Curry WT, Zaupa C, Aghi M, Kuroda T, Stemmer-Rachamimov A, Shah K, Liu TC, Jeyaretna DS, Debasitis J, Pruszak J, Martuza RL, Rabkin SD. Cancer Res. 2009;69:3472. - PMC - PubMed
    1. Ottenhausen M, Krieg SM, Meyer B, Ringel F. Neurosurg Focus. 2015;38:E3. - PubMed
    1. Petridis AK, Anokhin M, Vavruska J, Mahvash M, Scholz M. Clin Neurol Neurosurg. 2015;131:64. - PubMed

Publication types

Substances