. 2018 May 1;23(5):1387-1398.
doi: 10.1016/j.celrep.2018.04.009.

Role of Selenof as a Gatekeeper of Secreted Disulfide-Rich Glycoproteins

Affiliations

Role of Selenof as a Gatekeeper of Secreted Disulfide-Rich Glycoproteins

Sun Hee Yim et al. Cell Rep. .

Abstract

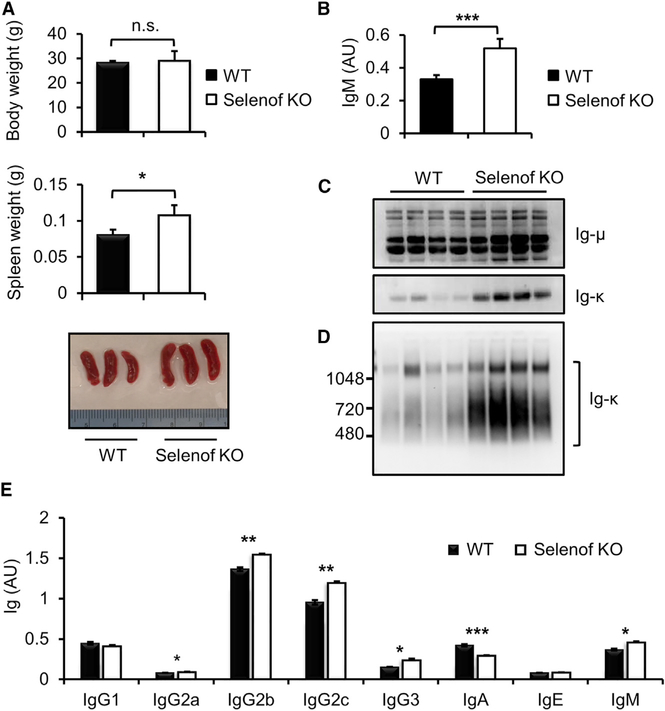
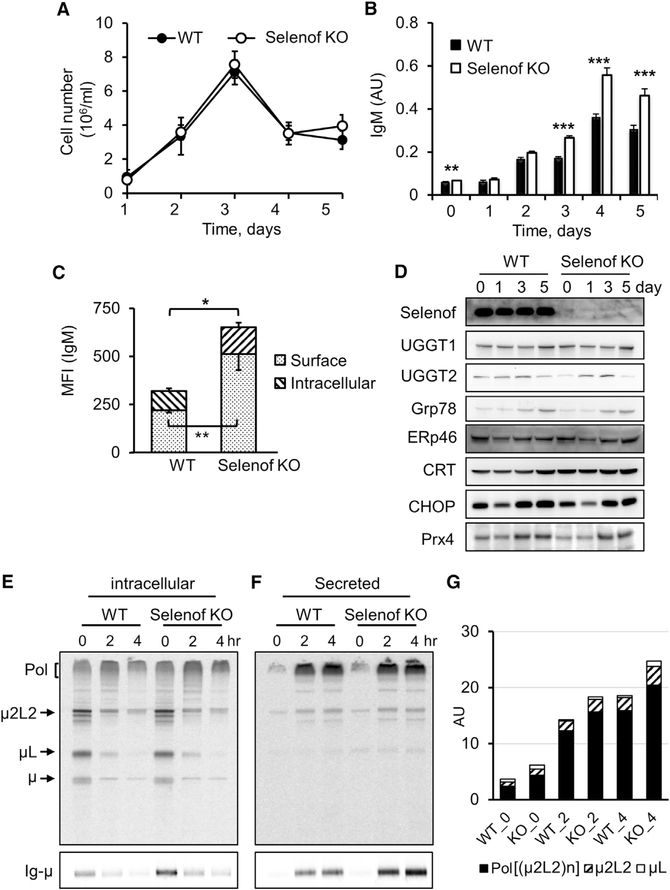
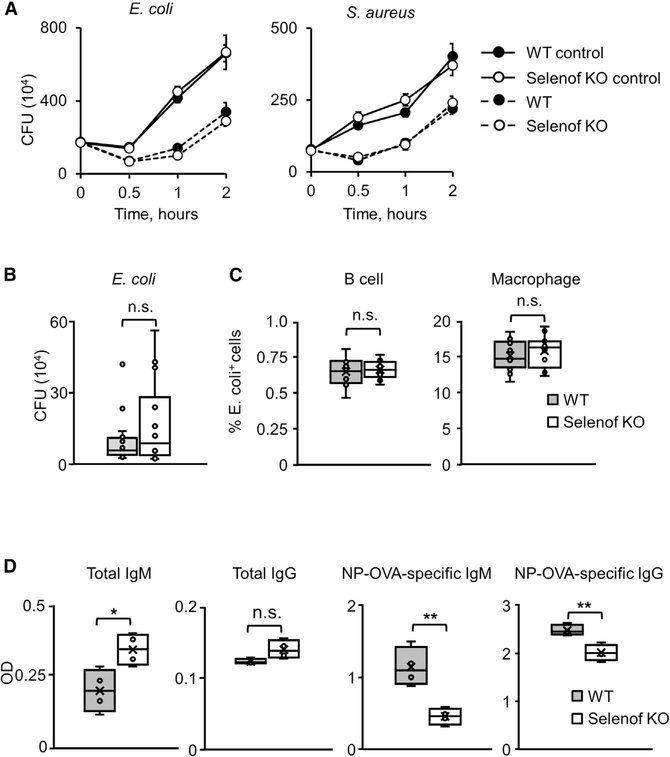
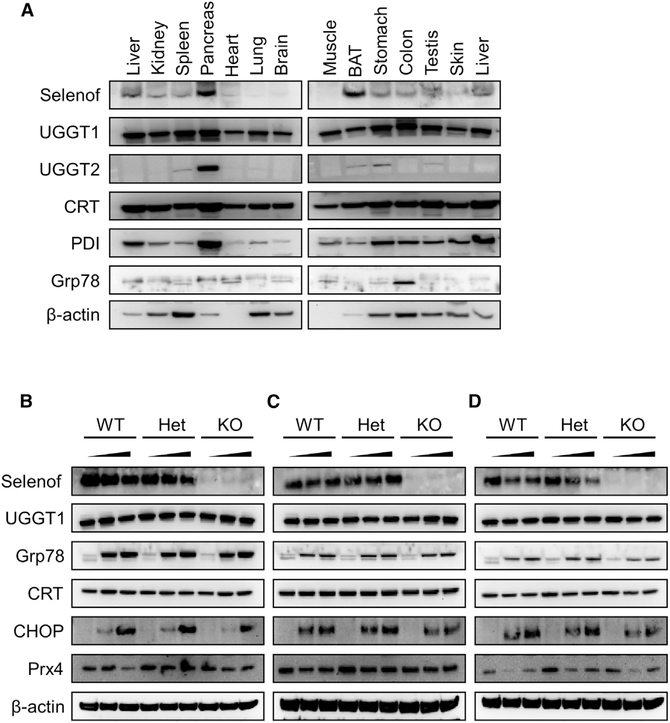
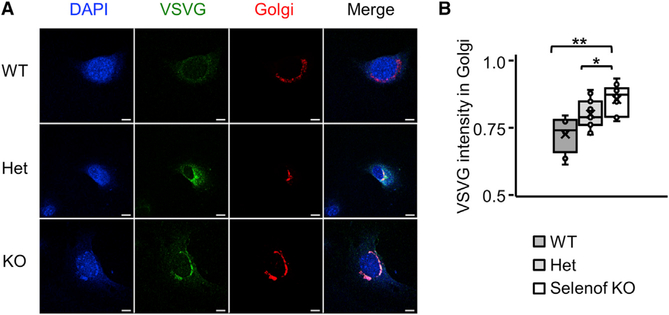
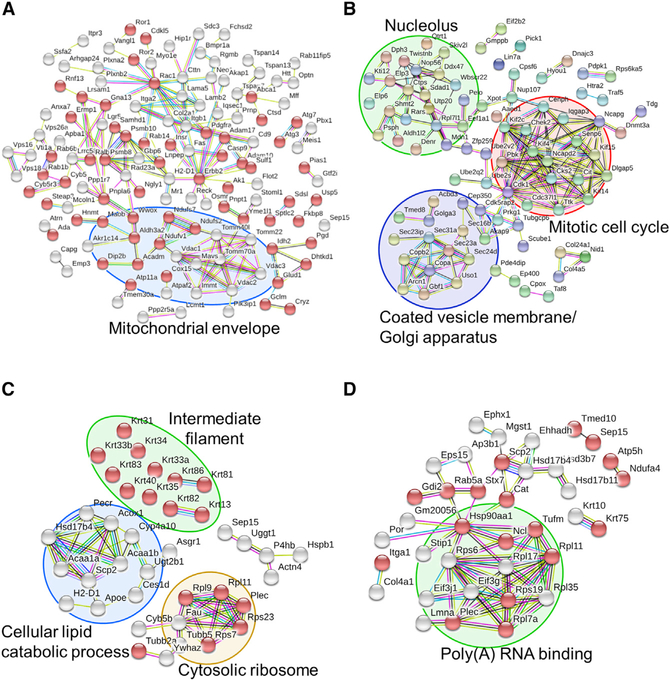
Selenof (15-kDa selenoprotein; Sep15) is an endoplasmic reticulum (ER)-resident thioredoxin-like oxidoreductase that occurs in a complex with UDP-glucose:glycoprotein glucosyltransferase. We found that Selenof deficiency in mice leads to elevated levels of non-functional circulating plasma immunoglobulins and increased secretion of IgM during in vitro splenic B cell differentiation. However, Selenof knockout animals show neither enhanced bacterial killing capacity nor antigen-induced systemic IgM activity, suggesting that excess immunoglobulins are not functional. In addition, ER-to-Golgi transport of a target glycoprotein was delayed in Selenof knockout embryonic fibroblasts, and proteomic analyses revealed that Selenof deficiency is primarily associated with antigen presentation and ER-to-Golgi transport. Together, the data suggest that Selenof functions as a gatekeeper of immunoglobulins and, likely, other client proteins that exit the ER, thereby supporting redox quality control of these proteins.

Keywords: IgM; Selenof; Sep15; endoplasmic reticulum; gatekeeper; immunoglobulins; knockout mouse; oxidoreductase; selenoprotein.


Conflict of interest statement

DECLARATION OF INTERESTS

The authors declare no competing interests.

Figures

Figure 1.
Figure 1.. Selenof Deficiency Leads to Elevated Immunoglobulin Levels
(A) Body and spleen weights of WT and Selenof KO mice (n = 4 per group). Spleen weights are different between WT and Selenof KO mice (p = 0.02). 13-week old WT and Selenof KO littermates were used. (B) IgM analyses in WT and Selenof KO mouse sera by ELISA. The sera were diluted to 1:12,000, and anti-IgM antibody was used as a capture antibody. 13-week-old littermates (n = 4 per group) were used. (C and D) Aliquots of sera from WT and Selenof KO mice were resolved under reducing SDS-PAGE (C) or 4–16% non-reducing NativePAGE (D), and blots were analyzed with anti-Ig-μ or anti-Ig-κ antibodies. 10 mg serum protein per lane was loaded. (E) Immunoglobulins were quantified in WT and Selenof KO sera by ELISA. Blood was withdrawn from the submandibular vein of 12-week-old male littermates (n = 8 per group). Sera were diluted to 1:50,000, and anti-Ig (H+L) was used as a capture antibody. Two-tailed probability values of a Student’s t test are as follows: IgG2a, p = 0.03; IgG2b, p = 0.006; IgG2c, p = 0.002; IgG3, p = 0.02; IgA, p = 0.0004; and IgM, p = 0.02. Data are expressed as mean ± SD. *p < 0.05; **p < 0.01; ***p < 0.001; n.s., not significant
Figure 2.
Figure 2.. Elevated IgM Secretion by Selenof KO LPS-Activated B Cells
(A) Growth of LPS-stimulated B splenocytes isolated from WT and Selenof KO mice. The graph shows B cell growth during differentiation. (B) IgM secretion measured during plasma B cell differentiation by ELISA. Two-tailed probability values of a Student’s t test from day 0 to day 5 are as follows: day 0, p = 0.0091; day 1, p = 0.3891; day 2, p = 0.18; day 3, p = 5E–06; day 4, p = 0.0003; and day 5, p = 0.0013. (C) Surface and intracellular IgM expression levels were measured in plasma B cells at differentiating day 4 using flow cytometry. MFI, median fluorescence intensity of the fluorescently labeled IgM. (D) Expression of ER proteins in WT and Selenof KO B cells. Western blotting of Selenof and other ER proteins with relevance to Selenof function during B cell differentiation. (E-G) Kinetics of IgM biosynthesis and transport were measured by radioactive pulse-chase assays (E and F) and quantified with ImageJ (G). The polymerization status of intracellular (E) and secreted (F) IgM was visualized in non-reducing conditions (E and F, upper panels), and Ig-μ levels were quantified in reducing blots (E and F, lower panels). At chase time 0, the levels of intracellular polymerization intermediates ((μ2L2)n) were increased by ~20%, and the Ig-μ levels were ~50% only slightly higher in Selenof KO plasma cells. Secreted IgM was more abundant (30–45%) in the spent media of Selenof KO LPS-activated splenocytes during the chase. Data are expressed as mean ± SD. *p < 0.05; **p < 0.01; ***p < 0.001.
Figure 3.
Figure 3.. Elevated Immunoglobulins in Selenof Deficiency Are Partially Nonfunctional
(A) In vitro clearance of bacterial cells by WT and Selenof KO serum. Shown are data for E. coli (left) and S. aureus (right). (B) In vivo clearance of bacterial infection by WT and Selenof KO mice. In vivo killing of E. coli by WT and Selenof KO mice, assessed as the number of remaining E. coli cells. (C) Uptake of pHrodo E. coli bioparticles by B cells (left) and macrophages (right) from WT mice that were opsonized by WT or Selenof KO serum. (D) Total and NP-specific IgM and IgG antibody production in WT or Selenof KO mice after immunization with NP-OVA. Data are expressed as mean ± SD. *p < 0.05; **p < 0.01; n.s., not significant.
Figure 4.
Figure 4.. Selenof Deficiency Does Not Lead to ER Stress
(A) Expression pattern of Selenof and other relevant proteins across mouse tissues. (B-D) Expression of Selenof and other relevant proteins in MEFs from WT, heterozygous, and Selenof KO mice subjected to ER stressors thapsigargin (B), tunicamycin (C), and brefeldin A (D). WT, heterozygous, and KO MEFs were treated with two concentrations of stressors along with control (DMSO treated): thapsigargin (5 nM and 50 nM), tunicamycin (50 ng/mL and 500 ng/mL), and brefeldin A (0.5 μM and 5 mM). Proteins assayed are shown on the left.
Figure 5.
Figure 5.. Delayed ER-to-Golgi Trafficking in Selenof KO MEFs
(A) Immunofluorescence micrographs of WT, heterozygous, and Selenof KO MEFs expressing adenoviral ts045-VSVG-EGFP and a Golgi marker. Representative images show the overlapping area where the VSVG-EGFP is retained in the ER-to- Golgi area, 10 min after the cells were transferred from the restrictive temperature (40°C) to the permissive temperature (32°C). Scale bars: 10 mm. (B) Quantification of VSVG fluorescence retained in the ER-to-Golgi area. Three cell lines per each genotype and more than 10 cells per each field were evaluated. Immunofluorescence microscopy images were analyzed by ImageJ. *p < 0.05; **p < 0.01.
Figure 6.
Figure 6.. Network Analysis of Enriched Pathways and Interactions
(A and B) WT and Selenof KO MEFs were cultured in serum-free media and subjected to quantitative proteomics analysis. Enriched proteins (p < 0.05, 138 up- and 198 down-regulated in Selenof KO) were further analyzed and visualized with STRING. Proteins with catalytic activity are marked with red bubbles. The functions “membrane part” and “regulation of cellular localization” were the most decreased in Selenof KO cells. Mitochondrial envelope proteins were decreased in Selenof KO (A). Proteins with increased levels in Selenof KO MEFs belonged to the clusters “Coated vesicle membrane/Golgi apparatus” (circled in purple), “Nucleolus” (circled in green), and “Mitotic cell cycle” (circled in red) (B). (C and D) Selenof and UGGT1 interacting proteins and the associated enriched pathways. Proteins from WT and Selenof KO livers were immunoprecipitated with antibodies against Selenof (C) or UGGT1 (D), followed by MS/MS analysis. Proteins identified (p < 0.05) were furtheranalyzed. Selenof antibodies enriched 44 proteins belonging to “structural molecule activity” (marked with red bubbles). Four protein clusters were identified and visualized: “cellular lipid catabolic process” (circled in blue), “Cytosolic ribosome” (circled in yellow), “Intermediate filament” (circled in green), and Selenof along with UGGT1 (C). UGGT1 antibodies enriched 63 proteins belonging to “extracellular exosome” (marked with red bubbles). A cluster with a function “Poly(A) RNA binding proteins” is circled in green in (D). Disconnected nodes are not shown.

References

    1. Anelli T, and Sitia R (2008). Protein quality control in the early secretory pathway. EMBO J. 27, 315–327. - PMC - PubMed
    1. Anelli T, Sannino S, and Sitia R (2015). Proteostasis and “redoxtasis” in the secretory pathway: Tales of tails from ERp44 and immunoglobulins. Free Radic. Biol. Med 83, 323–330. - PubMed
    1. Arnold JN, Wormald MR, Sim RB, Rudd PM, and Dwek RA (2007). The impact of glycosylation on the biological function and structure of human immunoglobulins. Annu. Rev. Immunol 25, 21–50. - PubMed
    1. Berry MJ, Banu L, Chen YY, Mandel SJ, Kieffer JD, Harney JW, and Larsen PR (1991). Recognition of UGA as a selenocysteine codon in type I deiodinase requires sequences in the 3′ untranslated region. Nature 353, 273–276. - PubMed
    1. Bertolotti M, Yim SH, Garcia-Manteiga JM, Masciarelli S, Kim YJ, Kang MH, luchi Y, Fujii J, Vene R, Rubartelli A, et al. (2010). B- to plasma-cell terminal differentiation entails oxidative stress and profound reshaping of the antioxidant responses. Antioxid. Redox Signal. 13,1133–1144. - PubMed

Publication types

LinkOut - more resources