. 2018 May 1;23(5):1448-1460.
doi: 10.1016/j.celrep.2018.03.131.

CSF1R+ Macrophages Sustain Pancreatic Tumor Growth through T Cell Suppression and Maintenance of Key Gene Programs that Define the Squamous Subtype

Affiliations

CSF1R+ Macrophages Sustain Pancreatic Tumor Growth through T Cell Suppression and Maintenance of Key Gene Programs that Define the Squamous Subtype

Juliana B Candido et al. Cell Rep. .

Abstract

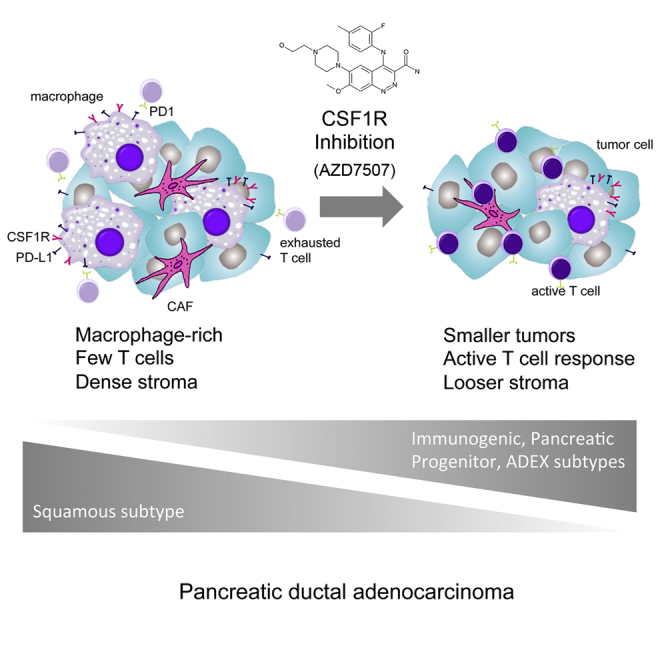
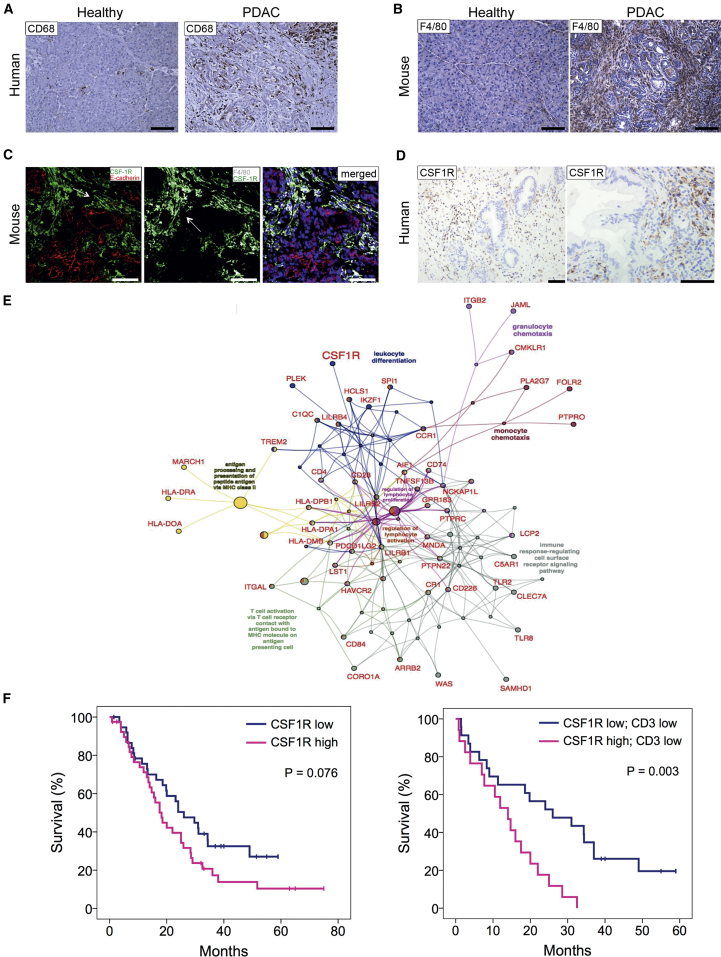
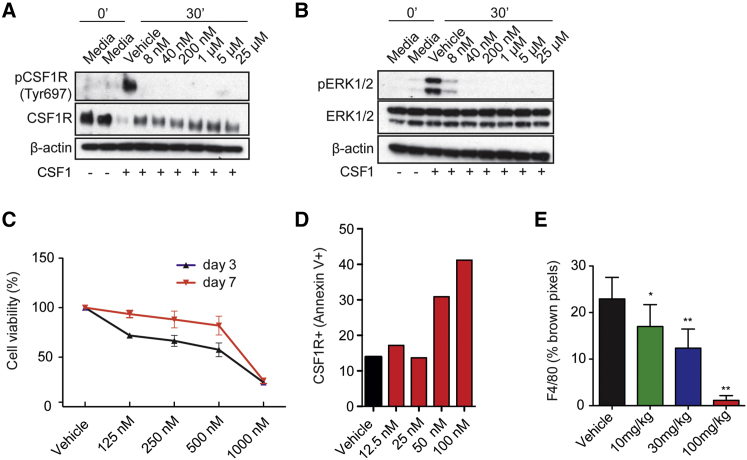
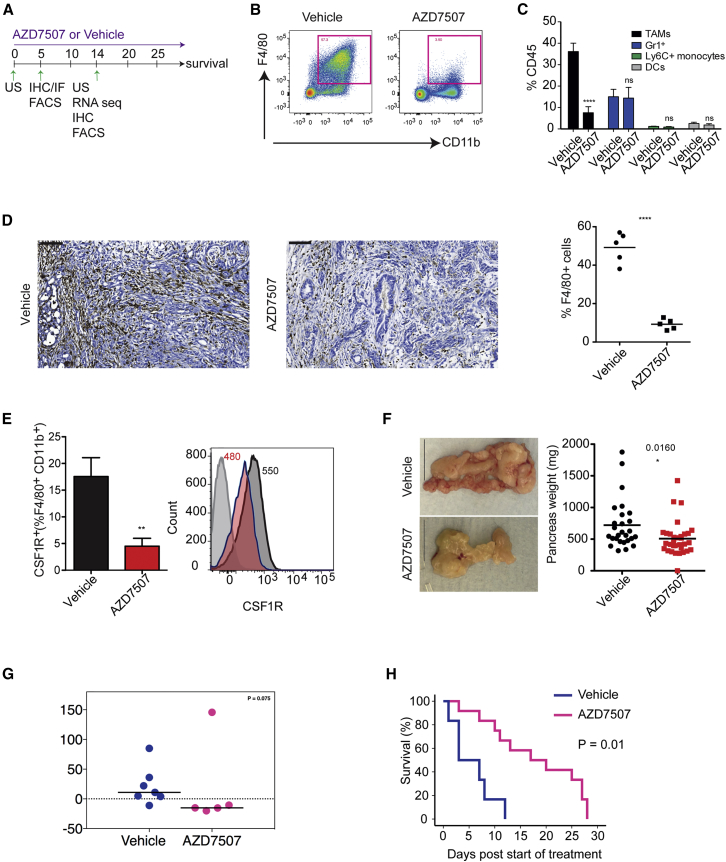
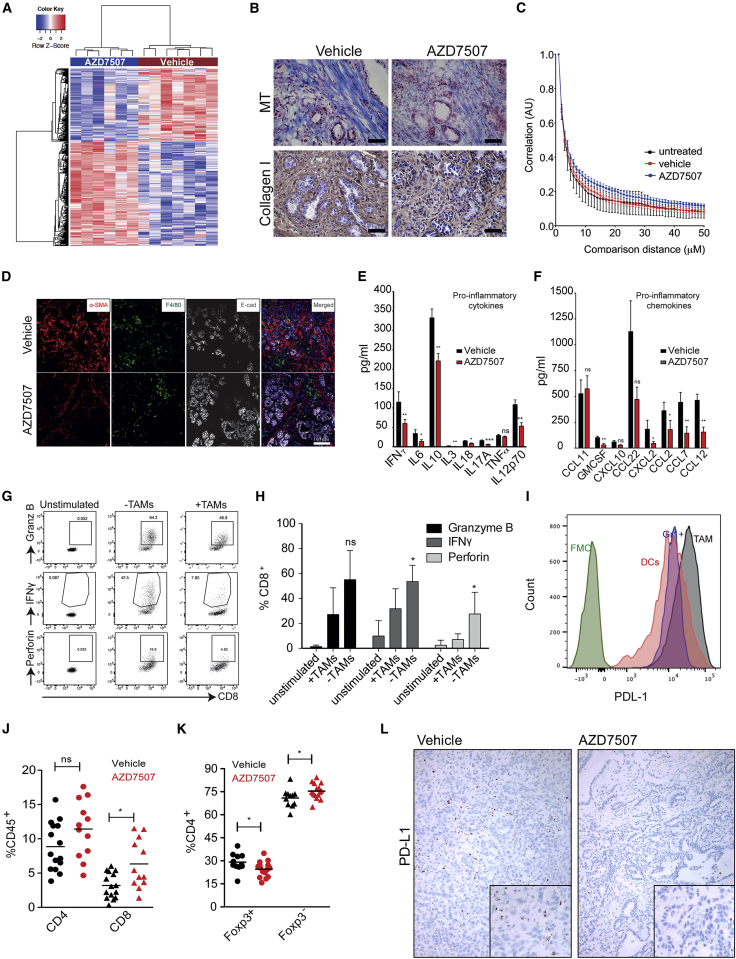
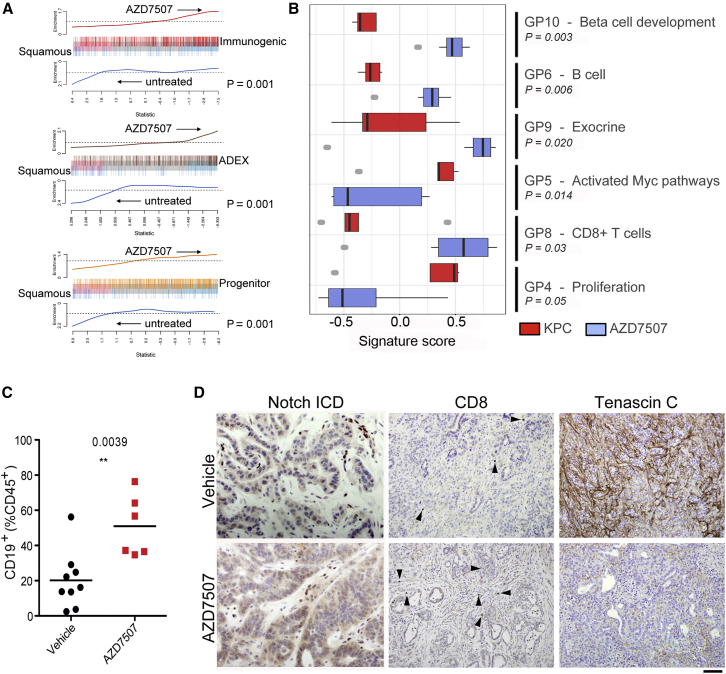
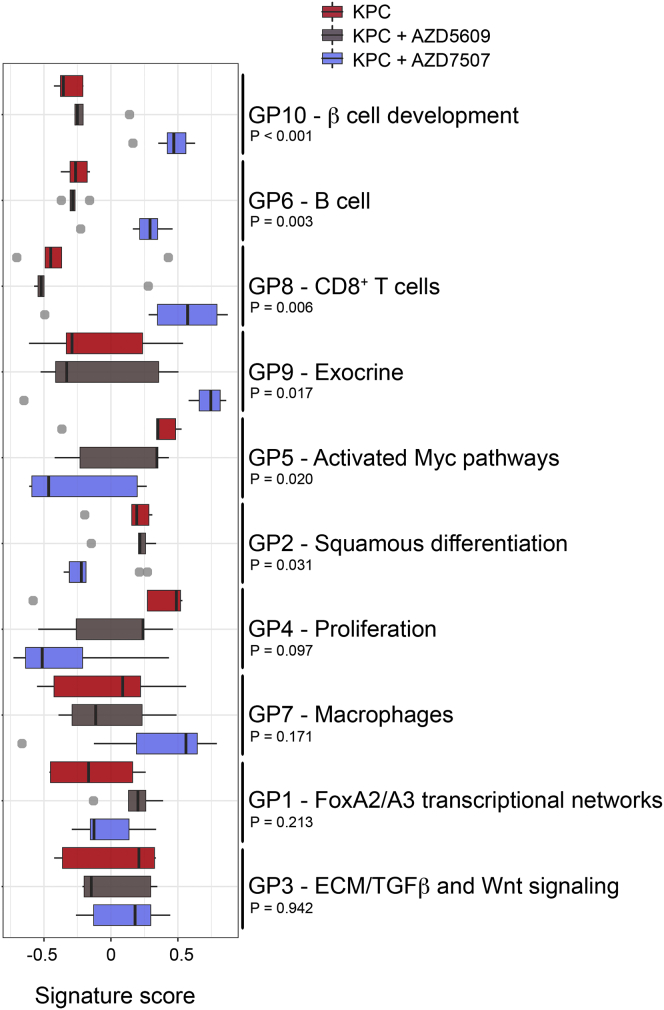
Pancreatic ductal adenocarcinoma (PDAC) is resistant to most therapies including single-agent immunotherapy and has a dense desmoplastic stroma, and most patients present with advanced metastatic disease. We reveal that macrophages are the dominant leukocyte population both in human PDAC stroma and autochthonous models, with an important functional contribution to the squamous subtype of human PDAC. We targeted macrophages in a genetic PDAC model using AZD7507, a potent selective inhibitor of CSF1R. AZD7507 caused shrinkage of established tumors and increased mouse survival in this difficult-to-treat model. Malignant cell proliferation diminished, with increased cell death and an enhanced T cell immune response. Loss of macrophages rewired other features of the TME, with global changes in gene expression akin to switching PDAC subtypes. These changes were markedly different to those elicited when neutrophils were targeted via CXCR2. These results suggest targeting the myeloid cell axis may be particularly efficacious in PDAC, especially with CSF1R inhibitors.

Keywords: CSF1R; T cells; macrophages; pancreatic cancer.


Figures

None
Graphical abstract
Figure 1
Figure 1
Human and Mouse PDAC Tumors Are Infiltrated by Macrophages and Overexpress CSF1R (A) IHC showing pancreas areas of positivity for CD68 in adjacent normal pancreas and patients diagnosed with PDAC. (B) IHC showing F4/80 staining in murine healthy pancreas and in PDAC tissue. Scale bar, 100 μm. (C) Immunofluorescence analysis of CSF1R in murine pancreatic tissue. Tissue sections from the pancreas of KPC mice were stained with F4/80 (gray) and E-cadherin (red), and with CSF1R (green) and counterstained with DAPI (blue). Scale bar, 100 μm. (D) IHC showing CSF1R staining in human PDAC tissue. Scale bar, 200 μm. (E) ClueGO-CluePedia functional network of the human PDAC macrophage gene program (GP7) showing genes associated with significant gene ontology terms (p value <0.01). Network nodes and edges are colored by a specific gene ontology terms. (F) Kaplan-Meier analysis of survival post-resection of a cohort of human PDAC patients in terms of low (below median) or high (above median) CSF1R expression, low or high CD3+ cells, and low or high CSF1R expression in CD3 low patients. p values, log rank test, n = 79. See also Figure S1.
Figure 2
Figure 2
AZD7507 Is a Potent and Highly Selective ATP-Competitive Inhibitor of CSF1R Kinase Activity (A and B) Bone marrow-derived macrophages (BMDMs) were cultured with either media or CSF1 at indicated AZD7507 concentrations and protein lysate analyzed by western blot for pCSF1R (Tyr697) and (Tyr807), total CSF1R and β-actin (A), and pERK1/2 (Thr202/Tyr204), total ERK1/2 and β-actin (B). (C) Bone marrow cells were cultured with CSF1 at indicated AZD7507 concentrations for 3 and 7 days, and cell growth was assessed by the WST-1 colorimetric assay. The graph shows the percentage viability of treated cells. Data are represented as mean ± SEM for n > 3. (D) Dead CSF1R positive BMDM cells were examined using Annexin V+ membrane viability dye staining (FVD) and detected by flow cytometry when the cells were cultured for 7 days in vitro with CSF1. The graph shows the percentage of necrotic (Annexin V+, FVD+, CSF1R+) cells. (E) AZD7507-treated MDA-MB-231 xenograft tumors at day 20 were stained with an antibody against F4/80 for IHC, and macrophage numbers were quantified as percentage of brown pixels. Data are represented as mean ± SEM. See also Figure S2.
Figure 3
Figure 3
CSF1R Inhibition Depletes Macrophages, Regresses Tumor Growth, and Prolongs Survival in KPC Mice (A) Schematic diagram of the experimental setup with an outline summary of the treatment regimen and time points used. (B) Representative flow cytometry plot of CD11b and F4/80 in live CD45+ cells from KPC tumor of either vehicle or AZD7507-treated mice. (C) Graph shows quantification of TAMs, Gr1+ cells, Ly6C+ monocytes, and CD11c+ dendritic cells as percentage of total CD45+ cells (data are shown are mean ± SEM, n > 7, unpaired t test). (D) IHC showing F4/80+ macrophages in tumors from KPC mice treated as indicated. Graph shows quantification of F4/80 IHC (data are shown as mean, n = 5). (E) Histogram on right shows representative flow cytometry with numbers showing mean geoMFI data (n = 5 mice per group; isotype control, light gray; vehicle, dark gray; AZD7507, red). Graph on left shows frequency of CSF1R+ TAMs in tumors of mice treated as indicated (data are shown as mean ± SEM, n = 5). (F) Gross morphology of tumors and tumor weight in each group after 2 weeks of treatment. (Data shown are mean ± SEM, n > 34, unpaired t test.) (G) Tumor growth was monitored by high-resolution ultrasound in KPC mice with mean tumor diameters >5 mm before (day 0) and 14 days after treatment with either vehicle or AZD7507. Quantification of tumor volume in vehicle-treated (n = 7) and AZD7507-treated mice (n = 5). (H) Kaplan-Meier survival analysis of KPC mice treated with vehicle (n = 6) or AZD7507 (n = 12). See also Figure S3.
Figure 4
Figure 4
AZD7507 Alters Tumor Microenvironment Composition and Function (A) Signal log2 expression of downregulated (blue) and upregulated (red) genes in vehicle-treated tumors compared with AZD7507. The color intensity is proportional to the signal log2 intensity. All genes had a false discovery rate (FDR) <0.05. (B) IHC staining of Masson’s Trichrome and Collagen I in tumors of KPC mice treated for 5 days with either vehicle or AZD7507 (n > 3). Bar, 50 μm. (C) Gray-level correlation matrix (GLCM) texture analysis of the second harmonic generation (SHG) signal emitted by PDAC-associated collagen in mice treated as indicated. Mean ± SEM at each distance. (D) KPC tissue sections from the pancreas of each group were stained against E-cadherin (gray) and with α-SMA (red) and F4/80 (green). Tissues were counterstained with the nuclear stain DAPI (blue). Image represents tissue samples from a total of at least n = 3 KPC mice per group. (E and F) Protein lysates were obtained from tumors treated as indicated and were analyzed for cytokine contents using multiplex (E), cytokine (F), and chemokine analysis (Myriad RBM Mouse Inflammation MAO v.1.0 array) (n > 9). (G and H) Representative flow cytometry analysis (G) and quantification (H) for Granzyme B, IFN-γ, and Perforin expression in either unstimulated or stimulated (CD3/CD28) cells cultured for 72 hr in the presence or absence of TAMs (n > 4). (I) Histogram of PD-L1 expression by fluorescence-activated cell sorting (FACS) analysis on myeloid subsets as indicated (n = 4). (J) Flow cytometry analysis of the CD45+ T cell subsets in the tumor of mice treated as indicated (n > 10). (K) Flow cytometry analysis of the frequency of Foxp3+ Tregs and Foxp3 Effector CD4+ T cells in the tumor of mice treated with either vehicle or AZD7507. p values were calculated by Mann-Whitney U test (p < 0.05, ∗∗p < 0.01, and ∗∗∗p < 0.001), mean ± SEM. (L) RNAscope in site hybridization for PD-L1 in tumors for KPC mice treated with either vehicle or AZD7507. See also Figures S1 and S4.
Figure 5
Figure 5
CSF1R Inhibition Results in Significant Reprogramming of Gene Expression Profiles in KPC Mice (A) Barcode plots showing strong enrichment of PDAC class signatures in either control KPC or KPC mice treated with AZD7507. Vertical bars represent signature genes, and lines represent relative signature enrichment. For example, in the top panel, red vertical bars represent genes significantly expressed in the Immunogenic class that are enriched in AZD7507-treated KPC tumors. Enrichment is indicated by an ascending line. p < 0.001 in all cases, n ≥ 5. (B) Boxplots showing the relative enrichment of the indicated gene programs (GP) in AZD7507-treated versus untreated tumor-bearing KPC mice. Boxplots are annotated by a Kruskal-Wallis p value, n ≥ 5. (C) Flow cytometry analysis of CD19+ B cells subsets in tumors of mice treated with vehicle (n = 9) or AZD7507 (n = 6). (D) IHC for Notch ICD, CD8 (arrows indicate positive cells), and Tenascin C confirms upregulation of ADEX and Immunogenic signatures and downregulation of Squamous signature. Scale bar, 200 μM. See also Figure S5.
Figure 6
Figure 6
Inhibition of CSF1R Is Not Equivalent to CXCR2 Inhibition Boxplots showing the relative enrichment of the indicated gene programs (GP) stratified by treatment as indicated. Boxplots are annotated by a Kruskal-Wallis p value, n ≥ 5. See also Figure S6.

References

    1. Alagesan B., Contino G., Guimaraes A.R., Corcoran R.B., Deshpande V., Wojtkiewicz G.R., Hezel A.F., Wong K.K., Loda M., Weissleder R. Combined MEK and PI3K inhibition in a mouse model of pancreatic cancer. Clin. Cancer Res. 2015;21:396–404. - PMC - PubMed
    1. Bailey P., Chang D.K., Nones K., Johns A.L., Patch A.M., Gingras M.C., Miller D.K., Christ A.N., Bruxner T.J., Quinn M.C., Australian Pancreatic Cancer Genome Initiative Genomic analyses identify molecular subtypes of pancreatic cancer. Nature. 2016;531:47–52. - PubMed
    1. Beatty G.L., Chiorean E.G., Fishman M.P., Saboury B., Teitelbaum U.R., Sun W., Huhn R.D., Song W., Li D., Sharp L.L. CD40 agonists alter tumor stroma and show efficacy against pancreatic carcinoma in mice and humans. Science. 2011;331:1612–1616. - PMC - PubMed
    1. Cannarile M.A., Weisser M., Jacob W., Jegg A.M., Ries C.H., Rüttinger D. Colony-stimulating factor 1 receptor (CSF1R) inhibitors in cancer therapy. J. Immunother. Cancer. 2017;5:53. - PMC - PubMed
    1. Chao T., Furth E.E., Vonderheide R.H. CXCR2-dependent accumulation of tumor-associated neutrophils regulates T-cell immunity in pancreatic ductal adenocarcinoma. Cancer Immunol. Res. 2016;4:968–982. - PMC - PubMed

Publication types

MeSH terms

Substances