. 2018 Apr 17:12:15.
doi: 10.3389/fnsys.2018.00015. eCollection 2018.

Smooth Pursuit Eye Movement of Monkeys Naive to Laboratory Setups With Pictures and Artificial Stimuli

Affiliations

Smooth Pursuit Eye Movement of Monkeys Naive to Laboratory Setups With Pictures and Artificial Stimuli

Yehudit Botschko et al. Front Syst Neurosci. .

Abstract

When animal behavior is studied in a laboratory environment, the animals are often extensively trained to shape their behavior. A crucial question is whether the behavior observed after training is part of the natural repertoire of the animal or represents an outlier in the animal's natural capabilities. This can be investigated by assessing the extent to which the target behavior is manifested during the initial stages of training and the time course of learning. We explored this issue by examining smooth pursuit eye movements in monkeys naïve to smooth pursuit tasks. We recorded the eye movements of monkeys from the 1st days of training on a step-ramp paradigm. We used bright spots, monkey pictures and scrambled versions of the pictures as moving targets. We found that during the initial stages of training, the pursuit initiation was largest for the monkey pictures and in some direction conditions close to target velocity. When the pursuit initiation was large, the monkeys mostly continued to track the target with smooth pursuit movements while correcting for displacement errors with small saccades. Two weeks of training increased the pursuit eye velocity in all stimulus conditions, whereas further extensive training enhanced pursuit slightly more. The training decreased the coefficient of variation of the eye velocity. Anisotropies that grade pursuit across directions were observed from the 1st day of training and mostly persisted across training. Thus, smooth pursuit in the step-ramp paradigm appears to be part of the natural repertoire of monkeys' behavior and training adjusts monkeys' natural predisposed behavior.

Keywords: animal behavior; eye movement; learning; motion; smooth pursuit.


Figures
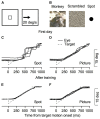
FIGURE 1
FIGURE 1
Behavioral task and examples of eye movements. (A,B) The snapshots illustrate the temporal structure of the task. The small square rectangle represents a target that was presented in the center of the screen which stepped to an eccentric position after a short delay and moved at constant speed. Three possible targets were interleaved in each session: a picture of a monkey, a scrambled version of this picture, or a spot. (C–F) Examples from Monkey C for eye position traces from the 1st day of training (C,D) and after extensive training (E,F). Solid black lines represent the eye position in the five trials in which Monkey C tracked a target that moved to the left. To insure these were not outliers we chose five trials where the rank of the fraction of pursuit displacement out of the total eye displacement was closest to the median. The gray dashed lines represent the target position.
FIGURE 2
FIGURE 2
Example of the effect of training on initial eye velocity. Average eye velocity as a function of the time from target motion onset for Monkey C (A) and Monkey B (B). The dashed and solid traces show data from the 1st day of training and after extensive training. The black and gray traces show the eye velocity for trials in which a picture and a spot were presented as the target. Dotted black line represents the target velocity. Data are shown for Monkey C and B on trials in which the target moved to the left and to the right, respectively.
FIGURE 3
FIGURE 3
Initial eye velocity traces across training sessions. (A,B,E,F) Eye velocity as a function of time from target motion onset. Each thin line shows the average eye velocity in a single session. Colors correspond to the color code on the right and represent the session number. The progression from dark blue through green to dark red corresponds to the session number starting from the 1st day of training. The black dashed traces show the data from sessions that were recorded after many days of training on pursuit tasks. Different columns correspond to the different target conditions. (C,D,G,H) Decomposition of the eye velocity traces to the slope of linear regression (linear acceleration; C,G) and latency (D,H). The horizontal axis represents the session number. Values to the right of the vertical dotted line were recorded after extensive training on pursuit tasks. Presented values were extracted from the average traces. The top (A–D) and bottom (E–H) plots shows data for Monkeys C and B.
FIGURE 4
FIGURE 4
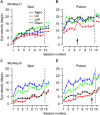
The progression over training days for eye velocity during pursuit initiation. The horizontal axis represents the session number. Values to the right of the vertical dotted line were recorded after extensive training on pursuit tasks. The vertical axis represents the average eye velocity at 250 ms after target motion onset. The top (A,B) and bottom (C,D) plots shows data for Monkeys C and B. Different columns correspond to the different target conditions and different colors represent different movement directions. The arrows in (B,D) mark the sessions in which we switched to the second monkey picture.
FIGURE 5
FIGURE 5
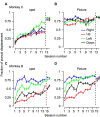
The progression over training days for the fraction of pursuit displacement across all the trials. The progression over training days of the fraction of position displacement with pursuit. The horizontal axis represents the session number, sessions to the right of the vertical dotted line were recorded after extensive training on pursuit tasks. The top (A,B) and bottom (C,D) plots shows data for Monkeys C and B. Different columns correspond to the different target conditions and colors represent the movement directions.
FIGURE 6
FIGURE 6
Comparison between pursuit initiation for the different targets. (A) Average eye velocity traces across all recording sessions for the picture (solid black), scrambled (gray), and spot (dashed) targets. Left and right plots show data for Monkeys C and B. (B,C) The progression over training days for eye velocity during pursuit initiation. The horizontal axis represents the session number. Values to the right of the vertical dotted line were recorded after extensive training on pursuit tasks. The vertical axis represents the average eye velocity across all target motion directions at 250 ms after target motion onset. (D–F) Quantitative comparison between target conditions. Each symbol shows the eye velocity at 250 ms after target motion onset; different symbols correspond to different sessions and different motion directions. Open and filled circles show the data for different monkeys. The plots present comparisons of the spot vs. the picture (D) the scrambled picture vs. the monkey picture (E), and the spot vs. the scrambled picture (F).
FIGURE 7
FIGURE 7
Power spectrum of the picture and scrambled stimuli. (A) The log10 of the ratio between the power spectrum of the picture and the scrambled target. Positive values (picture > scrambled) are represented by red/yellow pixels and negative values (picture < scrambled) in cyan/blue colors. The power spectrum was smoothed with a 2-dimensional Gaussian kernel (SD = 1 pixel). The DC component was removed from this plot and replaced by a small white square in the center of the plot. (B) The average power as a function of the spatial frequency for the picture (blue) and scrambled (red) stimuli. The dashed line regresses the DC component, which was equal for both stimuli. The spatial frequencies were calculated by transforming the power spectrum into polar coordinates (see section “Materials and Methods”). (A,B) Shows the power spectrum of the grayscale image.
FIGURE 8
FIGURE 8
The variability in eye velocity during training. (A) The average standard deviation (SD) of the eye velocity across all recording sessions for the picture (solid black), scrambled (gray), and spot (dashed) targets. Left and right plots show data for Monkeys C and B. (B,C) The SD as a function of the mean eye velocity in all conditions before and after extensive training. Each dot shows data from a single target condition in a single direction of movement and on a single recording day. Gray and black dots show data before and after extensive training. Lines show the regression through the origin and correspond to the colors of the dots.

References

    1. Adelson E. H., Bergen J. R. (1985). Spatiotemporal energy models for the perception of motion. J. Opt. Soc. Am. A 2 284–299. 10.1364/JOSAA.2.000284 - DOI - PubMed
    1. Bizzi E., Kalil R. E., Tagliasco V. (1971). Eye-head coordination in monkeys: evidence for centrally patterned organization. Science 173 452–454. 10.1126/science.173.3995.452 - DOI - PubMed
    1. Bourrelly C., Quinet J., Cavanagh P., Goffart L. (2016). Learning the trajectory of a moving visual target and evolution of its tracking in the monkey. J. Neurophysiol. 116 2739–2751. 10.1152/jn.00519.2016 - DOI - PMC - PubMed
    1. Brielmann A. A., Spering M. (2015). Effects of reward on the accuracy and dynamics of smooth pursuit eye movements. J. Exp. Psychol. Hum. Percept. Perform. 41 917–928. 10.1037/a0039205 - DOI - PubMed
    1. Evarts E. V. (1968). Relation of pyramidal tract activity to force exerted during voluntary movement. J. Neurophysiol. 31 14–27. 10.1152/jn.1968.31.1.14 - DOI - PubMed

LinkOut - more resources