. 2018 Apr 17:9:795.
doi: 10.3389/fimmu.2018.00795. eCollection 2018.

A Reappraisal on the Potential Ability of Human Neutrophils to Express and Produce IL-17 Family Members In Vitro: Failure to Reproducibly Detect It

Affiliations

A Reappraisal on the Potential Ability of Human Neutrophils to Express and Produce IL-17 Family Members In Vitro: Failure to Reproducibly Detect It

Nicola Tamassia et al. Front Immunol. .

Abstract

Neutrophils are known to perform a series of effector functions that are crucial for the innate and adaptive responses, including the synthesis and secretion of a variety of cytokines. In light of the controversial data in the literature, the main objective of this study was to more in-depth reevaluate the capacity of human neutrophils to express and produce cytokines of the IL-17 family in vitro. By reverse transcription quantitative real-time PCR, protein measurement via commercial ELISA, immunohistochemistry (IHC) and immunofluorescence (IF), flow cytometry, immunoblotting, chromatin immunoprecipitation (ChIP), and ChIP-seq experiments, we found that highly pure (>99.7%) populations of human neutrophils do not express/produce IL-17A, IL-17F, IL-17AF, or IL-17B mRNA/protein upon incubation with a variety of agonists. Similar findings were observed by analyzing neutrophils isolated from active psoriatic patients. In contrast with published studies, IL-17A and IL-17F mRNA expression/production was not even found when neutrophils were incubated with extremely high concentrations of IL-6 plus IL-23, regardless of their combination with inactivated hyphae or conidia from Aspergillus fumigatus. Consistently, no deposition of histone marks for active (H3K27Ac) and poised (H3K4me1) genomic regulatory elements was detected at the IL-17A and IL-17F locus of resting and IL-6 plus IL-23-stimulated neutrophils, indicating a closed chromatin conformation. Concurrent experiments revealed that some commercial anti-IL-17A and anti-IL-17B antibodies (Abs), although staining neutrophils either spotted on cytospin slides or present in inflamed tissue samples by IHC/IF, do not recognize intracellular protein having the molecular weight corresponding to IL-17A or IL-17B, respectively, in immunoblotting experiments of whole neutrophil lysates. By contrast, the same Abs were found to more specifically recognize other intracellular proteins of neutrophils, suggesting that their ability to positively stain neutrophils in cytospin preparations and, eventually, tissue samples derives from IL-17A- or IL-17B-independent detections. In sum, our data confirm and extend, also at epigenetic level, previous findings on the inability of highly purified populations of human neutrophils to express/produce IL-17A, IL-17B, and IL-17F mRNAs/proteins in vitro, at least under the experimental conditions herein tested. Data also provide a number of justifications explaining, in part, why it is possible to false positively detect IL-17A+-neutrophils.

Keywords: IL-17 members; IL-17A; IL-17B; IL-17F; neutrophils.


Figures
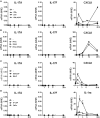
Figure 1
Figure 1
IL-17A, IL-17F, CXCL8, and IL-1ra mRNA expression levels in human neutrophils activated by a variety of stimuli. Human neutrophils were cultured at 5 × 106/ml for up to 20 h with (A) 100 U/ml IFNγ and/or 100 ng/ml LPS; (B) 1,000 U/ml IFNα and/or 5 µM R848; (C) 10 ng/ml GM-CSF or 100 nM fMLF; (D) 1,000 U/ml G-CSF or 5 ng/ml TNFα. IL-17A, IL-17F, CXCL8, and IL-1ra mRNA expression was evaluated by reverse transcription quantitative real-time PCR (RT-qPCR) and data depicted as mean normalized expression (MNE) units after GAPDH mRNA normalization. The experiments depicted in each panels (A–D) are representative of at least three ones with similar results. Error bars stand for SEs calculated from triplicate qPCR reactions.
Figure 2
Figure 2
No induction of IL-17A, IL-17F, and IL-17RC mRNA expression in neutrophils incubated with IL-6 plus IL-23, in combination with inactivated Aspergillus fumigatus hyphae or conidia. Neutrophils (5 × 106/ml) were incubated either with 100 ng/ml rIL-17A for 2 h or with or without 20 µg/ml IL-6 plus 2 µg/ml IL-23 for 1 h, prior to adding, or not, inactivated A. fumigatus conidia (1:5 neutrophils/conidia ratio) and hyphae (1:1 neutrophils/hyphae ratio) for additional 1 h. Neutrophils were then harvested for RNA extraction to evaluate IL-17A (A), IL-17F (B), IL-17RC (C), IL-17RA (D), and SOCS3 (F) mRNA expression by reverse transcription quantitative real-time PCR. Gene expression data are depicted as mean normalized expression (MNE) units after GAPDH mRNA normalization (mean ± SEM, n = 4). Asterisks stand for significant differences as compared to untreated cells: *P < 0.05, **P < 0.01, by Student’s t-test. (E) Immunoblot displaying STAT3 tyrosine phosphorylation in neutrophils, either untreated or cultured for 15 or 60 min with 20 µg/ml IL-6 plus 2 µg/ml IL-23 (representative experiment, n = 2).
Figure 3
Figure 3
Lack of IL-17A and IL-17F production by human neutrophils activated by IL-6 plus IL-23 in combination with inactivated Aspergillus fumigatus hyphae or conidia. Neutrophils (5 × 106/ml) were incubated with or without 20 µg/ml IL-6 plus 2 µg/ml IL-23 and then cultured for three more hours in the presence or not of inactivated A. fumigatus conidia and hyphae (used at 1:5 and 1:1, respectively). After incubation, IL-17A (A) and CXCL8 (B) levels were determined in cell-free supernatants and in corresponding cell pellets by specific ELISA. Values are depicted as the mean ± SD or as not detected (nd) when values were under the detection limit (n = 3). Asterisks stand for significant differences as compared to untreated cells: *P < 0.05, **P < 0.01, by Student’s t-test.
Figure 4
Figure 4
Expression of surface IL-17RA and IL-17RC in neutrophils activated under various experimental conditions. Expression of surface IL-17RA (left panel) and IL-17RC (right panel) was evaluated by flow cytometry in neutrophils either freshly isolated or cultured for 3 h without or with 100 U/ml IFNγ plus 100 ng/ml LPS, 5 µM R848 (A), 20 µg/ml IL-6 plus 2 µg/ml IL-23 alone or in the presence of inactivated Aspergillus fumigatus conidia, hyphae or 500 ng/ml rIL-17A (B). Graphs depict a representative experiment out of three independent ones with similar results. Histograms show staining by specific and isotype control Abs, respectively, for each stimulatory condition.
Figure 5
Figure 5
Chromatin immunoprecipitation (ChIP)-Seq profiles of H3K4me1 and H3K27Ac at the IL17A and IL17F loci in human neutrophils and Th17 cell lines. Representative snapshots depicting H3K4me1 and H3K27Ac ChIP-seqs at the IL17A and IL17F genomic loci in freshly isolated human neutrophils or, as retrieved from NIH Epigenomics Roadmap Initiative (72), in phorbol mysistate acetate/ionomycin-stimulated Th17 cell lines.
Figure 6
Figure 6
H3K4me1 or H3K27Ac levels at the IL-17A, IL-17F, and SOCS3 genomic loci of Th17 cell lines and resting/IL-6 plus IL-23-activated neutrophils. Enrichment levels of H3K4me1 (left panels) and H3K27Ac (right panels) at the IL-17A (A), IL-17F (B), and SOCS3 (C) genomic loci by chromatin immunoprecipitation (ChIP) analysis in human Th17 cell lines and neutrophils incubated for 1 h with or without 20 µg/ml IL-6 plus 2 µg/ml IL-23. (A–C) Schemes illustrating the positions of the designed primer pairs amplifying promoter and potential enhancer regions of IL-17A, IL-17F, and SOCS3 for ChIP analysis are depicted at the top of each panel. Coimmunoprecipitated DNA samples were expressed as percent of the total input. Panels in (A–C) depict a representative experiment out of two independent ones with similar results. Error bars represent SEs calculated from triplicate qPCR reactions.
Figure 7
Figure 7
IL-17A, IL-17F, IL-17RA, IL-17RC, CXCL8, TNFα, and SOCS3 mRNA expression, as well as IL-17R surface expression, in neutrophils from patients with psoriasis. (A) Neutrophils isolated from healthy donors (HDs) (n = 3) or psoriatic patients (n = 3) were cultured for 20 h with 100 U/ml IFNγ plus 100 ng/ml LPS, 5 µM R848, or 500 ng/ml IL-17A to evaluate IL-17A, IL-17F, IL-17RA, IL-17RC, CXCL8, TNFα, and SOCS3 mRNA expression by reverse transcription quantitative real-time PCR. Gene expression data are depicted as mean normalized expression (MNE) units after GAPDH mRNA normalization. (B) Surface IL-17RA and IL-17RC expression evaluated by flow cytometry in human neutrophils from HDs or psoriatic patients. Values represent the mean ± SEM (n = 3). For the data of panels (A,B) no significant differences between HDs or psoriatic patients were observed by two-way ANOVA followed by Bonferroni’s post-test.
Figure 8
Figure 8
Staining human neutrophils by anti-IL-17A (AF-317-NA) polyclonal antibodies (Abs). (A) Immunofluorescence (top panels) and immunohistochemistry (lower panels) stainings of two FFPE cases of human pustular psoriasis using anti-IL-17A (AF-317-NA) and anti-CD66b Abs (as labeled). Top panels show DAPI, FITC channel, and merge to recognize neutrophil shape; lower panels show different magnification of IHC and double IHC to characterize IL-17A+ cells with the neutrophil marker CD66b. (B) Cytospins of neutrophils, either untreated (top panels) or treated with 5 µM R848 (bottom panels) for 3 h, were stained with anti-IL-17A (AF-317-NA, left panels) and anti-CXCL8 (right panels) Abs. Original magnification 200× [first row in (A) and left image in third row, scale bar 100 µm] and 400× [second row in (A), center/right images in third row in (A), as well as in (B), scale bar 50 µm]. Images of the second row in (A) represent magnifications of images in first row. (C) AF-317-NA immunoblot of lysates from neutrophils either freshly isolated (T0, from two donors) or incubated for 3 h with or without 2 µg/ml IL-6 plus 0.2 µg/ml IL-23 (low), 20 µg/ml IL-6 plus 2 µg/ml IL-23 (high), or 5 µM R848. Recombinant human IL-17A (rhIL-17A) was used as positive control. Panels (B,C) display representative experiments out of two independent ones with similar results.
Figure 9
Figure 9
Levels of IL-17A, IL-17B, IL-17F, IL-10, IL-17RC, IL-17RA, azurocidin, neutrophil elastase, and myeloperoxidase (MPO) mRNA expression in neutrophils at different stages of maturation. mRNA expression data derive from Gene Expression Omnibus database (accession number GSE42519) (65). (A) IL-17A, IL-17B, IL-17F, IL-10, IL-17RC, and IL-17RA or (B) azurocidin (AZU1), neutrophil elastase (ELANE), and MPO mRNA expression levels were measured in the following cell types: hematopoietic stem cells (HSCs), multipotent progenitors (MPPs), common myeloid progenitors (CMPs), granulocyte-macrophage progenitors (GMPs), early and late promyelocytes (PMs), myelocytes (MYs), metamyelocytes (MMs), band cells (BCs), and bone marrow polymorphonuclear neutrophil granulocytes. Values represent the mean ± SEM as calculated from data of the biological replicates present in the database.
Figure 10
Figure 10
Staining human neutrophils by anti-IL-17B (AF1248) antibodies (Abs). (A) Immunofluorescence (top panels) and immunohistochemistry (lower panels) staining of two FFPE cases of human pustular psoriasis using anti-IL-17B (AF1248) and CD66b Abs (as labeled). Top panels show DAPI, FITC channel, and merge to recognize neutrophil shape; lower panels show different magnification of IHC and double IHC to characterize IL-17A+ cells with the neutrophil marker CD66b. (B) Cytospins of neutrophils incubated without (top panel) or with 5 µM R848 (bottom panel) for 3 h. Original magnification 200× [first row in (A) and left image in third row, scale bar 100 µm] and 400× [second row in (A), center/right images in third row in (A), as well as in (B), scale bar 50 µm]. Images of the second row in (A) represent magnifications of images in first row. (C) AF1248 immunoblot of lysates from neutrophils either freshly isolated (T0, from two donors) or incubated for 3 h with or without 2 µg/ml IL-6 plus 0.2 µg/ml IL-23 (low), 20 µg/ml IL-6 plus 2 µg/ml IL-23 (high), or 5 µM R848. Recombinant human IL-17B (rhIL-17B) was used as positive control. Panels (B,C) display representative experiments out of two independent ones with similar results.

References

    1. Amatya N, Garg AV, Gaffen SL. IL-17 signaling: the Yin and the Yang. Trends Immunol (2017) 38(5):310–22.10.1016/j.it.2017.01.006 - DOI - PMC - PubMed
    1. Hymowitz SG, Filvaroff EH, Yin JP, Lee J, Cai L, Risser P, et al. IL-17s adopt a cystine knot fold: structure and activity of a novel cytokine, IL-17F, and implications for receptor binding. EMBO J (2001) 20(19):5332–41.10.1093/emboj/20.19.5332 - DOI - PMC - PubMed
    1. Gaffen SL, Jain R, Garg AV, Cua DJ. The IL-23-IL-17 immune axis: from mechanisms to therapeutic testing. Nat Rev Immunol (2014) 14(9):585–600.10.1038/nri3707 - DOI - PMC - PubMed
    1. Wright JF, Guo Y, Quazi A, Luxenberg DP, Bennett F, Ross JF, et al. Identification of an interleukin 17F/17A heterodimer in activated human CD4+ T cells. J Biol Chem (2007) 282(18):13447–55.10.1074/jbc.M700499200 - DOI - PubMed
    1. Veldhoen M. Interleukin 17 is a chief orchestrator of immunity. Nat Immunol (2017) 18(6):612–21.10.1038/ni.3742 - DOI - PubMed

Publication types