. 2018 Apr 6;9(26):18224-18238.
doi: 10.18632/oncotarget.24804.

Increased gut permeability in cancer cachexia: mechanisms and clinical relevance

Affiliations

Increased gut permeability in cancer cachexia: mechanisms and clinical relevance

Laure B Bindels et al. Oncotarget. .

Abstract

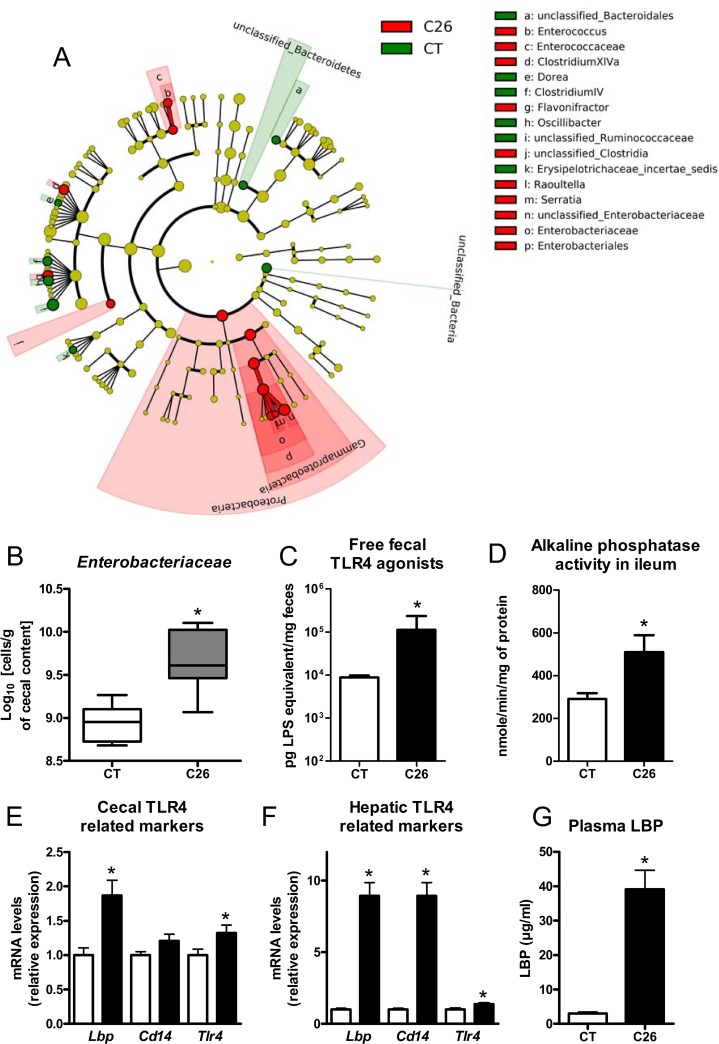
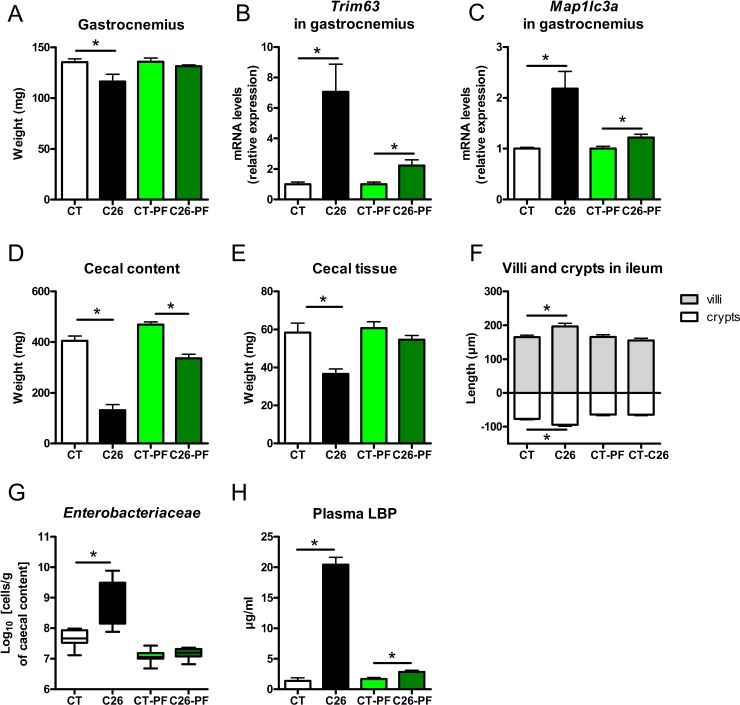
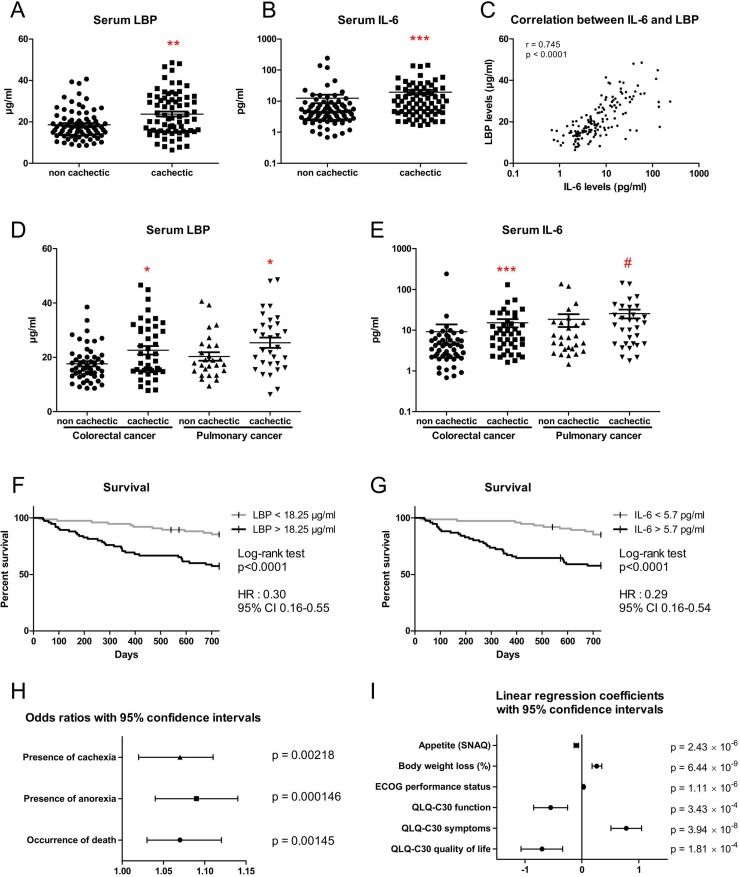
Intestinal disorders often occur in cancer patients, in association with body weight loss, and this alteration is commonly attributed to the chemotherapy. Here, using a mouse model of cancer cachexia induced by ectopic transplantation of C26 cancer cells, we discovered a profound alteration in the gut functions (gut permeability, epithelial turnover, gut immunity, microbial dysbiosis) independently of any chemotherapy. These alterations occurred independently of anorexia and were driven by interleukin 6. Gut dysfunction was found to be resistant to treatments with an anti-inflammatory bacterium (Faecalibacterium prausnitzii) or with gut peptides involved in intestinal cell renewal (teduglutide, a glucagon-like peptide 2 analogue). The translational value of our findings was evaluated in 152 colorectal and lung cancer patients with or without cachexia. The serum level of the lipopolysaccharide-binding protein, often presented as a reflection of the bacterial antigen load, was not only increased in cachectic mice and cancer patients, but also strongly correlated with the serum IL-6 level and predictive of death and cachexia occurrence in these patients. Altogether, our data highlight profound alterations of the intestinal homeostasis in cancer cachexia occurring independently of any chemotherapy and food intake reduction, with potential relevance in humans. In addition, we point out the lipopolysaccharide-binding protein as a new biomarker of cancer cachexia related to gut dysbiosis.

Keywords: Enterobacteriaceae; cancer cachexia; gut barrier function; gut dysbiosis; lipopolysaccharide-binding protein.


Conflict of interest statement

CONFLICTS OF INTEREST The authors declare that they have no competing interests.

Figures

Figure 1
Figure 1. Impact of cancer cachexia on the gastrointestinal tract
(AB) Body weight and food intake evolution. (C) Cecal content and tissue weight with representative pictures. (D) Villi length and crypt depth in ileum with representative photomicrographs of hematoxylin-eosin stained tissues. (E) Gut permeability as assessed in vivo using FITC-dextran. Mice received either a sham-injection (CT) or an injection with cancer cells (C26). n = 7–8, *p < 0.05.
Figure 2
Figure 2. Gut integrity, cell renewal and gut immunity biomarkers are decreased in cachectic mice
mRNA expression of markers involved in gut barrier integrity (Tjp1, Ocln, Muc2, Cldn2), proliferation, shedding and differentiation of epithelial and specialized cell lineages (Mki67, Lgr5, Tcf4, Klf4, intectin) and gut immunity (Cd3g, Itgax, Foxp3, Tnf, Ido1, Il15), in the jejunum (A), ileum (B) and colon (C) of sham-injected (CT) and cachectic mice (C26). n = 7–8, *p < 0.05.
Figure 3
Figure 3. Gut microbial changes and increased expression of markers related to the TLR4 pathway
(A) LEfSe cladogram in red for the taxa enriched in cachectic mice (C26) and in green for the taxa enriched in sham-injected mice (CT). (B) Cecal Enterobacteriaceae levels, as determined by qPCR. (C) Fecal activity in free TLR4 agonists. (D) Alkaline phosphatase activity. (EF) mRNA expression of markers related to the TLR4 pathway in the cecal tissue and liver. (G) Plasma LBP levels. n = 7–8, *p < 0.05.
Figure 4
Figure 4. Anorexia is not the main driver of muscle atrophy, intestinal alterations and microbial imbalance in C26 mice
(A) Gastrocnemius weight. (BC) mRNA expression of markers involved in muscle atrophy in the gastrocnemius. (DE) Cecal content and tissue weight. (F) Villi length and crypt depth in the ileum. (G) Cecal Enterobacteriaceae levels, as determined by qPCR. (H) Plasma LBP levels. Mice were either sham-injected (CT), injected with cancer cells (C26), sham-injected and pair-fed to CT mice (CT-PF) or sham-injected and pair-fed to C26 mice (C26-PF). n = 7–8, *p < 0.05. Only four values detected for LBP in the CT group.
Figure 5
Figure 5. An anti-IL-6 antibody reduces body weight loss, anorexia, gut permeability and microbial alterations
(A) Plasma IL-6 levels. (BC) Body weight and food intake evolution. (D) Gut permeability as assessed in vivo by FITC-dextran. (E) Cecal Enterobacteriaceae levels, as determined by qPCR. (F) Fecal activity in free TLR4 agonists. (G) Plasma LBP levels. (H) Principal coordinate analysis of the Morisita-Horn beta-diversity index computed based on the OTU table (adonis permutation test, R2 = 28.1, p = 0.04, meaning the group effect explains 28.1% of the variation in the dataset). Mice received either a sham-injection and a treatment with the vehicle (CT), or an injection of cancer cells and a treatment with the vehicle (C26) or an injection of cancer cells and a treatment with the anti-IL-6 antibody (anti-IL6). n = 6–8, *p < 0.05 vs CT, #p < 0.05 vs C26.
Figure 6
Figure 6. Serum LBP levels are increased in cachectic patients with colorectal cancer and lung cancer
(AB) Serum LBP and IL-6 levels in cancer patients with or without cachexia (n = 78/74 and n = 78/73, respectively). (C) Correlation between serum LBP levels and serum IL-6 levels in cancer patients with or without cachexia. (DE) Serum LBP and IL-6 levels in cancer patients with or without cachexia, stratified according to cancer type (n = 51/43/27/31 and n = 51/42/27/31, respectively). (FG) Kaplan-Meier curve showing the survival fraction in two subpopulations of patients stratified according to their LBP level (n = 76/75) or to their IL-6 level (75/75). (H) Odds ratios with 95% confidence intervals obtained from regression models with adjustment for sex, age and cancer type. (I) Coefficient values with 95% confidence intervals obtained from regression models with adjustment for sex, age and cancer type. Regression coefficients represent the mean change in the response variable for one unit of change in the predictor variable while holding other predictors in the model constant. *p < 0.05, **p < 0.01, ***p < 0.001, #p = 0.1.

References

    1. Farkas J, von Haehling S, Kalantar-Zadeh K, Morley JE, Anker SD, Lainscak M. Cachexia as a major public health problem: frequent, costly, and deadly. J Cachexia Sarcopenia Muscle. 2013;4:173–78. https://doi.org/10.1007/s13539-013-0105-y. - DOI - PMC - PubMed
    1. von Haehling S, Anker MS, Anker SD. Prevalence and clinical impact of cachexia in chronic illness in Europe, USA, and Japan: facts and numbers update 2016. J Cachexia Sarcopenia Muscle. 2016;7:507–09. https://doi.org/10.1002/jcsm.12167. - DOI - PMC - PubMed
    1. Roy S, Trinchieri G. Microbiota: a key orchestrator of cancer therapy. Nat Rev Cancer. 2017;17:271–85. https://doi.org/10.1038/nrc.2017.13. - DOI - PubMed
    1. Arends J, Bachmann P, Baracos V, Barthelemy N, Bertz H, Bozzetti F, Fearon K, Hutterer E, Isenring E, Kaasa S, Krznaric Z, Laird B, Larsson M, et al. ESPEN guidelines on nutrition in cancer patients. Clin Nutr. 2017;36:11–48. https://doi.org/10.1016/j.clnu.2016.07.015. - DOI - PubMed
    1. Argiles JM, Busquets S, Stemmler B, Lopez-Soriano FJ. Cancer cachexia: understanding the molecular basis. Nat Rev Cancer. 2014;14:754–62. https://doi.org/10.1038/nrc3829. - DOI - PubMed