. 2018 May 2;15(1):131.
doi: 10.1186/s12974-018-1175-8.

Urate inhibits microglia activation to protect neurons in an LPS-induced model of Parkinson's disease

Affiliations

Urate inhibits microglia activation to protect neurons in an LPS-induced model of Parkinson's disease

Li-Hui Bao et al. J Neuroinflammation. .

Abstract

Background: Multiple risk factors contribute to the progression of Parkinson's disease, including oxidative stress and neuroinflammation. Epidemiological studies have revealed a link between higher urate level and a lower risk of developing PD. However, the mechanistic basis for this association remains unclear. Urate protects dopaminergic neurons from cell death induced by oxidative stress. Here, we investigated a novel role of urate in microglia activation in a lipopolysaccharide (LPS)-induced PD model.

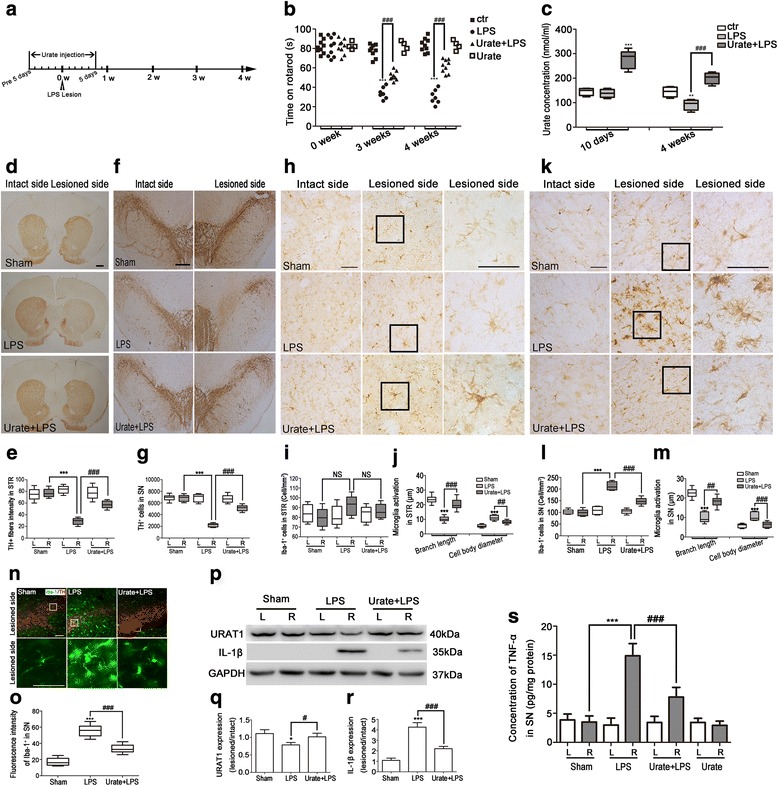
Methods: We utilized Griess, ELISA, real-time PCR, Western blot, immunohistochemistry, and immunofluorescence to detect the neuroinflammation. For Griess, ELISA, Western blot, and immunofluorescence assay, cells were seeded in 6-well plates pre-coated with poly-L-lysine (PLL) and incubated for 24 h with the indicated drugs. For real-time PCR assay, cells were seeded in 6-well plates pre-coated with PLL and incubated for 6 h with the indicated drugs. For animal experiments, rats were injected with urate or its vehicle twice daily for five consecutive days before and after stereotaxic surgery. Rats were killed and brain tissues were harvested after 4 weeks of LPS injection.

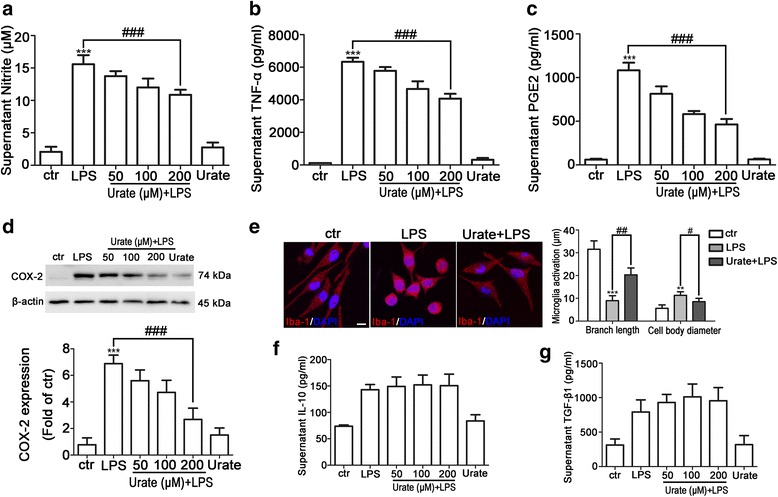
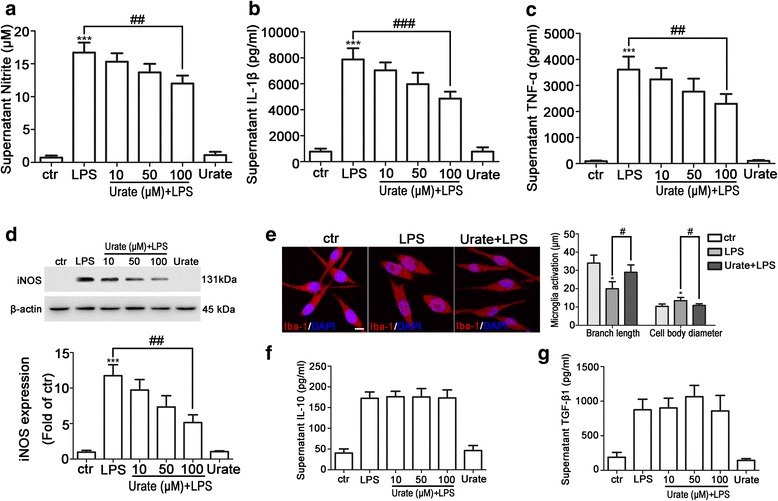
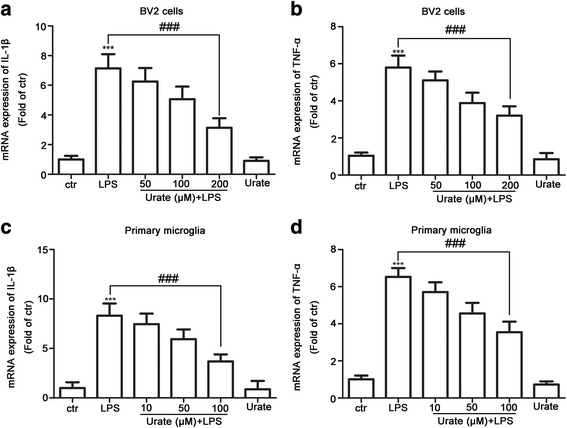
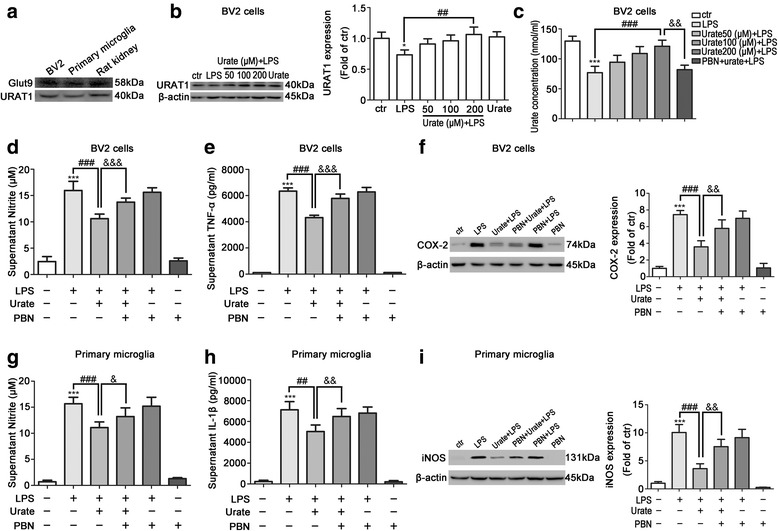
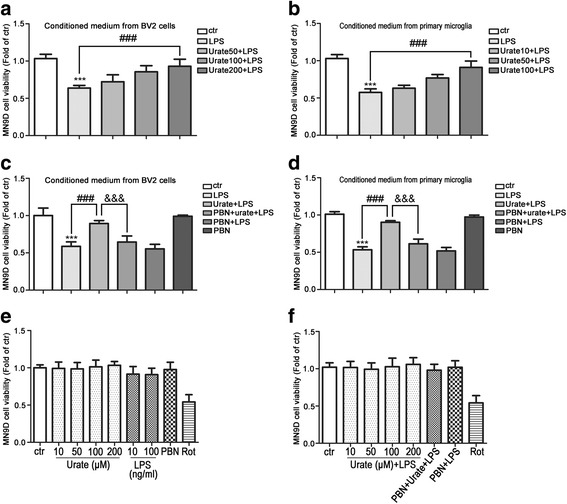
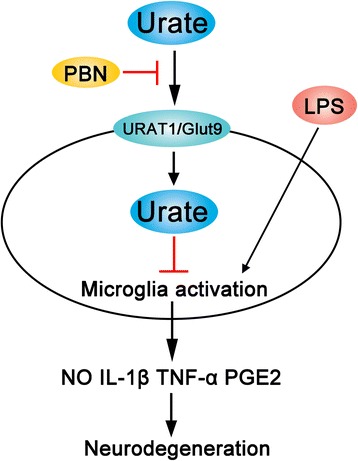
Results: In cultured BV2 cells and rat primary microglia, urate suppressed proinflammatory cytokine production and inducible cyclooxygenase 2 and nitric oxide synthase expression to protect dopaminergic neurons from the toxic effects of activated microglia. The neuroprotective effects of urate may also be associated with the stimulation of anti-inflammatory factors interleukin 10 and transforming growth factor β1. Intracellular urate level was increased in a dose-dependent manner upon co-treatment with urate and LPS as compared with LPS alone, an effect that was abrogated by pretreatment with probenecid (PBN), an inhibitor of both glucose transporter 9 and urate transporter 1 (URAT1). PBN also abolished the anti-inflammatory effect of urate. Consistent with these in vitro observations, the number of tyrosine hydroxylase-positive neurons was decreased and the loss of motor coordination was reversed by urate administration in an LPS-induced rat model of PD. Additionally, increased plasma urate level abolished the reduction of URAT1 expression, the increase in the expression of interleukin-1β, and the number of ionized calcium-binding adaptor molecule 1-positive microglia along with changes in their morphology.

Conclusions: Urate protects neurons against cytotoxicity induced by microglia activation via modulating urate transporter-mediated intracellular urate level.

Keywords: Inflammation; Microglia; Parkinson’s disease; Urate; Urate transporter.


Conflict of interest statement

Ethics approval

All animal experiments were performed in accordance with the guidelines of the Animal Care and Use Committee of Capital Medical University, Beijing, China (2006–0009), and conformed to the Guide for the Care and Use of Laboratory Animals published by the National Institutes of Health (NIH Publications No. 8023, revised 1978).

Competing interests

The authors declare that they have no competing interests.

Publisher’s Note

Springer Nature remains neutral with regard to jurisdictional claims in published maps and institutional affiliations.

Figures

Fig. 1
Fig. 1
Urate inhibits LPS-induced microglia activation in BV2 cells. ac BV2 cells were pretreated for 30 min with 50, 100, or 200 μM urate followed by 100 ng/ml LPS for 24 h; NO (a, n = 4), TNF-α (b, n = 5), and PGE2 (c, n = 3) levels in the culture supernatant were measured by ELISA. d BV2 cells were pretreated with indicated concentrations of urate and LPS, and COX-2 level was detected by Western blotting (up, n = 4). Protein band intensity was normalized to β-actin and is expressed as fold difference relative to the control group (down). e BV2 cells were pretreated with 200 μM urate followed by LPS, and microglia activation was evaluated by immunofluorescence detection of Iba-1 (red) and cell nuclei were stained with DAPI (blue) (left, n = 3). Branch length and cell body diameter were quantified with ImageJ software (right). Scale bar = 10 μm. f, g BV2 cells were pretreated for 30 min with indicated concentrations of urate followed by LPS for 24 h; IL-10 (f, n = 4) and TGF-β1 (g, n = 3) levels in the culture supernatant were measured by ELISA. Untreated cells served as the control (ctr). Data represent the mean ± SD. **p < 0.01, ***p < 0.001 vs. control group; #p < 0.05, ##p < 0.01, ###p < 0.001 vs. LPS group (one-way analysis of variance)
Fig. 2
Fig. 2
Urate inhibits LPS-induced activation of rat primary microglia. ac Primary microglia were pretreated for 30 min with 10, 50, or 100 μM urate followed by 10 ng/ml LPS for 24 h; NO (a, n = 4), IL-1β (b, n = 3), and TNF-α (c, n = 3) levels in the culture supernatant were measured by ELISA. d Primary microglia were pretreated with indicated concentrations of urate followed by LPS, and iNOS level was detected by Western blotting (up, n = 4). Protein band intensity was normalized to β-actin and is expressed as fold difference relative to the control group (down). e Primary microglia were pretreated with 100 μM urate followed by LPS, and microglia activation was evaluated by immunofluorescence detection of Iba-1 (red) and cell nuclei were stained with DAPI (blue) (left, n = 3). Branch length and cell body diameter were quantified with ImageJ software (right). Scale bar = 10 μm. f, g Primary microglia cells were pretreated for 30 min with indicated concentrations of urate followed by LPS for 24 h; IL-10 (f, n = 4) and TGF-β1 (g, n = 4) levels in the culture supernatant were measured by ELISA. Untreated cells served as a control (ctr). Data represent the mean ± SD. *p < 0.05  ***p < 0.001 vs. control group; #p < 0.05, ##p < 0.01, ###p < 0.001 vs. LPS group (one-way analysis of variance)
Fig. 3
Fig. 3
Urate suppresses proinflammatory cytokine expression in BV2 cells and rat primary microglia. ad BV2 cells (a, b; n = 4) and primary microglia (c, d; n = 4) were pretreated for 30 min with indicated concentrations of urate followed by LPS for 6 h. IL-1β and TNF-α transcription levels were analyzed by quantitative real-time PCR and normalized to that of GAPDH. Untreated cells served as a control (ctr). Data represent the mean ± SD. ***p < 0.001 vs. control group; ###p < 0.001 vs. LPS group (one-way analysis of variance)
Fig. 4
Fig. 4
Intracellular urate accumulation is required for its anti-inflammatory effect in microglia. a BV2 cells and rat primary microglia seeded in a 6-well plate were cultured for 24 h; Glut9 and URAT1 levels were evaluated by Western blotting (n = 3). Protein extract from rat kidney tissue was probed as positive control. b BV2 cells were pretreated for 30 min with indicated concentrations of urate followed by LPS treatment for 24 h. Cell lysates were probed for URAT1 using indicated specific antibodies (left, n = 3). Protein band intensity was normalized to β-actin and is expressed as fold difference relative to the control group (right). c BV2 cells were pretreated with 1000 μM PBN and urate followed by LPS. Urate concentration in cell lysates was measured with a fluorometric assay kit (n = 6). df BV2 cells were pretreated with PBN and urate followed by LPS; NO (d, n = 4) and TNF-α (e, n = 4) levels in the culture supernatant were detected by ELISA. COX-2 expression was evaluated by Western blotting relative to the level of β-actin (f, left, n = 4). Protein band intensity was normalized to β-actin and is expressed as fold difference relative to the control group (f, right). gi Rat primary microglia were pretreated with PBN and urate followed by LPS; NO (g, n = 4) and IL-1β (h, n = 3) levels in the culture supernatant were detected by ELISA. iNOS level was evaluated by Western blotting (i, left, n = 4) relative to that of β-actin and is expressed as fold difference relative to control group (i, right). Untreated cells served as the control (ctr). Data represent the mean ± SD. *p < 0.05, ***p < 0.001 vs. control group; ##p < 0.01, ###p < 0.001 vs. LPS group; &p < 0.05, &&p < 0.01, &&&p < 0.001 vs. urate+LPS group (one-way analysis of variance)
Fig. 5
Fig. 5
Urate protects DA neurons from neurotoxicity induced by microglia activation. a, b MN9D cells were incubated for 24 h with conditioned medium from cultures of BV2 cells (a, n = 4) or rat primary microglia (b, n = 4) treated with urate plus LPS. Cell viability was measured with the MTS assay. c, d MN9D cells were incubated for 24 h with conditioned medium derived from cultures of BV2 cells (c, n = 4) or rat primary microglia (d, n = 4) treated with LPS, urate+LPS, or PBN+urate+LPS. Cell viability was evaluated with the MTS assay. e, f MN9D cells were treated with indicated drugs for 24 h, and cell viability was evaluated with the MTS assay (n = 3). Rotenone (Rot, 0.5 μM) was used as positive control. Medium from cultures of untreated microglia served as a control (ctr). Data represent the mean ± SD. ***p < 0.001 vs. control group; ###p < 0.001 vs. LPS group; &&&p < 0.001 vs. urate+LPS group (one-way analysis of variance)
Fig. 6
Fig. 6
Urate suppresses neuroinflammation induced by activated microglia in a rat model of LPS-induced PD. a Schematic illustration of the schedule for urate and LPS administration. b Motor coordination was evaluated with the rotarod test at 0, 3, and 4 weeks after LPS injection (n = 4–9/group). c Plasma concentration of urate was assessed with a fluorometric assay (n = 4–9/group). dg Representative images of TH immunoreactivity in the STR (d, n = 4–5/group, scale bar = 1000 μm) and SN (f, n = 4–5/group, scale bar = 500 μm). Quantitative analysis of TH-positive fibers in STR shown as the intensity of intact side (left, L) and lesioned side (right, R) (e). Quantitative analysis of TH-positive cells in SN, shown as the number of TH-positive cells in intact side and lesioned side (g). hm Representative images of Iba-1 immunoreactivity in the STR (h, n = 4–5/group, scale bar = 50 μm) and SN (k, n = 4–5/group, scale bar = 50 μm). Quantitative analysis of Iba-1-positive cells in STR (i) and SN (l), shown as the number of cells per square millimeter in intact side and lesioned side, respectively. Quantitative analysis of branch length and cell body diameter of Iba-1-positive cells, shown as the absolute of branch length and cell body diameter lesioned side in STR (j) and SN (m). n, o Representative images of immunofluorescence analysis of TH-positive (red) and Iba-1-positive (green) cells in the lesioned side of SN (n, n = 4–5/group, scale bar = 100 μm). Quantitative analysis of fluorescence intensity of Iba-1-positive cells in lesioned side (o). Quantification of TH-positive cells in SN was counted by sterology using Stereo Investigator software. TH-positive fibers in STR and Iba-1 positive cells in the STR and SN were performed using Image Pro Plus v5.0 image analysis software. pr Protein expression in SN was assessed in animals subjected to the indicated treatments (n = 4–5/group). Tissue lysates were analyzed for expression of URAT1 and IL-1β by Western blotting (p). The levels were normalized to GAPDH and quantified as the ratio of the lesioned side to the intact side (q, r). s Tissue lysates were prepared and TNF-α concentration of SN was assessed by ELISA (n = 4–5/group). Rats injected with vehicle served as the sham. Data represent the mean ± SD. *p < 0.05, **p < 0.01, ***p < 0.001 vs. sham group; #p < 0.05, ##p < 0.01, ###p < 0.001 vs. LPS group (one-way analysis of variance)
Fig. 7
Fig. 7
Schematic illustration of the suppression of microglia activation and neuroinflammation by urate in an LPS-induced model of PD. High intracellular levels of urate in microglia protect DA neurons by inhibiting the release of proinflammatory factors

References

    1. McGeer PL, Itagaki S, Akiyama H, McGeer EG. Rate of cell death in parkinsonism indicates active neuropathological process. Ann Neurol. 1988;24:574–576. doi: 10.1002/ana.410240415. - DOI - PubMed
    1. Nagatsu T, Mogi M, Ichinose H, Togari A. Cytokines in Parkinson’s disease. J Neural Transm Supp. 2000;58:143–151. - PubMed
    1. Mogi M, Harada M, Kondo T, Riederer P, Inagaki H, Minami M, Nagatsu T. Interleukin-1β, interleukin-6, epidermal growth factor and transforming growth factor-α are elevated in the brain from parkinsonian patients. Neurosci Lett. 1994;180:147–150. doi: 10.1016/0304-3940(94)90508-8. - DOI - PubMed
    1. Herrera AJ, Tomás-Camardiel M, Venero JL, Cano J, Machado A. Inflammatory process as a determinant factor for the degeneration of substantia nigra dopaminergic neurons. J Neural Transm. 2005;112:111–119. doi: 10.1007/s00702-004-0121-3. - DOI - PubMed
    1. Machado A, Herrera AJ, Venero JL, Santiago M, De PRM, Villarán RF, Espinosa-Oliva AM, Argüelles S, Sarmiento M, Delgado-Cortés MJ. Inflammatory animal model for Parkinson’s disease: the intranigral injection of LPS induced the inflammatory process along with the selective degeneration of nigrostriatal dopaminergic neurons. ISRN Neurol. 2011; 10.5402/2011/476158. - PMC - PubMed

MeSH terms