

A meta-analysis of the prevalence of African animal trypanosomiasis in Nigeria from 1960 to 2017
- PMID: 29720251
- PMCID: PMC5930763
- DOI: 10.1186/s13071-018-2801-0
A meta-analysis of the prevalence of African animal trypanosomiasis in Nigeria from 1960 to 2017
Abstract
Background: African animal trypanosomiasis is an economically significant disease that affects the livestock industry in Nigeria. It is caused by several parasites of the genus Trypanosoma. National estimates of the disease prevalence in livestock and tsetse flies are lacking, therefore a systematic review and meta-analysis were performed to understand the trend of the disease prevalence over the years.
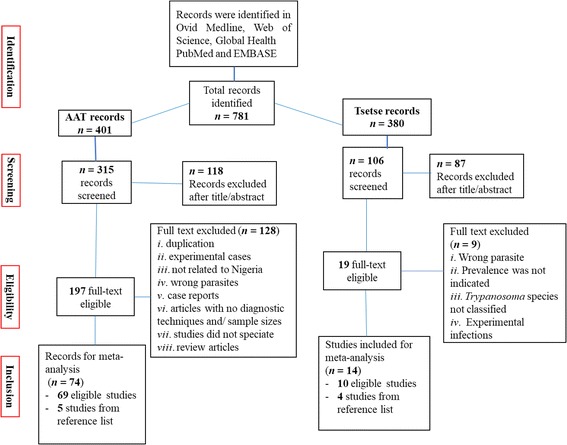
Methods: Publications were screened in Web of Science, Ovid MEDLINE, Global Health, EMBASE and PubMed databases. Using four-stage (identification, screening, eligibility and inclusion) process in the PRIMSA checklist, only studies that met the inclusion criteria for AAT and tsetse infections were analysed. Point estimates prevalence and subgroup analyses based on diagnostic techniques in livestock were evaluated at 95% confidence interval (CI).
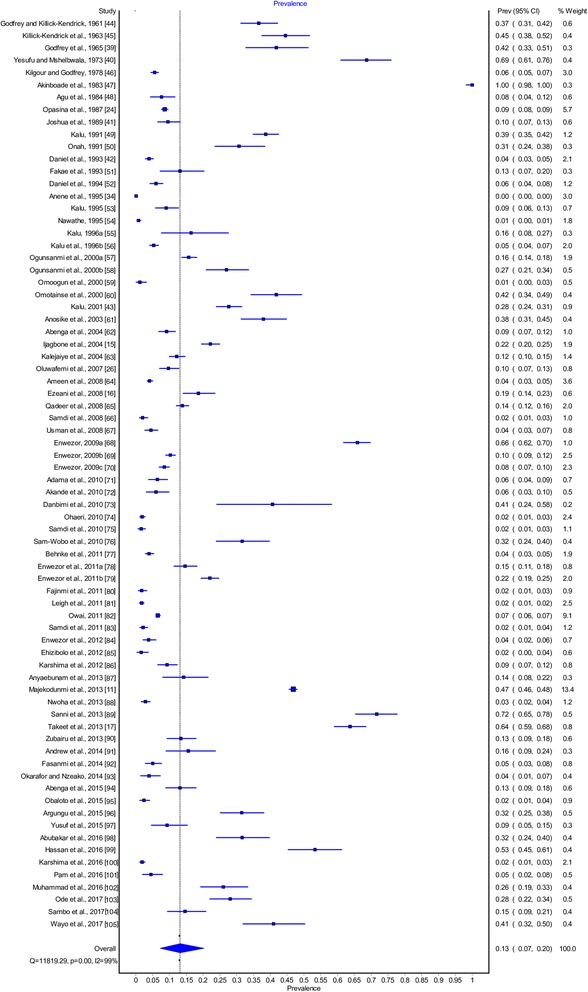
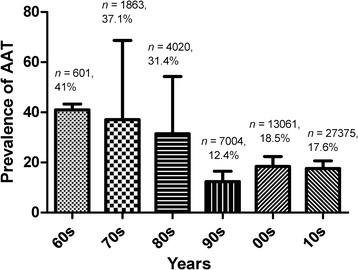
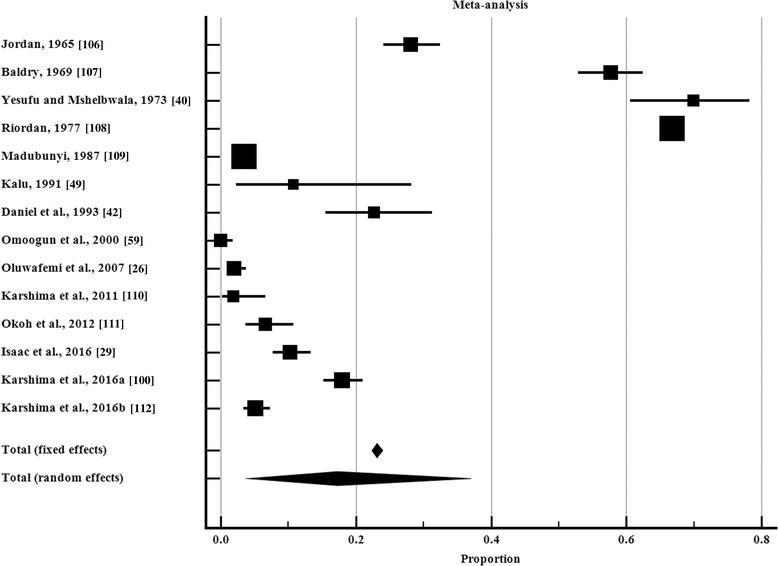
Results: A total of 74 eligible studies published between 1960 and 2017 were selected for meta-analysis. This covers the six geopolitical zones, involving a total of 53,924 animals. The overall prevalence of AAT was 16.1% (95% CI: 12.3-20.3%). Based on diagnostic techniques, the prevalence of AAT in cattle was highest in PCR followed by serology and microscopy while the highest prevalence in pigs was observed with serology. Out of 12,552 tsetse flies examined from 14 eligible studies, an overall prevalence of 17.3% (95% CI: 4.5-36.0%) and subgroup prevalence of 49.7% (95% CI: 30.7-68.8%), 11.5% (95% CI: 6.1-18.5) and 4.5% (95% CI: 1.8-8.8%) in G. morsitans, G. tachinoides and G. palpalis, respectively, were observed using the random effects-model.
Conclusions: The prevalence of trypanosomes in both vectors and animal hosts was high in Nigeria. Therefore, further research on risk factors, seasonal and transhumance effects, vectoral capacity and competence are warranted for an effective control of AAT in Nigeria.
Keywords: Livestock; Nigeria; Prevalence; Trypanosomes; Tsetse.
Conflict of interest statement
Ethics approval
The study was conducted with the permission of the University of Ibadan Animal Ethics Committee (UI-ACUREC/App/12/2016/05) and in line with the guidelines of the committee.
Consent for publication
Not applicable.
Competing interests
The authors declare that they have no competing interests.
Publisher’s Note
Springer Nature remains neutral with regard to jurisdictional claims in published maps and institutional affiliations.
Figures
Similar articles
-
Occurrence of trypanosome infections in cattle in relation to season, livestock movement and management practices of Maasai pastoralists in Northern Tanzania.Vet Parasitol Reg Stud Reports. 2018 May;12:91-98. doi: 10.1016/j.vprsr.2018.02.007. Epub 2018 Feb 22. Vet Parasitol Reg Stud Reports. 2018. PMID: 31014817
-
African Animal Trypanosomiasis: A Systematic Review on Prevalence, Risk Factors and Drug Resistance in Sub-Saharan Africa.J Med Entomol. 2022 Jul 13;59(4):1099-1143. doi: 10.1093/jme/tjac018. J Med Entomol. 2022. PMID: 35579072
-
A national atlas of tsetse and African animal trypanosomosis in Mali.Parasit Vectors. 2019 Oct 9;12(1):466. doi: 10.1186/s13071-019-3721-3. Parasit Vectors. 2019. PMID: 31597558 Free PMC article.
-
Bovine and small ruminant African animal trypanosomiasis in Nigeria - A review.Vet Parasitol Reg Stud Reports. 2018 Aug;13:5-13. doi: 10.1016/j.vprsr.2018.03.001. Epub 2018 Mar 15. Vet Parasitol Reg Stud Reports. 2018. PMID: 31014888 Review.
-
The continental atlas of tsetse and African animal trypanosomosis in Nigeria.Acta Trop. 2020 Apr;204:105328. doi: 10.1016/j.actatropica.2020.105328. Epub 2020 Jan 2. Acta Trop. 2020. PMID: 31904345
Cited by
-
Zoo-Sanitary Situation Assessment, an Initial Step in Country Disease Prioritization Process: Systematic Review and Meta-Analysis from 2000 to 2020 in Cameroon.Pathogens. 2023 Aug 24;12(9):1076. doi: 10.3390/pathogens12091076. Pathogens. 2023. PMID: 37764884 Free PMC article. Review.
-
Computational Network Analysis Identifies Evolutionarily Conserved miRNA Gene Interactions Potentially Regulating Immune Response in Bovine Trypanosomosis.Front Microbiol. 2019 Aug 28;10:2010. doi: 10.3389/fmicb.2019.02010. eCollection 2019. Front Microbiol. 2019. PMID: 31555241 Free PMC article.
-
Mathematical modelling and control of African animal trypanosomosis with interacting populations in West Africa-Could biting flies be important in main taining the disease endemicity?PLoS One. 2020 Nov 20;15(11):e0242435. doi: 10.1371/journal.pone.0242435. eCollection 2020. PLoS One. 2020. PMID: 33216770 Free PMC article.
-
Prevalence of trypanosomes associated with drug resistance in Shimba Hills, Kwale County, Kenya.BMC Res Notes. 2020 Apr 29;13(1):234. doi: 10.1186/s13104-020-05077-3. BMC Res Notes. 2020. PMID: 32349785 Free PMC article.
-
Molecular identification and prevalence of trypanosomes in cattle distributed within the Jebba axis of the River Niger, Kwara state, Nigeria.Parasit Vectors. 2021 Oct 29;14(1):560. doi: 10.1186/s13071-021-05054-0. Parasit Vectors. 2021. PMID: 34715895 Free PMC article.
References
-
- Swallow BM. PAAT Technical and Scientific Series 2, PAAT Information Service Publication. Rome: FAO; 2000. Impacts of trypanosomiasis on African agriculture; p. 52.
Publication types
MeSH terms
LinkOut - more resources
Full Text Sources
Other Literature Sources
Research Materials
Miscellaneous
