. 2018 Jun 15;293(24):9277-9291.
doi: 10.1074/jbc.RA117.001507. Epub 2018 May 2.

Interferon regulatory factor 1 and a variant of heterogeneous nuclear ribonucleoprotein L coordinately silence the gene for adhesion protein CEACAM1

Affiliations

Interferon regulatory factor 1 and a variant of heterogeneous nuclear ribonucleoprotein L coordinately silence the gene for adhesion protein CEACAM1

Kenneth J Dery et al. J Biol Chem. .

Abstract

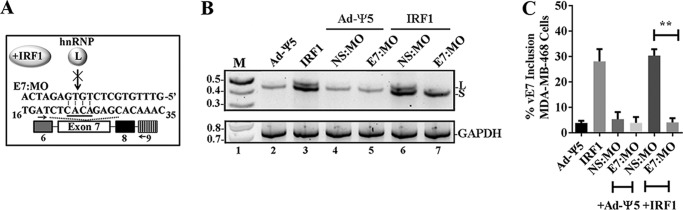
The adhesion protein carcinoembryonic antigen-related cell adhesion molecule 1 (CEACAM1) is widely expressed in epithelial cells as a short cytoplasmic isoform (S-iso) and in leukocytes as a long cytoplasmic isoform (L-iso) and is frequently silenced in cancer by unknown mechanisms. Previously, we reported that interferon response factor 1 (IRF1) biases alternative splicing (AS) to include the variable exon 7 (E7) in CEACAM1, generating long cytoplasmic isoforms. We now show that IRF1 and a variant of heterogeneous nuclear ribonucleoprotein L (Lv1) coordinately silence the CEACAM1 gene. RNAi-mediated Lv1 depletion in IRF1-treated HeLa and melanoma cells induced significant CEACAM1 protein expression, reversed by ectopic Lv1 expression. The Lv1-mediated CEACAM1 repression resided in residues Gly71-Gly89 and Ala38-Gly89 in Lv1's N-terminal extension. ChIP analysis of IRF1- and FLAG-tagged Lv1-treated HeLa cells and global treatment with the global epigenetic modifiers 5-aza-2'-deoxycytidine and trichostatin A indicated that IRF1 and Lv1 together induce chromatin remodeling, restricting IRF1 access to the CEACAM1 promoter. In interferon γ-treated HeLa cells, the transcription factor SP1 did not associate with the CEACAM1 promoter, but binding by upstream transcription factor 1 (USF1), a known CEACAM1 regulator, was greatly enhanced. ChIP-sequencing revealed that Lv1 overexpression in IRF1-treated cells induces transcriptional silencing across many genes, including DCC (deleted in colorectal carcinoma), associated with CEACAM5 in colon cancer. Notably, IRF1, but not IRF3 and IRF7, affected CEACAM1 expression via translational repression. We conclude that IRF1 and Lv1 coordinately regulate CEACAM1 transcription, alternative splicing, and translation and may significantly contribute to CEACAM1 silencing in cancer.

Keywords: CEACAM1; IFN-gamma; IRF1; RNA; alternative splicing; chromatin remodeling; hnRNP L; transcription; translation regulation.


Conflict of interest statement

The authors declare that they have no conflicts of interest with the contents of this article.

Figures

Figure 1.
Figure 1.
IRF1 requires exon 7 (E7) as a binding platform for L-iso AS. A, schematic diagram of the reporter constructs: pZsG V lacks a promoter to drive GFP expression, CAM1p (6–7-8) contains 1135 nucleotides of the CEACAM1 genomic promoter sequence (p) fused in translational reading frame to a minigene containing exons 6–7-8 (introns included) and GFP, as a reporter for L-iso expression. Construct CAM1p (6-rc7–8) is similar but contains a reverse complement E7 sequence in place of the WT sequence. Primers for CEACAM1 RT-PCR recognize the pZsG V backbone and E8 of CEACAM1 as shown. B, analysis of RNAs derived from HeLa cells transfected with the indicated reporter GFP constructs in the presence or absence of IRF1. RT-PCR of CEACAM1 (upper) and GAPDH (lower) was used as a loading control. The mean percent E7 inclusion was calculated as (% L-iso mRNA/(L-iso + S-iso) mRNAs) and is shown below the panel, as described previously (14). **, p < 0.01, CAM1p (6-rc7–8) versus CAM1p (6–7-8). C–E, parallel samples were analyzed for GFP expression by flow cytometry (C and D), with the key shown above, and quantitated in E, by measuring the percent of cells expressing GFP and expressed as mean fluorescent intensity. **, p < 0.01, CAM1p (6-rc7–8) versus CAM1p (6–7-8). Ad-Ψ5 is the Ad-null empty vector control. Number of replicates for B–D were at least n = 3. Error bars, S.D.
Figure 2.
Figure 2.
Morpholino targeting the hnRNP L–binding site on E7 disrupts IRF1-directed AS. A, schematic diagram of hnRNP L inhibition by antisense MO targeting E7 nt 16–35 (E7:MO) in the presence or absence of IRF1. The nt 22CACA25 (underline) is the consensus binding site of hnRNP L (14) predicted for E7. Primers denoted for CEACAM1 RT-PCR recognize E6 and E9. B, RT-PCR analysis of RNAs derived from MDA-MB-468 cells in the presence or absence of IRF1 and/or MO treatment (upper). RT-PCR of GAPDH (lower) was used as a loading control. NS:MO is the nonspecific control. C, quantitation of the mean percent E7 inclusion was calculated as described in Fig. 1. **, p < 0.01, E7:MO versus NS:MO. Ad-Ψ5 is the Ad-null empty vector control. Experiments were repeated in triplicate. Error bars, S.D.
Figure 3.
Figure 3.
RNAi to hnRNP L variant 1 (Lv1) with IRF1 up-regulates CEACAM1. A, representative Western blotting of proteins isolated from IRF1-induced HeLa cells treated with siRNAs directed to the total hnRNP L population (via exon 8) versus exon 1 of Lv1. Samples separated by a border were analyzed on the same Western blot. siRNAs to GAPDH were included as a control for RNAi. Equal protein amounts (50 μg) from protein lysates were loaded on each lane. B, quantitation of total hnRNP L present. Samples were normalized to the siScram + IRF1 control sample. **, p < 0.01, sihnRNP L versus siScram in the presence of IRF1. C, quantitation of levels of CEACAM1. Samples were normalized to the siScram + IRF1 control sample. **, p < 0.01, sihnRNP L versus siScram all in the presence of IRF1. D and E, RT-PCR analysis of RNAs derived from parallel samples from A, lanes 2, 3, and 5 (D) and quantitated in E as described in Fig. 1. **, p < 0.01, sihnRNP L versus siScram all in the presence of IRF1. F, schematic figure showing genomic organization of hnRNP L variants 1, 2, and 3 (Lv1, Lv2, and Lv3) on chromosome 19 according to UCSC Genome browser (68) (http://genome.ucsc.edu) and Ensembl Genome browser (69) (http://www.ensembl.org) (Please note that the JBC is not responsible for the long-term archiving and maintenance of this site or any other third party hosted site). Numbered boxes and lines represent exons and introns. Black boxes denote translated sequence and gray boxes represent untranslated sequences. The unique first exon of each variant is shown. ATG represents the translation initiation codon. Position of siRNAs used in A and D are shown. G, quantitation of levels of Lv1 only. Samples were normalized to siScram + IRF1. ****, p < 0.0001, siLv1.E1 and sihnRNP L versus siScram all in the presence of IRF1. H, quantitation of levels of CEACAM1. Samples were normalized to the siScram + IRF1 control sample. **, p < 0.01, siLv1.E1 versus siScram all in the presence of IRF1. Ad-Ψ5 is the Ad-null empty vector control. Number of replicates for A and D were a minimum of three. Error bars, S.D.
Figure 4.
Figure 4.
Overexpression of Lv1-F and IRF1 induces marked down-regulation of CEACAM1 protein expression. A, a C-terminal 3×FLAG-tagged Lv1 construct (Lv1-F) or vector control was introduced into HeLa cells and a stable clone of each was obtained. Cell lysates were subjected to Western blotting and probed using polyclonal DDDDK FLAG tag antibody or anti-GAPDH as a loading control. The position of each is shown on the right of the figure. B, cell lysates from HeLa cells expressing vector or Lv1-F with various treatments were subjected to Western blot analysis using antibodies to CEACAM1-L (229) or GAPDH. The % CEACAM1 was quantitated by comparing Lv1-F to vector in IRF1-treated cells and is shown below ****, p < 0.0001. C, amino acid sequence of N-terminal domain deletion constructs of Lv1 corresponding to residues Gly71–Gly89 or Ala38–Gly89. D, Western blots of cell lysates from HeLa cells expressing Lv1 or derivative deletion constructs probed using antibodies to DDDDK FLAG tag, hnRNP L, or GAPDH as a loading control. E, parallel samples of D were subjected to Western blotting and probed using antibodies to CEACAM1 (T84.1) or β-actin. A control lysate expressing CEACAM1 S-iso in MCF7 cells was used as CEACAM1 migration control. Antibody T84.1 also recognizes CEACAM5 (180 kDa) that is endogenously expressed in MCF7 cells. F, samples from E were quantitated where CEACAM1 was normalized to Lv1 + IRF1 protein levels. ***, p < 0.001, ΔGly71–Gly89 or ΔAla38–Gly89 both in the presence of IRF1 versus Lv1-F + IRF1. Equal protein amounts (50 μg) from protein lysates were loaded on each lane in B and E. For A and D, 20 μg were equally loaded into each lane. Numbers of replicates for A and B and D and E were a minimum of three. Error bars, S.D.
Figure 5.
Figure 5.
Epigenetic changes in the chromatin landscape regulate CEACAM1 expression. A, HeLa cells expressing vector or Lv1-F in the presence or absence of IRF1 were subjected to Western blot analysis using antibodies to the DDDDK FLAG tag, H3K36me3, DNMT1, H4AcK8, or α-tubulin as a loading control. Treatment of HeLa cells with epigenetic modifiers DAC or TSA are indicated. The asterisk indicates presence of nonspecific interactions. B, samples from A were quantitated where H3K36me3 was normalized to vector + IRF1–treated cells. C, Western blotting of parallel samples shown in A were probed with antibodies to CEACAM1 or α-tubulin. ***, p < 0.001 IRF1-treated Lv1-F cells in the presence of DAC, TSA treatment versus Lv1-F cells in the presence of IRF1 alone. D, Western blotting of HeLa cells overexpressing Lv1-F and transcription factor USF1. Antibodies to the DDDDK FLAG tag, USF1, H3K36me3, or α-tubulin as a loading control. Equal protein amounts (50 μg) from protein lysates were loaded on each lane. Replicates for A and C were n = 3 and for D were n = 2. Error bars, S.D.
Figure 6.
Figure 6.
Coordination of Lv1 with IRF1 mediates changes in chromatin of multiple promoters including CEACAM1. A, schematic diagram of the chromatin accessibility assay adapted from (67) using micrococcal nuclease (+MNase) near transcription factors (TF) with IRF1 as an example. DNA fragments generated are expected to produce the data signal obtained in areas rich in nucleosomes. B, nucleosome profile relative to TSS in 10-bp resolution. C, peak enrichment comparison between vector + IRF1 versus Lv1-F + IRF1 at the IRF1 locus (upper) and CEACAM1 locus (lower). D, validation of target DCC by treating MCF7 cells with and without Lv1-F and IRF1. Cell lysates were subjected to Western blotting and probed using antibodies to hnRNP L, GAPDH, and DCC. E, samples from D were quantitated where DCC was normalized to vector + IRF1 protein levels. *, p < 0.05, Lv1 versus vector both in the presence of IRF1. Experiments were repeated in triplicate. Equal protein amounts (50 μg) from protein lysates were loaded on each lane. F–H, MNase ChIP was performed in HeLa cells using antibodies directed to IRF1 (F), SP1 (G), or USF1 (H) expressing vector or Lv1-F with and without treatment with IRF1 or IFN-γ. Quantitative PCR was conducted using primers specific for the CEACAM1 ISRE or USF1 binding locus as shown on the y axis. Bar graphs represent the mean relative enrichment values (± S.D.) of three independent experiments. *, p < 0.05; **, p < 0.01; ***, p < 0.001 Lv1-F versus vector control for each treatment.
Figure 7.
Figure 7.
IRF3 and IRF7 like IRF1 bias AS toward exon inclusion. A, HeLa cells were infected with adenoviruses expressing mIRF1 (murine), IRF3, IRF7, IRF9, or control Ad-Ψ5 and harvested after 24 h treatments. Total cell lysates were analyzed by Western blotting using antibodies to each IRF and α-tubulin was used as a loading control. STAT1 was included as a downstream effector control. B, RT-PCR analysis of total RNA isolated from IRF-induced cells using primers CEACAM1 or GAPDH. Primers to detect CEACAM1–4ecto and CEACAM1–3ecto mRNA isoforms have been described elsewhere (65). Asterisks (* and **) indicate the presence of uncharacterized mRNA species. C, Western blot analysis of total protein isolated from IRF-induced cells using antibodies to CEACAM1 or α-tubulin. The asterisk indicates the presence of nonspecific interactions. D, samples from C were quantitated where normalized CEACAM1 levels were compared with control Ad-Ψ5 treatment. *, p < 0.05, IRF3 versus Ad-Ψ5, * p < 0.05, IRF1 versus Ad-Ψ5. E, HeLa cells were infected with adenoviruses expressing IRF1, IRF3, or IRF7 versus control Ad-Ψ5 in the presence or absence of Lv1-F and total cell lysates were probed for CEACAM1 expression or β-actin by Western blotting. F, samples from E were quantitated where normalized CEACAM1 levels were compared with control Ad-Ψ5. ***, p < 0.001, Lv1-F + IRF1 versus IRF1 treated cells alone. A control lysate expressing CEACAM1 S-iso in MCF7 cells was used as CEACAM1 migration control. Equal protein amounts from protein lysates were loaded on each lane, 25 μg for A and 50 μg for C and E. Ad-Ψ5 is the Ad-null empty vector control. Number of replicates for A–E were n = 2. Error bars, S.D.
Figure 8.
Figure 8.
Model of the role of Lv1 and IRF1 in regulating CEACAM1 in inflammation and cancer. A, E7 acts as a binding platform to place IRF1 in trans in close proximity to RNA splicing regulators of the AS pathway. Shown is Lv1 association with the spliceosome and factors in the transcriptosome, including IRF1, SP1, and USF1. B, relationship between IRF1, Lv1, and CEACAM1 phenotype in normal, conditions of inflammation, and cancer. Acute inflammation causes IRF1 to express the L-iso of CEACAM1, and its expression causes a resolution to revert to S-iso in normal conditions. Chronic inflammatory conditions in cancer causes high expression of both IRF1 and Lv1 leading to global gene silencing. Low and High refer to expression level.

References

    1. Chao, C. H., Chen, C. M., Cheng, P. L., Shih, J. W., Tsou, A. P., and Lee, Y. H. (2006) DDX3, a DEAD box RNA helicase with tumor growth-suppressive property and transcriptional regulation activity of the p21waf1/cip1 promoter, is a candidate tumor suppressor. Cancer Res. 66, 6579–6588 10.1158/0008-5472.CAN-05-2415 - DOI - PubMed
    1. Luco, R. F., Allo, M., Schor, I. E., Kornblihtt, A. R., and Misteli, T. (2011) Epigenetics in alternative pre-mRNA splicing. Cell 144, 16–26 10.1016/j.cell.2010.11.056 - DOI - PMC - PubMed
    1. Bieberstein, N. I., Kozáková, E., Huranová, M., Thakur, P. K., Krchňáková, Z., Krausová, M., Carrillo Oesterreich, F., and Staněk, D. (2016) TALE-directed local modulation of H3K9 methylation shapes exon recognition. Sci. Rep. 6, 29961 10.1038/srep29961 - DOI - PMC - PubMed
    1. Simon, J. M., Hacker, K. E., Singh, D., Brannon, A. R., Parker, J. S., Weiser, M., Ho, T. H., Kuan, P. F., Jonasch, E., Furey, T. S., Prins, J. F., Lieb, J. D., Rathmell, W. K., and Davis, I. J. (2014) Variation in chromatin accessibility in human kidney cancer links H3K36 methyltransferase loss with widespread RNA processing defects. Genome Res. 24, 241–250 10.1101/gr.158253.113 - DOI - PMC - PubMed
    1. Robertson, K. D. (2002) DNA methylation and chromatin-unraveling the tangled web. Oncogene 21, 5361–5379 10.1038/sj.onc.1205609 - DOI - PubMed