. 2018 May 15;115(20):E4651-E4660.
doi: 10.1073/pnas.1720409115. Epub 2018 May 2.

Metabolic control of T cell immune response through glycans in inflammatory bowel disease

Affiliations

Metabolic control of T cell immune response through glycans in inflammatory bowel disease

Ana M Dias et al. Proc Natl Acad Sci U S A. .

Abstract

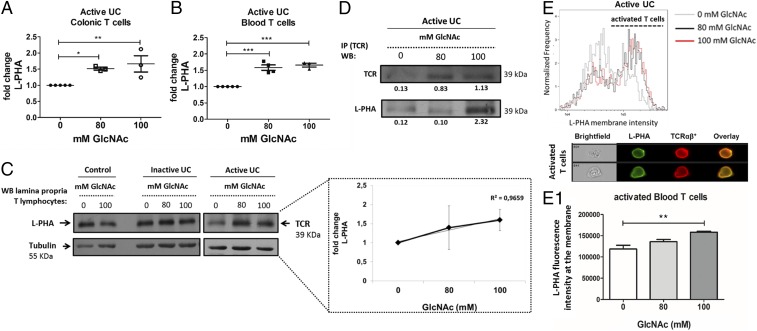
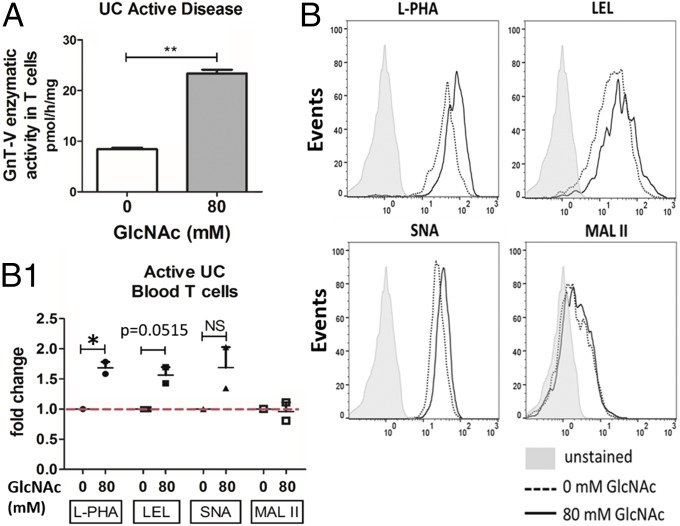
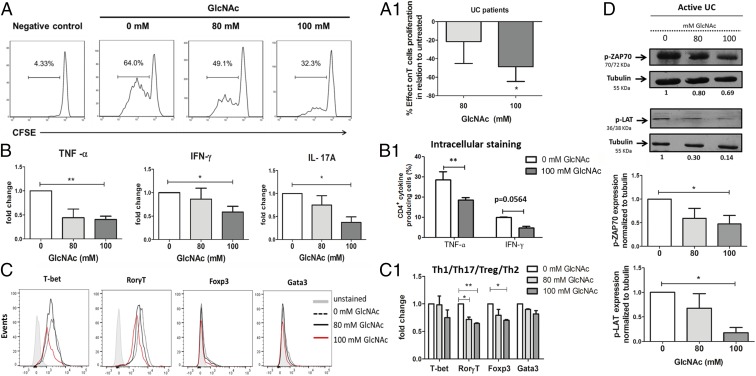
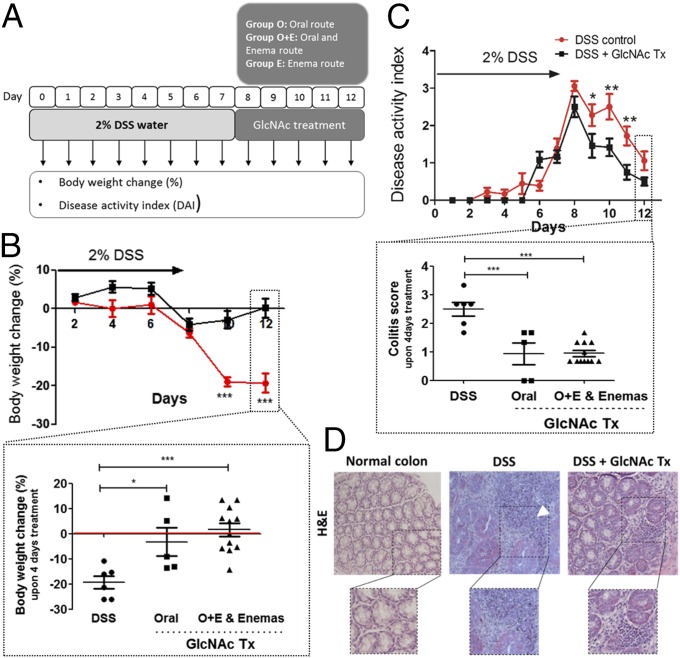
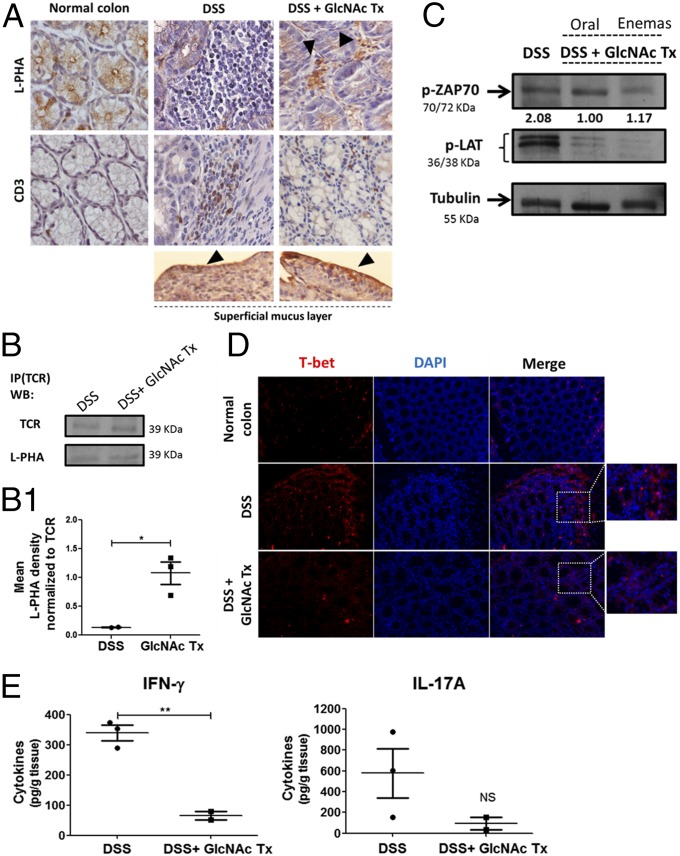
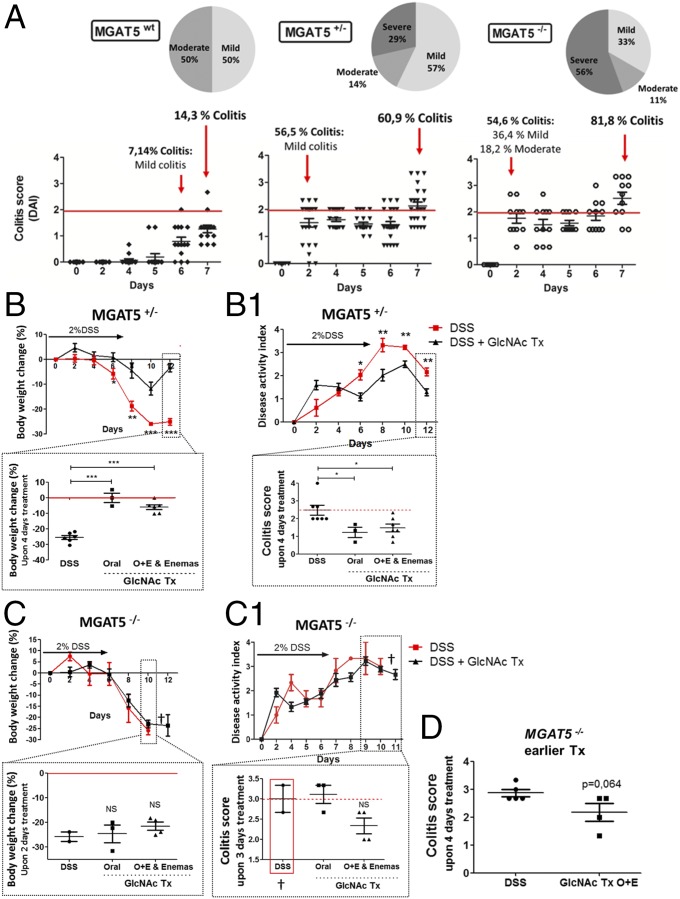
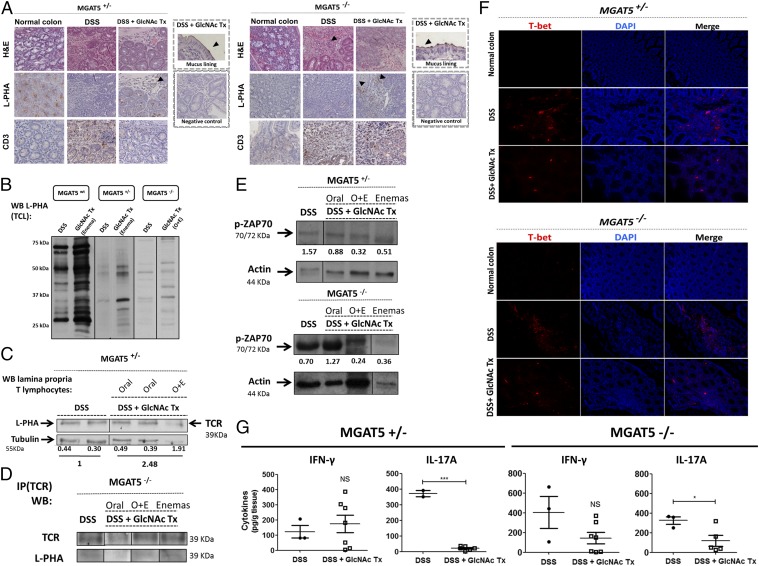
Mucosal T lymphocytes from patients with ulcerative colitis (UC) were previously shown to display a deficiency in branched N-glycosylation associated with disease severity. However, whether this glycosylation pathway shapes the course of the T cell response constituting a targeted-specific mechanism in UC remains largely unknown. In this study, we demonstrated that metabolic supplementation of ex vivo mucosal T cells from patients with active UC with N-acetylglucosamine (GlcNAc) resulted in enhancement of branched N-glycosylation in the T cell receptor (TCR), leading to suppression of T cell growth, inhibition of the T helper 1 (Th1)/Th17 immune response, and controlled T cell activity. We further demonstrated that mouse models displaying a deficiency in the branched N-glycosylation pathway (MGAT5-/-, MGAT5+/-) exhibited increased susceptibility to severe forms of colitis and early-onset disease. Importantly, the treatment of these mice with GlcNAc reduced disease severity and suppressed disease progression due to a controlled T cell-mediated immune response at the intestinal mucosa. In conclusion, our human ex vivo and preclinical results demonstrate the targeted-specific immunomodulatory properties of this simple glycan, proposing a therapeutic approach for patients with UC.

Keywords: T cell receptor; T lymphocytes; adaptive immune response; branched N-glycosylation; intestinal inflammation.


Conflict of interest statement

The authors declare no conflict of interest.

Figures

Fig. 1.
Fig. 1.
Ex vivo GlcNAc supplementation of T cells from patients with UC resulted in increased branching N-glycans. (A and B) CD3+ T cells from patients with active UC were cultured with different concentrations (millimolar) of GlcNAc, and the fold change of mean fluorescence intensity due to L-PHA staining was determined by flow cytometry. The scatter plots illustrate the mean ± SEM of five biological replicates. One-way ANOVA using the Newman–Keuls multiple comparison posttest: *P ≤ 0.05; **P ≤ 0.01; ***P ≤ 0.001. (C) Protein lysates of purified CD3+ T cells under GlcNAc treatment were subjected to L-PHA lectin blotting to evaluate the expression levels of β1,6-GlcNAc branched N-glycans on a protein band corresponding to the migration profile of the TCRβ. WB, Western blot. (Inset) Linear regression using mean values per treatment condition. (D) Immunoprecipitation (IP) of TCR followed by β1,6-GlcNAc branched N-glycan recognition with L-PHA. The density of bands is indicated below each band. (E) Imaging flow cytometry analysis (on an ImageStreamX) of L-PHA membrane distribution on TCR+ cells after GlcNAc supplementation in T cells isolated from blood of patients with active UC. Representative images of activated T cells display blast-like morphology showing colocalization (overlaid images) of TCRαβ and L-PHA staining on the cell membrane. (E1) Bars depict the mean ± SEM of L-PHA staining intensity on gated TCRαβ+ L-PHAhigh cells from three independent experiments. One-way ANOVA using Dunnett’s multiple comparison posttest: **P ≤ 0.01. In all experiments, results are normalized to the corresponding untreated condition (0 mM).
Fig. 2.
Fig. 2.
Remodeling of the glycosylation phenotype upon metabolic supplementation with GlcNAc. (A) Impact of GlcNAc supplementation on GnT-V activity was determined using a pool of lysates from treated vs. nontreated peripheral blood T cells, in three biological replicates of patients with active UC, from two independent technical experiments. Student’s t test: **P ≤ 0.01. (B) Flow cytometry evaluation of glycophenotype of T cells upon GlcNAc supplementation. (B1) Scatter plot: fold change of MFI due to staining with each lectin on T cells, in two biological replicates with different stages of disease severity (Mayo endoscopic scores 1 and 2), from two independent experiments. Results are normalized to the untreated condition, which was taken as 1. Student’s t test: *P ≤ 0.05. NS, not significant.
Fig. 3.
Fig. 3.
Control of T cell-mediated immune response through enhancing branching N-glycosylation. (A) Purified CD3+ T cells from fresh biopsies of naive patients with active UC were labeled with CFSE and cultured with GlcNAc treatment. The gated cells in the histograms correspond to the percentage of live cells. (A1) Bar plot: the mean percentage of effect ± SEM due to GlcNAc supplementation on T cell proliferation in comparison to untreated cells. Results include four biological replicates. Student’s t test: *P ≤ 0.05. (B) Cytokine profile assessed by flow cytometry in the supernatants from ex vivo T cell cultures under GlcNAc supplementation. Bar plots: mean fold change ± SEM of cytokine concentrations (picograms per milliliter) in six biological replicates. Student’s t test: *P ≤ 0.05; **P ≤ 0.01. (B1) Evaluation of the percentage of IFN-γ– and TNF-α–producing CD4+ T cells treated vs. nontreated with GlcNAc. Bar plots: mean ± SEM percentage of CD4+cytokine-producing cells in three biological replicates from two independent experiments. Two-way ANOVA with Bonferroni postcorrection: **P ≤ 0.01. (C) Expression of the transcription factors (TFs) in CD4+CD45+ T cells isolated from patients with UC and analyzed by flow cytometry. Histogram overlays correspond to the expression of the indicated TFs observed upon GlcNAc supplementation (gray-shadowed histograms depict the respective unstained control). (C1) Bar plots: mean fold change in TF mean fluorescence intensity ± SEM in two biological replicates, from two independent experiments. Two-way ANOVA with Bonferroni postcorrection: *P ≤ 0.05; **P ≤ 0.01. (D) Western blot analysis of TCR signaling, p-ZAP70, and p-LAT assessed in T cell lysates from cultures supplemented with GlcNAc. Bar plots: mean ± SEM fold change of p-ZAP70 and p-LAT densities normalized to tubulin in five biological replicates, from three independent experiments. Student’s t test: *P ≤ 0.05. In all experiments, results are normalized to the corresponding untreated condition (0 mM), which was taken as 1.
Fig. 4.
Fig. 4.
Colitis-induced mouse model treated with GlcNAc displays significant control of disease severity and recovery from clinical signs. (A) Schematic representation of the in vivo study performed on C57BL/6 mice. (B and C) Body weight changes and DAI. (B) Effects of GlcNAc on body weight change (%) comparing DSS control and GlcNAc-treated animals. Graphs depict the mean ± SEM. Two-way ANOVA with Bonferroni postcorrection: ***P ≤ 0.001. (Inset) Discrimination of the effects of GlcNAc on body weight change (%) using different routes of administration. Scatter plots include the mean ± SEM. One-way ANOVA with Bonferroni postcorrection: *P ≤ 0.05; ***P ≤ 0.001. (C) DAI comparing mice with colitis that were untreated with those that were treated with GlcNAc. Plots depict the mean ± SEM. Two-way ANOVA with Bonferroni postcorrection: *P ≤ 0.05; **P ≤ 0.01. (Inset) Discrimination of the effect of GlcNAc on colitis scores using different routes of administration. Plots depict the mean ± SEM. One-way ANOVA with Bonferroni post correction: ***P ≤ 0.001. (D) Representative histological images (H&E) of colonic samples from mice [normal colon, DSS (DSS-induced colitis), and GlcNAc treatment (Tx) (DSS + GlcNAc Enema Tx)]. (Magnification: 40×.)
Fig. 5.
Fig. 5.
Colitis-induced mouse model treated with GlcNAc showed increased branched N-glycosylation associated with suppression of T cell function. (A) L-PHA histochemistry and CD3 immunohistochemistry. L-PHA lectin reactivity showed an increased expression of β1,6-branched structures in the intestinal inflammatory infiltrate (positive to CD3) as well as an increase in mucus lining in mice treated with GlcNAc enemas (arrowheads). (Magnification: 63×.) (B) Immunoprecipitation (IP) of TCR followed by β1,6-GlcNAc branched N-glycan recognition in mouse colon, DSS (DSS-induced colitis) vs. DSS + GlcNAc treatment (Tx). WB, Western blot. (B1) Scatter plot: ratio of densities of L-PHA reactivity normalized to that of TCR depicted as the mean ± SEM comparing DSS (n = 2) mice with DSS + GlcNAc Tx (n = 3) mice. Student’s t test: *P ≤ 0.05. (C) TCR signaling by Western blot analysis of the phosphorylation levels of ZAP70 and LAT in LPLs. Values of pZAP70 densities normalized to tubulin are indicated. (D) Immunofluorescence of T-bet in colonic sections of DSS vs. DSS + GlcNAc Tx. (Insets) T-bet–expressing cells at intestinal inflammatory infiltrate are highlighted. (Magnification: 20×.) (E) Concentration of IFN-γ and IL-17A in the supernatants of 24-h colonic explant cultures from DSS and DSS + GlcNAc Tx MGAT5wt (n = 5) mice by ELISA. Plots depict the mean ± SEM of two to three animals per group. Student’s t test: **P ≤ 0.01. NS, not significant.
Fig. 6.
Fig. 6.
MGAT5 null or heterozygous mice develop early-onset colitis and an increase in disease severity that is suppressed by GlcNAc treatment. (A) Evaluation of colitis onset and disease severity in MGAT5 null or heterozygous mice: C57BL/6 WT (n = 14), MGAT5+/− (n = 23), and MGAT5−/− (n = 11) mice. Active disease was defined when animals showed a DAI of ≥2, and three stages of severity were defined: mild (≥2 and <2.5), moderate (≥2.5 and <3), and severe (≥3). Average results of body weight change (B and C) and DAI (B1 and C1) of MGAT5+/− (n = 23) and MGAT5−/− (n = 9) mice, respectively, randomly distributed in controls and GlcNAc treatment groups are shown. DSS-induced colitis (DSS) vs. DSS treated with GlcNAc treatment (DSS + GlcNAc Tx). Animals showing severe signs of disease were euthanized (†). (B and B1, Insets) Discrimination of the efficiency of GlcNAc treatment (colitis scores) with different routes of administration upon 4 d of treatment. Graphs correspond to the mean ± SEM of 17 animals (three to seven animals per route of administration). Student’s t test (B and B1) and one-way ANOVA with Bonferroni postcorrection (B and B1, Insets): *P ≤ 0.05*; **P ≤ 0.01; ***P ≤ 0.001. Body weight changes of MGAT5−/− mice treated through different routes vs. nontreated upon 2 d of treatment (C) and DAI scores of MGAT5−/− mice treated (n = 7) vs. nontreated (n = 2) (C1) are shown. (C and C1, Insets) Discrimination of the efficiency of GlcNAc treatment (colitis scores) with different routes of administration upon 3 d of treatment. (D) Evaluation of the impact of early oral route (O) + enema route (E) GlcNAc treatment (starting on the second day of disease onset: 5–6 d after DSS induction) on the colitis scores (DAI of animals per group) of MGAT5−/− mice, comparing DSS (n = 5) with GlcNAc treated mice (n = 4).
Fig. 7.
Fig. 7.
GlcNAc treatment of MGAT5 null or heterozygous mice attenuates disease progression by controlling Th1/Th17-type immune responses. (A) Representative histological images (H&E) of colonic sections from MGAT5+/− and MGAT5−/− [normal colon, DSS-induced colitis (DSS), and GlcNAc treatment (DSS + GlcNAc Tx)] (Magnification: 20×.) DSS mice displayed visible signs of lymphocytic infiltrate in the intestinal lamina propria (arrowheads). L-PHA histochemistry and CD3 immunohistochemistry of mouse colon from the different groups. (Magnification: 20×.) (B) Evaluation of branching N-glycans on colonic total cell lysates from MGAT5wt, MGAT5+/−, and MGAT5−/− mice comparing DSS control with GlcNAc Tx enema by Western blot (WB). TCL, total cell lysate. (C) Protein lysates from LPLs isolated from the colon of MGAT5+/− mice with DSS (colitis) or treated (DSS + GlcNAc Tx) mice were subjected to L-PHA lectin blotting to evaluate the expression of β1,6-GlcNAc branched N-glycans on the TCR (39 kDa). L-PHA density normalized to tubulin is indicated for each case, and fold change differences of DSS vs. DSS + GlcNAc Tx are highlighted. (D) Immunoprecipitation (IP) of the TCR in total cell lysates from MGAT5−/− mouse colon followed by β1,6-GlcNAc branched N-glycan recognition. DSS vs. DSS + GlcNAc Tx with different routes of administration. (E) Analysis of the phosphorylation levels of ZAP70 in LPL lysates from colon of MGAT5+/− and MGAT5−/− mice. Values of pZAP70 normalized to actin in MGAT5+/− and MGAT5−/− mice are indicated. (F) Immunofluorescence of T-bet in MGAT5+/− and MGAT5−/− mice comparing normal colon, DSS, and DSS + GlcNAc Tx mice. (Magnification: 20×.) (G) Concentration of IFN-γ and IL-17A in the supernatants of 24-h colonic explant cultures from DSS and DSS + GlcNAc Tx MGAT5 heterozygous (n = 10) and null (n = 10) mice by ELISA. Plots depict the mean ± SEM of two to seven animals per group. Student’s t test: *P ≤ 0.05; ***P ≤ 0.001. NS, not significant.

References

    1. Cosnes J, Gower-Rousseau C, Seksik P, Cortot A. Epidemiology and natural history of inflammatory bowel diseases. Gastroenterology. 2011;140:1785–1794. - PubMed
    1. Rudd PM, Elliott T, Cresswell P, Wilson IA, Dwek RA. Glycosylation and the immune system. Science. 2001;291:2370–2376. - PubMed
    1. Pinho SS, et al. The role of N-acetylglucosaminyltransferase III and V in the post-transcriptional modifications of E-cadherin. Hum Mol Genet. 2009;18:2599–2608. - PubMed
    1. Pinho SS, et al. E-cadherin and adherens-junctions stability in gastric carcinoma: Functional implications of glycosyltransferases involving N-glycan branching biosynthesis, N-acetylglucosaminyltransferases III and V. Biochim Biophys Acta. 2013;1830:2690–2700. - PubMed
    1. Pinho SS, Reis CA. Glycosylation in cancer: Mechanisms and clinical implications. Nat Rev Cancer. 2015;15:540–555. - PubMed

Publication types

MeSH terms

Substances

LinkOut - more resources