Review
. 2018 May 2;31(3):e00062-17.
doi: 10.1128/CMR.00062-17. Print 2018 Jul.

Practical Guidance for Clinical Microbiology Laboratories: Implementing a Quality Management System in the Medical Microbiology Laboratory

Affiliations
Review

Practical Guidance for Clinical Microbiology Laboratories: Implementing a Quality Management System in the Medical Microbiology Laboratory

Roberta B Carey et al. Clin Microbiol Rev. .

Abstract

This document outlines a comprehensive practical approach to a laboratory quality management system (QMS) by describing how to operationalize the management and technical requirements described in the ISO 15189 international standard. It provides a crosswalk of the ISO requirements for quality and competence for medical laboratories to the 12 quality system essentials delineated by the Clinical and Laboratory Standards Institute. The quality principles are organized under three main categories: quality infrastructure, laboratory operations, and quality assurance and continual improvement. The roles and responsibilities to establish and sustain a QMS are outlined for microbiology laboratory staff, laboratory management personnel, and the institution's leadership. Examples and forms are included to assist in the real-world implementation of this system and to allow the adaptation of the system for each laboratory's unique environment. Errors and nonconforming events are acknowledged and embraced as an opportunity to improve the quality of the laboratory, a culture shift from blaming individuals. An effective QMS encourages "systems thinking" by providing a process to think globally of the effects of any type of change. Ultimately, a successful QMS is achieved when its principles are adopted as part of daily practice throughout the total testing process continuum.

Keywords: ISO 15189; ISO standard; QMS; continual improvement; quality indicators; quality management system; quality system essentials.


Figures

FIG 1
FIG 1
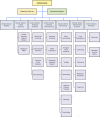
Sample organization chart for a public health laboratory system. The organizational chart demonstrates the chain of command. Organizational charts will vary based on areas of responsibility and disciplines covered.
FIG 2
FIG 2
Sample monthly management review report for the microbiology laboratory. The report is meant to highlight trends and changes in each quality area. It is intended to be visual and not contain unnecessary explanatory text. FTEs, full-time employees; N/A, not applicable; TAT, turnaround time.
FIG 2
FIG 2
Sample monthly management review report for the microbiology laboratory. The report is meant to highlight trends and changes in each quality area. It is intended to be visual and not contain unnecessary explanatory text. FTEs, full-time employees; N/A, not applicable; TAT, turnaround time.
FIG 3
FIG 3
World Health Organization new personnel orientation checklist.
FIG 4
FIG 4
Sample of a competency assessment form that may be used to meet Clinical Laboratory Improvement Amendment (CLIA) personnel requirements.
FIG 4
FIG 4
Sample of a competency assessment form that may be used to meet Clinical Laboratory Improvement Amendment (CLIA) personnel requirements.
FIG 5
FIG 5
Example of a door sign for a microbiology laboratory, indicating the level of biosafety, proper work practices, and type of personal protective equipment (PPE) required.
FIG 6
FIG 6
Sample floor plan for a biosafety level 3 laboratory suite located within a larger BSL-2 central laboratory. The two inner BSL-3 laboratories are separate rooms with negative air flow to contain microorganisms or their molecular components. BSC, biological safety cabinet.
FIG 7
FIG 7
Sample floor plan for a molecular laboratory to ensure the segregation of specimens and high-amplicon material from clean reagents and PCR tubes. BSC, biological safety cabinet.
FIG 8
FIG 8
Template for writing a technical laboratory procedure. If a section is not applicable to a procedure, it is best not to delete the heading but to state “not applicable” in case the procedure should change and require this information in the future.
FIG 8
FIG 8
Template for writing a technical laboratory procedure. If a section is not applicable to a procedure, it is best not to delete the heading but to state “not applicable” in case the procedure should change and require this information in the future.
FIG 8
FIG 8
Template for writing a technical laboratory procedure. If a section is not applicable to a procedure, it is best not to delete the heading but to state “not applicable” in case the procedure should change and require this information in the future.
FIG 9
FIG 9
Template for writing a document change request (DCR). The DCR form allows traceability for amending or archiving technical or quality management policies and procedures.
FIG 10
FIG 10
Flow diagram for selection qualification of equipment. Each step does not necessarily need to be performed before others are completed. Some may be performed simultaneously.
FIG 11
FIG 11
Template for an equipment installation qualification (IQ) and operation qualification (OQ) checklist. IQ and OQ are performed before the laboratory initiates the performance qualification (PQ) for an instrument.
FIG 11
FIG 11
Template for an equipment installation qualification (IQ) and operation qualification (OQ) checklist. IQ and OQ are performed before the laboratory initiates the performance qualification (PQ) for an instrument.
FIG 11
FIG 11
Template for an equipment installation qualification (IQ) and operation qualification (OQ) checklist. IQ and OQ are performed before the laboratory initiates the performance qualification (PQ) for an instrument.
FIG 11
FIG 11
Template for an equipment installation qualification (IQ) and operation qualification (OQ) checklist. IQ and OQ are performed before the laboratory initiates the performance qualification (PQ) for an instrument.
FIG 12
FIG 12
Example of a quality indicator activities form. MDRO, multiple-drug-resistant organism; TAT, turnaround time; TTP, total testing process; CV, critical value. (Courtesy of Lana Fairbanks, Parkview Medical Center, Pueblo, CO.)
FIG 12
FIG 12
Example of a quality indicator activities form. MDRO, multiple-drug-resistant organism; TAT, turnaround time; TTP, total testing process; CV, critical value. (Courtesy of Lana Fairbanks, Parkview Medical Center, Pueblo, CO.)
FIG 13
FIG 13
Example of a nonconforming event form used to document personnel or equipment failures and customer complaints. QNS, quantity not sufficient; POCT, point of care test.
FIG 13
FIG 13
Example of a nonconforming event form used to document personnel or equipment failures and customer complaints. QNS, quantity not sufficient; POCT, point of care test.
FIG 14
FIG 14
Three examples of root-cause analysis tools, including a fishbone diagram to identify sources of an analytical error (A), a Pareto chart to identify sources of error where improvement will have the highest impact (B), and a process map to identify variation in the steps to complete a process (C). Root-cause analysis tools are used to investigate and uncover the true reason (the “root cause”) that errors occurred.
FIG 14
FIG 14
Three examples of root-cause analysis tools, including a fishbone diagram to identify sources of an analytical error (A), a Pareto chart to identify sources of error where improvement will have the highest impact (B), and a process map to identify variation in the steps to complete a process (C). Root-cause analysis tools are used to investigate and uncover the true reason (the “root cause”) that errors occurred.
FIG 15
FIG 15
Example of a failure mode and effects analysis (FMEA) form to identify high-risk processes and needed improvements to reduce the chance of an unintended adverse event.
FIG 16
FIG 16
Example of a visual display board that highlights short- and long-term quality issues for the laboratory. Items on a visual display board are grounded on lean principles. The “Hot Button List” section of the display board focuses on laboratory workload statistics, safety issues, daily operational status, and customers’ feedback. The “Lean Daily Management System (LDMS)” section highlights progress on quality improvement projects and captures kaizens, which are small improvement projects that contribute to lean transformation. This low-cost visual media can be used during daily huddle meetings in clinical microbiology laboratories to recognize staff, celebrate successes on ongoing projects, and track efforts to meet institutional goals that align with strategic plans. A mobile white board facilitates sharing of relevant information at other meeting locations. The LDMS tool includes technical staff and management, reinforces accountability, and informs and engages everyone during the lean process.

References

    1. International Organization for Standardization. 2012. Medical laboratories—requirements for quality and competence, 3rd ed ISO document 15189. International Organization for Standardization, Geneva, Switzerland.
    1. Clinical and Laboratory Standards Institute. 2011. A quality management system model for laboratory services; approved guideline, 4th ed CLSI document QMS01-A4. Clinical and Laboratory Standards Institute, Wayne, PA.
    1. Bartlett RC, Mazens-Sullivan M, Tetreault JZ, Lobel S, Nivard J. 1994. Evolving approaches to management of quality in clinical microbiology. Clin Microbiol Rev 7:55–88. doi:10.1128/CMR.7.1.55. - DOI - PMC - PubMed
    1. Schifman RB, Cembrowski GS, Wolk DM, Brisbois JI. 2014. Quality management, p 421–446. In Garcia LS, Bachner P, Baselski VS, Lewis MR, Linscott AJ, Schwab DA, Steele JCH Jr, Weissfeld AS, Wilkinson DS, Wolk DM (ed), Clinical laboratory management, 2nd ed ASM Press, Washington, DC.
    1. US Department of Health and Human Services, Centers for Medicare and Medicaid Services. 2003. Medicare, Medicaid and CLIA programs; laboratory requirements relating to quality systems and certain personnel qualifications. Final rule. 42 CFR 493. Fed Regist 68:3640–3714. - PubMed

MeSH terms

LinkOut - more resources