. 2018 May 3;3(9):e97339.
doi: 10.1172/jci.insight.97339.

Neutrophils are essential for induction of vaccine-like effects by antiviral monoclonal antibody immunotherapies

Neutrophils are essential for induction of vaccine-like effects by antiviral monoclonal antibody immunotherapies

Mar Naranjo-Gomez et al. JCI Insight. .

Abstract

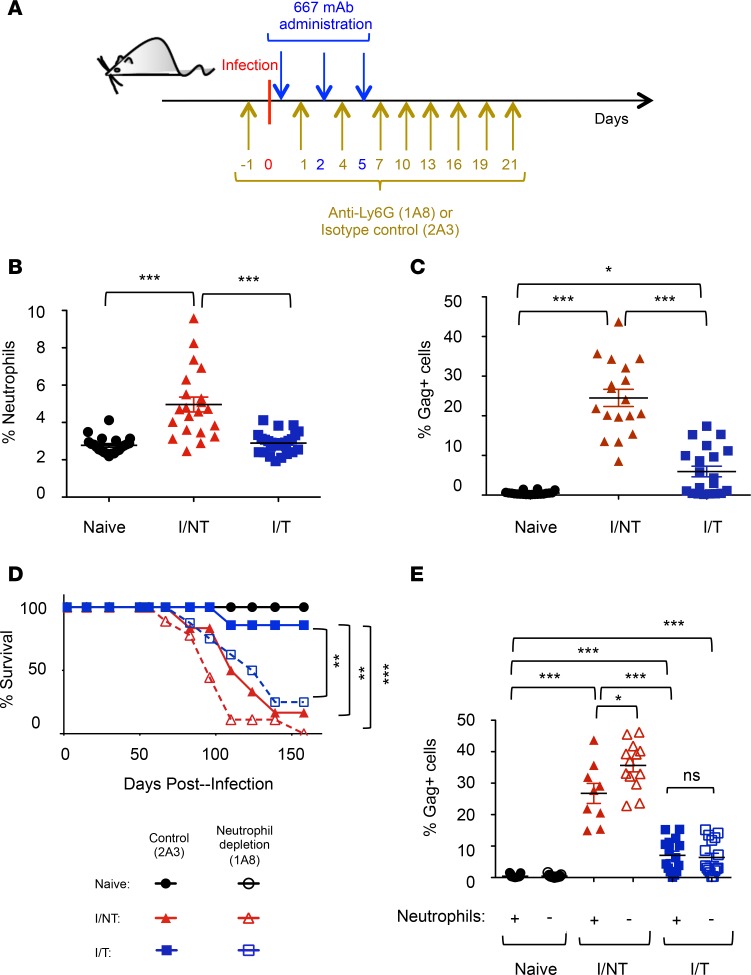
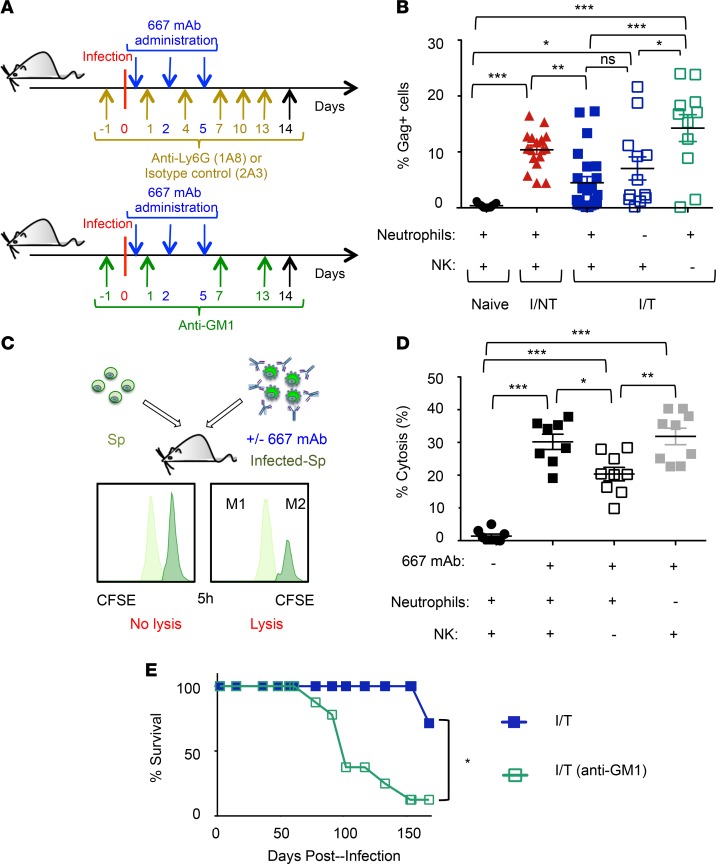
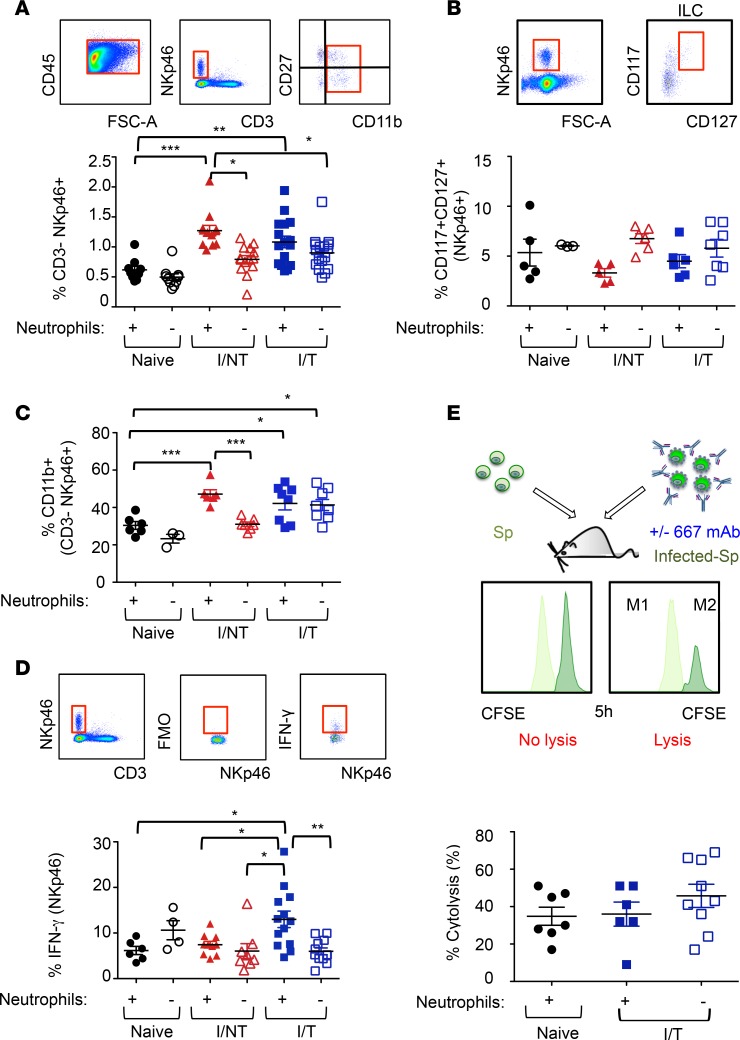
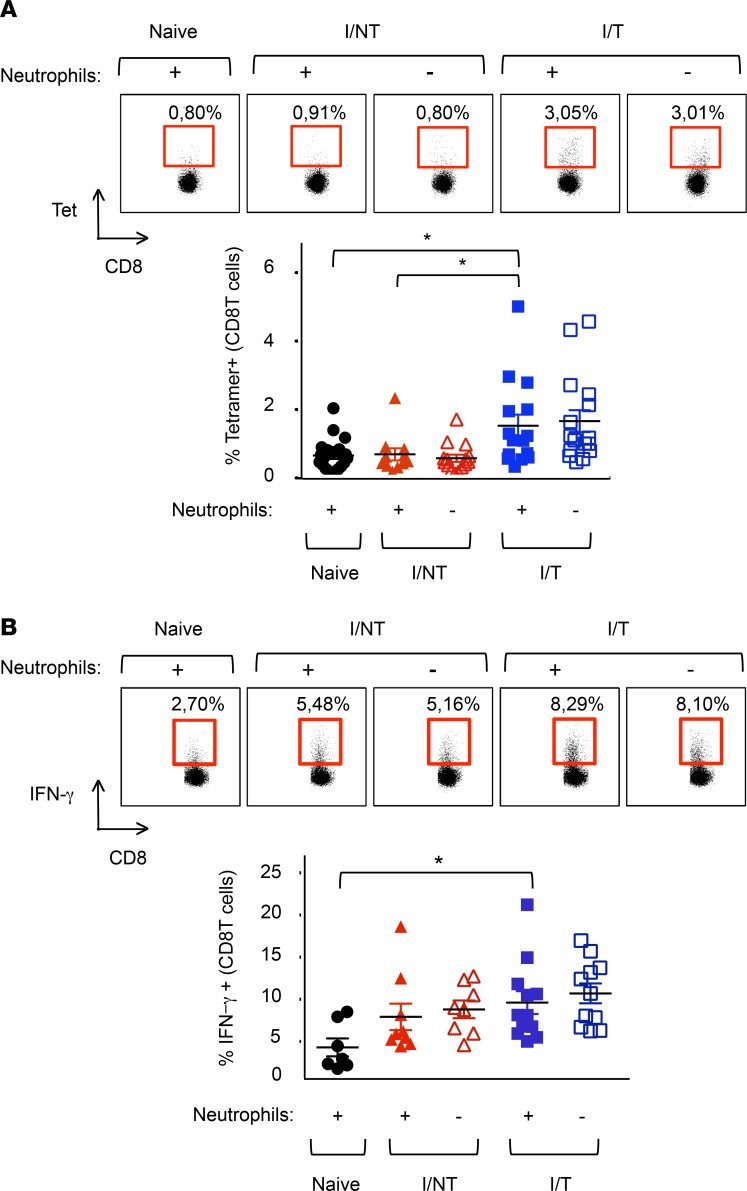
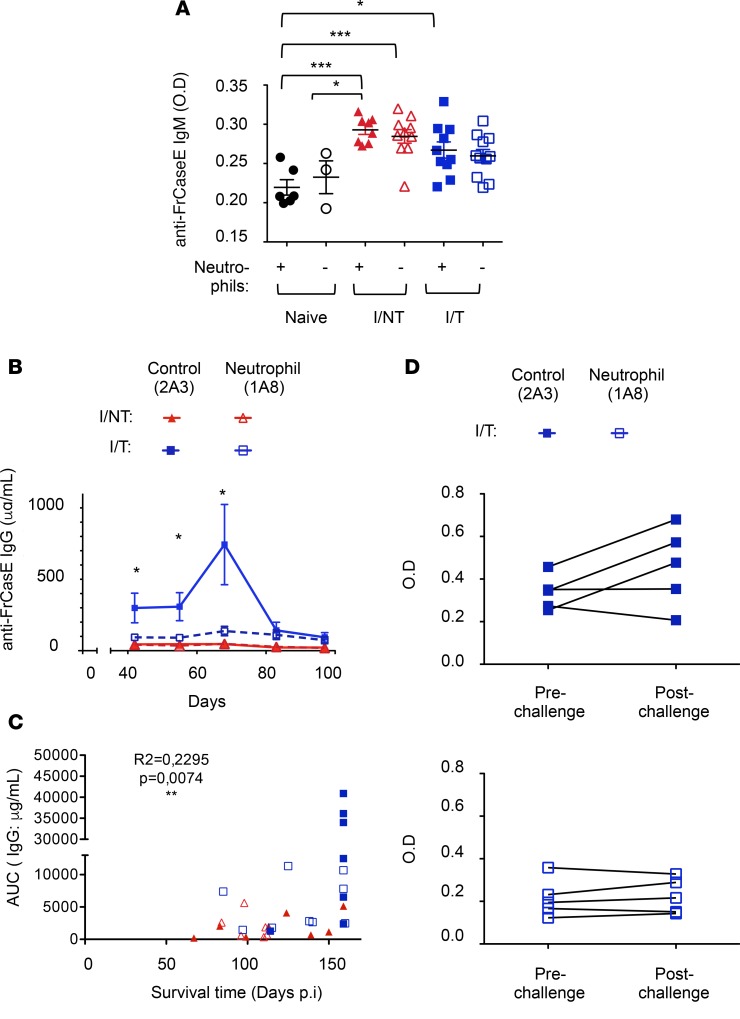
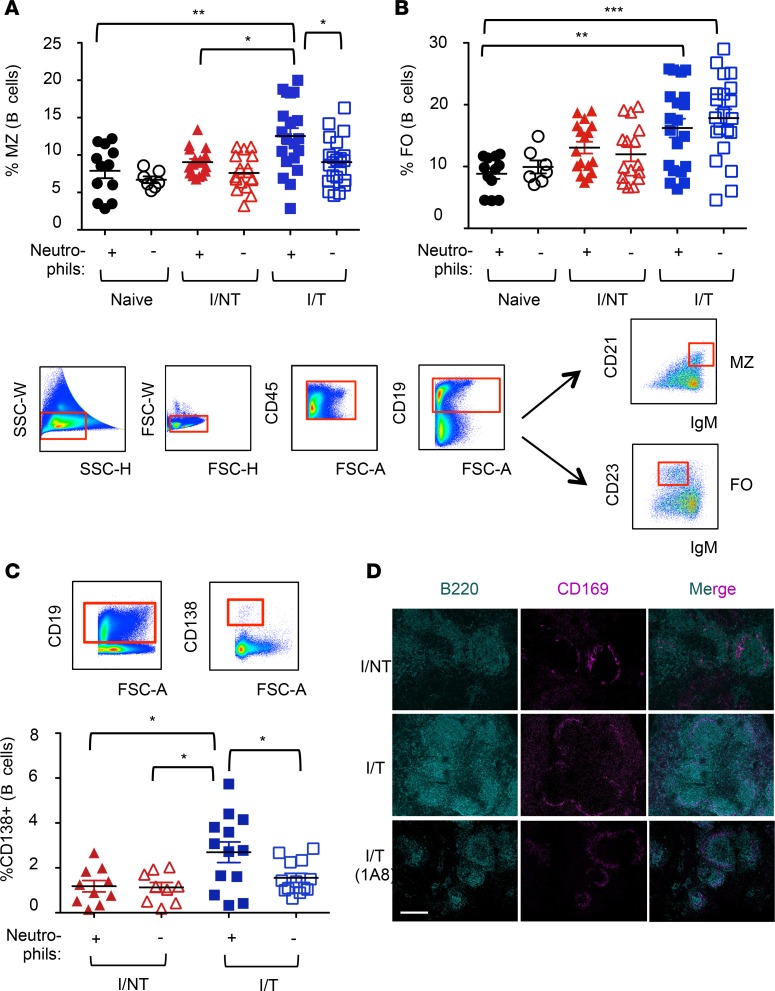
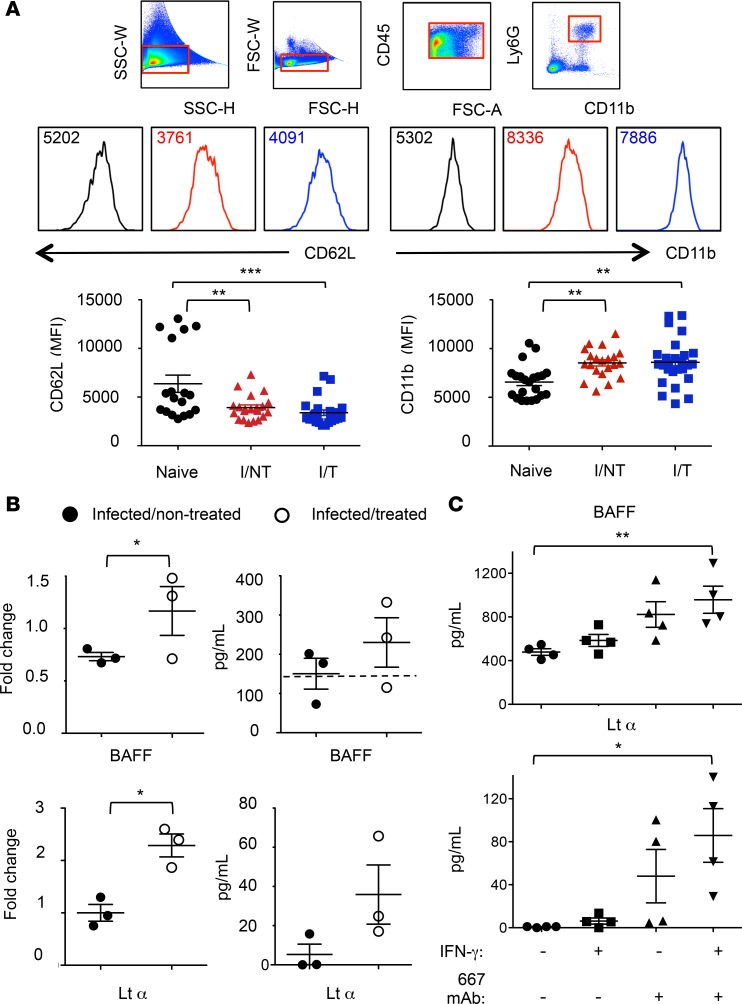
Using a mouse retroviral model, we have shown that mAb-based immunotherapy can induce life-long endogenous protective immunity (vaccine-like effects). This observation has potentially important consequences for treating life-threatening human viral infections. Here, we investigated the role of neutrophils in this effect. Neutrophils are innate immunity effector cells with well-established microbe-killing activities that are rapidly mobilized upon infection. They are also emerging as orchestrators of innate and adaptive immunities. However, their immunomodulatory activity during antiviral mAb immunotherapies has never been studied. Our data reveal that neutrophils have an essential role in immunotherapy-induced immune protection of infected mice. Unexpectedly, neutrophils have a limited effect in controlling viral propagation upon passive immunotherapy administration, which is mostly mediated by NK cells. Instead, neutrophils operate as essential inducers of a potent host humoral antiviral response. Thus, neutrophils play an unexpected key role in protective immunity induction by antiviral mAbs. Our work opens approaches to improve antiviral immunotherapies, as it suggests that preserving neutrophil functions and counts might be required for achieving mAb-induced protective immunity.

Keywords: Adaptive immunity; Immunotherapy; Infectious disease; Neutrophils; Therapeutics.


Conflict of interest statement

Conflict of interest: The authors have declared that no conflict of interest exists.

Figures

Figure 1
Figure 1. Antiviral effects of neutrophils.
(A) Experimental scheme. Eight-day-old pups were infected and treated with the 667 mAb as indicated. Mice were treated as indicated with the anti-Ly6G 1A8 mAb or the isotype control 2A3 mAb in neutrophil depletion experiments. (B and C) Neutrophil recruitment and infected cell rate in spleen. Splenocytes from naive, infected/nontreated (I/NT), and infected/treated (I/T) mice were analyzed by flow cytometry on day 8 p.i. for (a) neutrophil recruitment (percentage of Ly6G+ cells) and (b) retroviral positivity of splenocytes (percentage of Gag+ cells) gated in the CD45.2+ population. The data presented correspond to 5 independent experiments, with at least 15 mice per group. (D) Mouse survival. Naive, I/NT, and I/T mice were treated with either the antineutrophil (1A8) or the control (2A3) mAb as indicated in A and followed up for leukemic death. The data represent 2 independent experiments, with 6–9 mice per group. (E) Infected cells rate upon neutrophil depletion. Neutrophils of naive, I/NT, and I/T mice were depleted, or not, as indicated in A and infected splenocytes were assayed as in C on day 8 p.i. The data represent 4 independent experiments, with 9–15 mice per group. Data are expressed as mean ± SEM. Statistical significance was established using a parametric 1-way ANOVA test with a Bonferroni correction (*P < 0.05; **P < 0.01; ***P < 0.001).
Figure 2
Figure 2. Antibody-mediated control of viral propagation by NK cells.
(A) Experimental scheme. Mice were infected and mAb-treated as in Figure 1A. Infected/treated mice were treated as indicated with the anti-Ly6G 1A8 mAb or the isotype control 2A3 mAb to deplete neutrophils and infected/treated mice were treated as indicated with the anti-asialo-GM1 antibody to deplete NK cells. (B) Effect of neutrophils or NK cell depletion in viral spread in infected/treated mice. Percentage of infected cells at day 14 p.i. in the spleens of naive, I/NT, and I/T mice, depleted or not of neutrophils or NK cells assessed as in Figure 1C. The data represent 3 independent experiments, with at least 8 mice per group. (C and D) In vivo cytolysis activity of 667 mAb in naive mice after depletion of neutrophils or NK cells. Splenocytes from noninfected mice (Sp) were labeled using 0.5 μM of the vital dye CFSE (CFSElo cells; M1) and mixed at a 1:1 ratio with splenocytes from infected mice (Infected-Sp) labeled using 5 μM CFSE (CFSEhi cells; M2) and preincubated, or not, with 667 mAb. Mixed cell populations were administered to naive mice 1 day after depletion of either neutrophils or NK cells with the 1A8 mAb or the anti-asialo-GM1 antibody, respectively. Cytolysis was quantified 5 hours later, as described in Methods section. The data are presented as mean ± SEM of 2 independent experiments, with at least 8 mice per group. Statistical significance was established using a parametric 1-way ANOVA test with a Bonferroni correction (B and D). (E) Effect of NK cell depletion in the survival of infected/treated mice. I/T, NK cells, depleted or not as indicated in A, were followed up for leukemic death. The data represent 2 independent experiments, with 7 mice per group. Statistical significance was established using an unpaired Student’s t test. Data are expressed as mean ± SEM (*P < 0.05, **P < 0.01,***P < 0.001).
Figure 3
Figure 3. Effects of neutrophil depletion on innate lymphoid cell recruitment and biology.
(A–D) Neutrophils of naive, I/NT, and I/T mice were depleted, or not, as indicated in Figure 1A, and ILC in the spleen were assayed 14 days p.i. by flow cytometry. (A) Frequency of CD3NKp46+ cells in the CD45.2+ leukocytic population. (B) Frequency of CD117+/CD127+ cells in the LinNKp46+ population. (C) Maturation (CD11b+ cells) and (D) expression of IFN-γ in the CD3NKp46+ population. (E) In vivo cytolysis activity of 667 mAb in infected/treated mice after depletion of neutrophils. The 1A8, or the 2A3 isotype control mAb, was administered to I/T mice, and 667 ADCC activity was quantified at 30 days p.i., as in Figure 2, C and D. The data represent at least 2 independent experiments. Data are expressed as mean ± SEM. Statistical significance was established using a parametric 1-way ANOVA test with a Bonferroni correction (*P < 0.05; **P < 0.01; ***P < 0.001).
Figure 4
Figure 4. Assay of FrCasE-specific CD8+ T cells in the presence and absence of neutrophils.
(A) Neutrophils of naive, I/NT, and I/T mice were depleted, or not, as indicated in Figure 1A. Frequency of FrCasE-specific CD8+ T cells. Spleen cells were isolated at day 14 p.i., and the frequency of virus-specific CD8+ T cells in the total CD8+ T cells population was assayed by flow cytometry using the H2Db-GagL MHC tetramer. The data represent 4 independent experiments, with at least 11 mice per group. (B) Expression of IFN-γ by CD8+ T cells. Splenic CD8+ T cells were analyzed by flow cytometry for the expression of IFN-γ. The data presented represent 3 independent experiments, with at least 7 mice per group. Data are expressed as mean ± SEM. Statistical significance was established using a parametric 1-way ANOVA test with a Bonferroni correction (*P < 0.05).
Figure 5
Figure 5. Enhancement of the humoral antiviral response by neutrophils.
Neutrophils of naive, I/NT, and I/T mice were depleted, or not, as indicated in Figure 1A. (A and B) Serum concentration of FrCasE-specific Igs. (A) Seric FrCasE-specific IgM levels were assayed by ELISA at 14 days p.i. The data represent 2 independent experiments, with 8–11 mice per group (for I/NT and I/T mice) and 3–6 mice per group (for naive mice). (B) Seric FrCasE-specific IgG concentration was assayed by ELISA at the indicated times. The data represent 2 independent experiments, with 7–9 mice per group. Data are expressed as mean ± SEM. Statistical significance was established using a parametric 1-way ANOVA test, with a Bonferroni correction. (C) Correlation between serum anti-FrCasE IgG levels (evaluated as AUC) and survival times, analyzed using the Pearson correlation test. AUC was evaluated until the last time point at which all mice were still alive (day 68 p.i.). All infected/nontreated (n = 8) and infected/treated (n = 9) mice, depleted or not of neutrophils (n = 9 and n = 7, respectively), showed in Figure 1D were evaluated for such a correlation. (D) FrCasE-specific secondary humoral response. Seric FrCasE-specific IgG levels in I/T mice (depleted or not of neutrophils) were assayed by ELISA before and 1 week after a viral challenge performed at day 93 p.i. The data represent 2 independent experiments, with 5 mice per group. Statistical significance was established using a paired Student’s t test (*P < 0.05; **P < 0.01; ***P < 0.001).
Figure 6
Figure 6. Effects of neutrophil depletion on B cell responses.
Neutrophils of naive, I/NT, and I/T mice were depleted, or not, as indicated in Figure 1A. (A and B) Frequency of MZ and follicular (FO) B cells. Spleen cells were isolated at day 14 p.i. and were analyzed by flow cytometry for the frequency of MZ (CD21hiIgMhi) (A) and FO (CD23+IgMlo) (B) CD19+ B cells, as depicted in the gating strategy. (C) Frequency of plasma cells. BM cells were isolated at day 14 p.i. and were analyzed by flow cytometry for the frequency of CD138+ (CD19+) B cells. The data represent 5 independent experiments, with 7–12 mice per group for naive mice and 17–21 per group for I/NT and I/T mice. Data are expressed as mean ± SEM. Statistical significance was established using a parametric 1-way ANOVA test with a Bonferroni correction (*P < 0.05; **P < 0.01; ***P < 0.001). (D) Histological analyses of spleen sections. Immunolabeling of B cells (B220+) and macrophages of the MZ (CD169+) was performed in sections from spleens of infected/nontreated and infected/treated mice (depleted or not of neutrophils) recovered at 14 days p.i. to visualize germinal centers. The images are representative of 4 separate mice for each experimental condition. Scale bar: 200 μm.
Figure 7
Figure 7. Activation of splenic and BM-isolated neutrophils.
(A) Expression of CD11b and CD62L. Spleen cells from naive, I/NT, and I/T mice were isolated at day 8 p.i. and were analyzed by flow cytometry for assaying cell surface expression of CD11b and CD62L. The data represent 5 independent experiments, with at least 18 mice per group. Data are expressed as mean ± SEM. (B) Expression and protein release of BAFF and LTα by neutrophils. Neutrophils from naive, I/NT, and I/T mice were sorted from spleens at day 8 p.i. and assessed for cytokine expression or protein release. Cytokine expression (left) was assessed by RT-qPCR normalized to β-actin. The data show fold changes in cytokine expression by neutrophils from I/NT and I/T mice as compared with naive mice and are representative of 3 independent experiments, with 8–10 mice per group. Protein release (right) was assessed by ELISA in supernatants of sorted neutrophils cultured at a density of 2 × 10⁵ cells/well for 24 hours. The data show BAFF and LTα release by neutrophils from I/NT and I/T and are representative of 3 independent experiments, with 8–10 mice per group. The dashed line represents the level of BAFF released by neutrophils sorted from naive mice. No LTα release was detected from neutrophils sorted from naive mice. (C) BAFF and LTα release by BM-isolated neutrophils. BAFF and LTα release was assessed by ELISA in supernatants of neutrophils isolated from BM of naive mice (>95% purity) and cultured for 24 hours in 667 mAb–coated 24-well plates at a density of 2 × 10⁶ cells in 500 μl medium. Experiments were done in the presence and in the absence of the proinflammatory cytokine IFN-γ (100 ng/ml). 667 mAb–noncoated plates were used as control. The data represent 4 independent experiments. Data are expressed as mean ± SEM. Statistical significance was established using a parametric 1-way ANOVA test with a Bonferroni correction (A and C) or a paired Student’s t test (B) (*P < 0.05; **P < 0.01; ***P < 0.001).

Similar articles

Cited by

References

    1. Salazar G, Zhang N, Fu TM, An Z. Antibody therapies for the prevention and treatment of viral infections. NPJ Vaccines. 2017;2:19. - PMC - PubMed
    1. Both L, Banyard AC, van Dolleweerd C, Wright E, Ma JK, Fooks AR. Monoclonal antibodies for prophylactic and therapeutic use against viral infections. Vaccine. 2013;31(12):1553–1559. doi: 10.1016/j.vaccine.2013.01.025. - DOI - PMC - PubMed
    1. Caskey M, et al. Antibody 10-1074 suppresses viremia in HIV-1-infected individuals. Nat Med. 2017;23(2):185–191. doi: 10.1038/nm.4268. - DOI - PMC - PubMed
    1. Corti D, Lanzavecchia A. Broadly neutralizing antiviral antibodies. Annu Rev Immunol. 2013;31:705–742. doi: 10.1146/annurev-immunol-032712-095916. - DOI - PubMed
    1. Corti D, et al. Prophylactic and postexposure efficacy of a potent human monoclonal antibody against MERS coronavirus. Proc Natl Acad Sci USA. 2015;112(33):10473–10478. doi: 10.1073/pnas.1510199112. - DOI - PMC - PubMed

Publication types

Substances