. 2018 May 2;9(1):1770.
doi: 10.1038/s41467-018-04180-1.

De novo activating mutations drive clonal evolution and enhance clonal fitness in KMT2A-rearranged leukemia

Affiliations

De novo activating mutations drive clonal evolution and enhance clonal fitness in KMT2A-rearranged leukemia

Axel Hyrenius-Wittsten et al. Nat Commun. .

Abstract

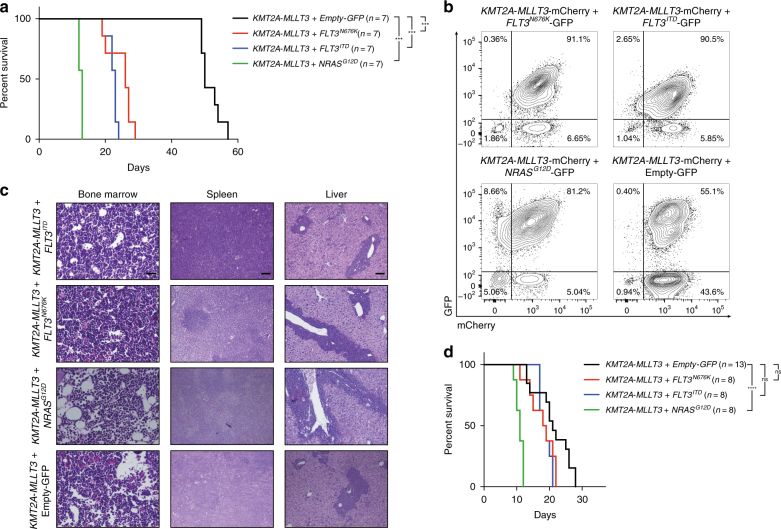
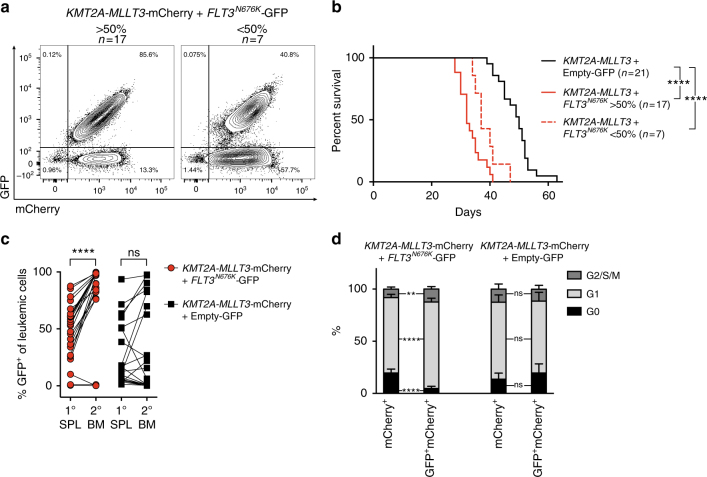
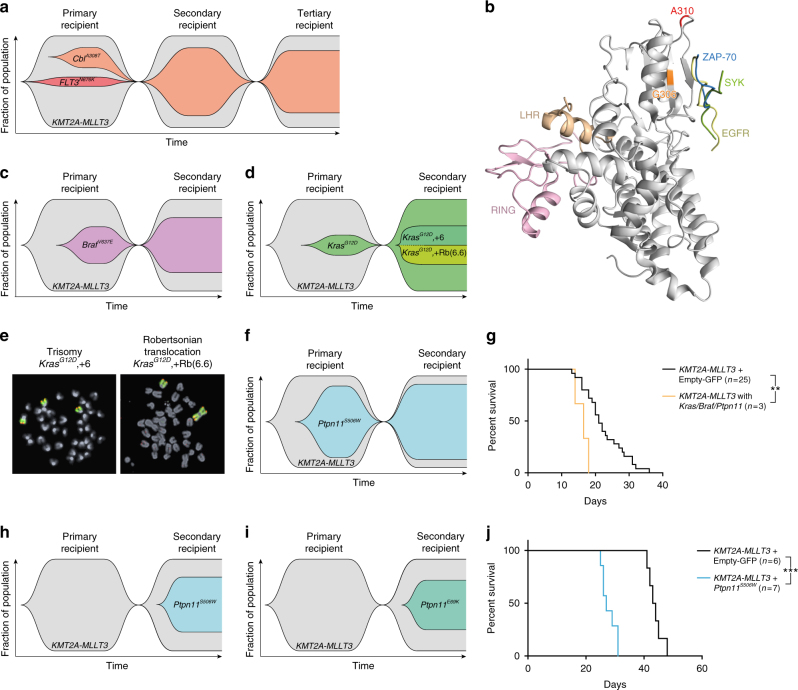
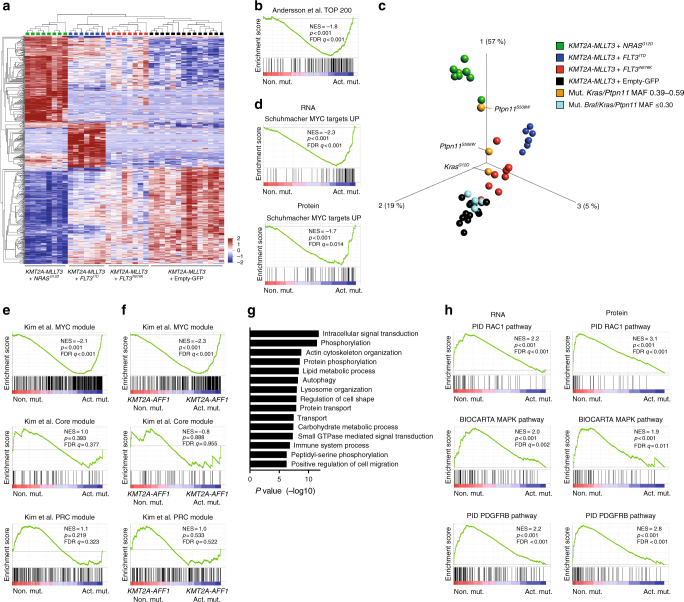
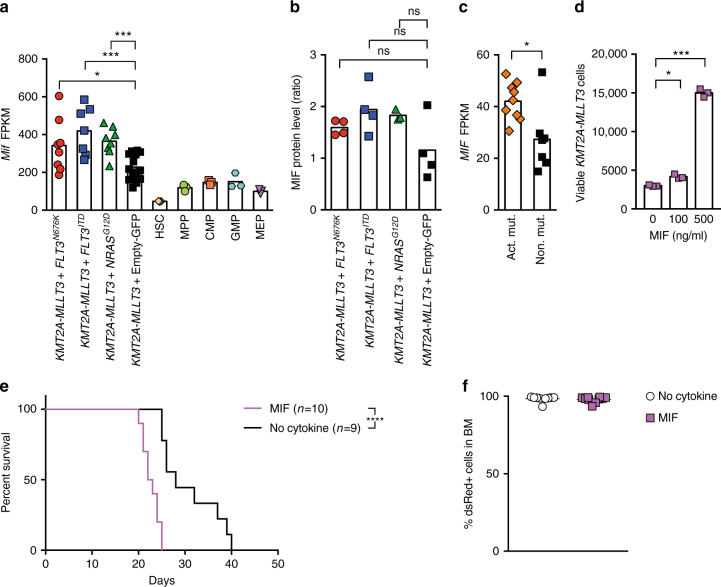
Activating signaling mutations are common in acute leukemia with KMT2A (previously MLL) rearrangements (KMT2A-R). These mutations are often subclonal and their biological impact remains unclear. Using a retroviral acute myeloid mouse leukemia model, we demonstrate that FLT3 ITD , FLT3 N676K , and NRAS G12D accelerate KMT2A-MLLT3 leukemia onset. Further, also subclonal FLT3 N676K mutations accelerate disease, possibly by providing stimulatory factors. Herein, we show that one such factor, MIF, promotes survival of mouse KMT2A-MLLT3 leukemia initiating cells. We identify acquired de novo mutations in Braf, Cbl, Kras, and Ptpn11 in KMT2A-MLLT3 leukemia cells that favored clonal expansion. During clonal evolution, we observe serial genetic changes at the Kras G12D locus, consistent with a strong selective advantage of additional Kras G12D . KMT2A-MLLT3 leukemias with signaling mutations enforce Myc and Myb transcriptional modules. Our results provide new insight into the biology of KMT2A-R leukemia with subclonal signaling mutations and highlight the importance of activated signaling as a contributing driver.


Conflict of interest statement

The authors declare no competing interests.

Figures

Fig. 1
Fig. 1
FLT3- and RAS-signaling mutations accelerate AML onset. a Kaplan–Meier survival curves of mice transplanted with bone marrow (BM) cells co-transduced with KMT2A-MLLT3 and either FLT3ITD, FLT3N676K, or NRASG12D (n = 7 for all groups), showing accelerated disease onset for mice receiving KMT2A-MLLT3 and either of the activating mutations (P = 0.0002 for KMT2A-MLLT3 + FLT3ITD, P = 0.0002 for KMT2A-MLLT3 + FLT3N676K, and P = 0.0004 for KMT2A-MLLT3 + NRASG12D, as compared to KMT2A-MLLT3 + Empty-GFP. Mantel–Cox log-rank test). b Flow cytometric analysis of BM from sacrificed mice showed that a majority of cells were GFP+mCherry+ in mice co-expressing KMT2A-MLLT3 and an activating mutation. c Hematoxylin–eosin stained sections from bone marrow, liver, and spleen (original magnification 200×, scale bar 0.1 mm, for bone marrow and 40×, scale bar 0.5 mm, for spleen and liver). The architecture of the spleen is effaced and the red pulp is expanded mainly due to expansion of immature myeloid cells. In the liver, periportal, perisinusoidal and intrasinusoidal extensive infiltrates of immature hematopoietic cells were noted. d Kaplan–Meier curves for secondary recipients transplanted with primary leukemic splenocytes showing that only KMT2A-MLLT3 + NRASG12D sustained a significant difference in disease latency when compared to KMT2A-MLLT3 + Empty-GFP (P < 0.0001. Mantel–Cox log-rank test). ***P ≤ 0.001, ****P ≤ 0.0001; ns, not significant
Fig. 2
Fig. 2
Subclonal FLT3N676K accelerates AML onset. a Flow cytometric analysis on BM cells from primary KMT2A-MLLT3 + FLT3N676K recipients revealed the presence of either a dominant clone (>50% GFP+mCherry+, n = 17), or a subclone (<50% GFP+mCherry+, n = 7) of KMT2A-MLLT3-mCherry + FLT3N676K-GFP expressing cells. b Kaplan–Meier curves of mice transplanted with KMT2A-MLLT3 and FLT3N676K (n = 24) or with Empty-GFP vector control (n = 21) showing accelerated disease onset for both dominant and subclonal KMT2A-MLLT3 + FLT3N676K leukemias as compared to KMT2A-MLLT3 + Empty-GFP (both P < 0.0001. Mantel–Cox log-rank test). c Evolution of FLT3N676K-GFP+ cells within the mCherry+ leukemic population between primary (1°) spleen (SPL) and secondary (2°) BM showed a significant expansion of KMT2A-MLLT3-mCherry + FLT3N676K-GFP cells (n = 24, P< 0.0001. Paired t-test) but not of KMT2A-MLLT3-mCherry + Empty-GFP cells (n = 21, P = 0.1468. Paired t-test). d Cell cycle analysis of primary leukemia cells showed a higher cell cycle rate for KMT2A-MLLT3-mCherry cells harboring FLT3N676K-GFP (n = 7) as compared to KMT2A-MLLT3 + Empty-GFP (n = 7). Error bars are s.d. **P ≤ 0.01, ****P ≤ 0.0001; ns, not significant
Fig. 3
Fig. 3
KMT2A-MLLT3 cells acquire de novo signaling mutations. a Fish plot showing progression of one leukemia with a subclonal KMT2A-MLLT3 + FLT3N676K (10.1%) that gained a CblA308T de novo mutation in the primary (SJ016337) KMT2A-MLLT3-only cells which expanded and gained clonal dominance a secondary (SJ046291), and tertiary recipient; MAF 0.11->0.37->0.34. b Ribbon representation of the human N-terminal SH2-containing tyrosine kinase-binding (TKB) domain of CBL (gray), overlayed with ZAP-70 (blue), SYK (green) and EGFR (yellow) peptides, and including the RING domain (pink), LHR (beige), and with residue G306 (orange) and A310 (red) highlighted. c, d Fish plots of primary KMT2A-MLLT3 + Empty-GFP recipients that gained de novo mutations and their subsequent progression in secondary recipients showing c a primary subclonal BrafV637E that increased in size; MAF 0.20 (SJ018146) ->0.30 (SJ046293), d a subclonal KrasG12D that progressed to clonal dominance; MAF 0.11 (SJ016338) ->0.59 (SJ046295). The MAF of 0.59 indicated allelic imbalance and was caused by a gain of chromosome 6 (+6) and a Robertsonian translocation (+Rb(6.6)), each present in 20% of cells, as shown by fluorescence in situ hybridization (FISH). e FISH results of the Kras locus (red) in d, showing gain of chromosome 6 (green) by trisomy in 8/38 (21%) metaphases and by a Robertsonian translocation involving two copies of chromosome 6 (Rb(6.6)) in addition to a normal chromosome 6 in 8/38 (21%) metaphases. Together with the observed MAF this suggests that all disomic cells were heterozygous for KrasG12D mutation and all cells with three copies of chromosomes 6 had duplicated the mutated allele. f Fish plot showing a dominant Ptpn11S506W which was preserved in size; MAF 0.39 (SJ016332) ->0.41 (SJ046294). g Kaplan–Meier survival curve for secondary KMT2A-MLLT3 recipients, showing accelerated disease for mice that harbored BrafV637E, KrasG12D, and Ptpn11S506W (n = 3) as compared to those lacking an identified de novo mutation (n = 25; P= 0.0083. Mantel–Cox log-rank test). h, i Fish plots of secondary KMT2A-MLLT3 + Empty-GFP recipients that gained de novo mutations in h Ptpn11S506W and i Ptpn11E69K (MAF 0.31 and 0.29, respectively). j Kaplan–Meier curves of mice transplanted with BM co-transduced with either KMT2A-MLLT3 + Ptpn11S506W (n = 7) or KMT2A-MLLT3 + Empty-GFP (n = 6), showing accelerated disease on onset for KMT2A-MLLT3 + Ptpn11S506W recipients (P = 0.0005. Mantel–Cox log-rank test). **P ≤ 0.01, ***P ≤ 0.001
Fig. 4
Fig. 4
Activating mutations enforce Myc and Myb modules. a Hierarchical clustering after multigroup comparison of mouse leukemias using 553 variables (P = 2.9e−8, FDR = 6.6e−7. F-test) reveals that each activating mutation causes a distinct gene expression profile. b GSEA revealed enrichment of a signature of the top 200 genes that discriminate infant KMT2A-AFF1 ALL patients harboring activating mutations (dominant or subclonal) to those lacking such mutations for mouse leukemias carrying KMT2A-MLLT3 with FLT3ITD, FLT3N676K, or NRASG12D (Act. mut.). c Principal component analysis (553 variables, P = 2.9e−8, FDR = 6.6e−7. F-test) of primary mouse leukemias. KMT2A-MLLT3 leukemias with de novo mutations in Braf, Kras or Ptpn11 were inserted into the same PCA (still based solely the leukemias defined above), showing that leukemias with de novo mutations with a MAF of 0.39–0.59 now fall closely to leukemias co-expressing KMT2A-MLLT3 and FLT3ITD, FLT3N676K, or NRASG12D. d GSEA revealed enrichment of a MYC signature in the presence of FLT3ITD, FLT3N676K, or NRASG12D (Act. mut.) both at the RNA and protein level. e GSEA revealed enrichment of the MYC module, but not Core or polycomb (PRC) modules, for mouse KMT2A-MLLT3 leukemias with FLT3ITD, FLT3N676K, or NRASG12D (Act. mut.). f GSEA revealed enrichment of the MYC module, but not Core or PRC modules, in infant KMT2A-AFF1 ALL patients with activating mutations (dominant or subclonal; Act. mut.) to those lacking such mutations (Non. mut.). g Gene ontology enrichment results of genes upregulated in leukemias KMT2A-MLLT3 + Empty-GFP as compared to KMT2A-MLLT3 leukemias with either FLT3ITD, FLT3N676K, or NRASG12D (FDR  ≤0.01). h GSEA on transcriptomic- and proteomic data showed enrichment of intracellular signaling pathways, such as RAC1, MAPK, and PDGFRB, in KMT2A-MLLT3 leukemias lacking an activating mutation
Fig. 5
Fig. 5
MIF promotes survival of KMT2A-MLLT3 leukemia cells. a Mif expression (FPKM) in mouse KMT2A-MLLT3 leukemias with or without FLT3ITD, FLT3N676K, or NRASG12D, as well as in sorted normal mouse hematopoietic progenitors of hematopoietic stem cells (HSC), multipotent progenitors (MPP), megakaryocyte erythroid progenitor (MEP), common myeloid progenitor (CMP), and granulocyte macrophage progenitors (GMP) (Supplementary Table 4). b Relative MIF protein abundance in mouse KMT2A-MLLT3 leukemic cells with or without FLT3ITD, FLT3N676K, or NRASG12D as determined by quantitative mass spectrometry. c MIF expression in infant KMT2A-AFF1 ALL patients with activating mutations (dominant or subclonal) to those lacking such mutations. d Number of viable KMT2A-MLLT3 leukemia cells when cultured with increasing concentrations of MIF after 6 days of ex vivo culture without IL3 (n = 3). e Kaplan–Meier survival curve for recipient mice transplanted with serially propagated dsRed+ KMT2A-MLLT3 cells cultured ex vivo for 3 days with or without 500 ng/ml MIF. f Flow cytometric analysis on bone marrow (BM) from moribund mice revealed a majority of leukemia (dsRed+) cells in all mice. * P ≤ 0.05, ** P ≤ 0.01, *** P ≤ 0.001, **** P ≤ 0.0001; ns, not significant

References

    1. Muntean AG, Hess JL. The pathogenesis of mixed-lineage leukemia. Annu. Rev. Pathol. 2012;7:283–301. doi: 10.1146/annurev-pathol-011811-132434. - DOI - PMC - PubMed
    1. Pieters R, et al. A treatment protocol for infants younger than 1 year with acute lymphoblastic leukaemia (Interfant-99): an observational study and a multicentre randomised trial. Lancet. 2007;370:240–250. doi: 10.1016/S0140-6736(07)61126-X. - DOI - PubMed
    1. Pui CH, et al. Treating childhood acute lymphoblastic leukemia without cranial irradiation. N. Engl. J. Med. 2009;360:2730–2741. doi: 10.1056/NEJMoa0900386. - DOI - PMC - PubMed
    1. Andersson AK, et al. The landscape of somatic mutations in infant MLL-rearranged acute lymphoblastic leukemias. Nat. Genet. 2015;47:330–337. doi: 10.1038/ng.3230. - DOI - PMC - PubMed
    1. Driessen EMC, et al. Frequencies and prognostic impact of RAS mutations in MLL-rearranged acute lymphoblastic leukemia in infants. Haematologica. 2013;98:937–944. doi: 10.3324/haematol.2012.067983. - DOI - PMC - PubMed

Publication types

Substances