. 2018 May 2;8(1):6905.
doi: 10.1038/s41598-018-24728-x.

Cytoglobin affects tumorigenesis and the expression of ulcerative colitis-associated genes under chemically induced colitis in mice

Affiliations

Cytoglobin affects tumorigenesis and the expression of ulcerative colitis-associated genes under chemically induced colitis in mice

Mohammad Yassin et al. Sci Rep. .

Abstract

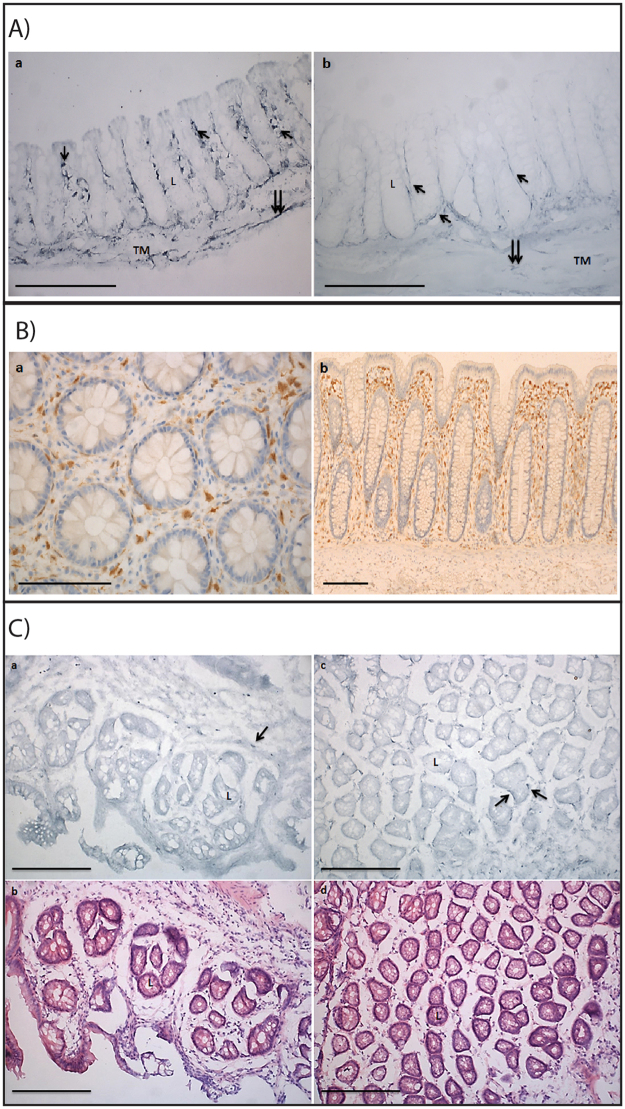
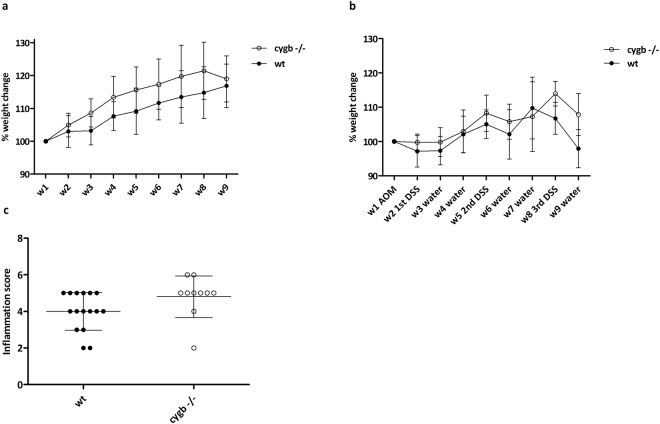
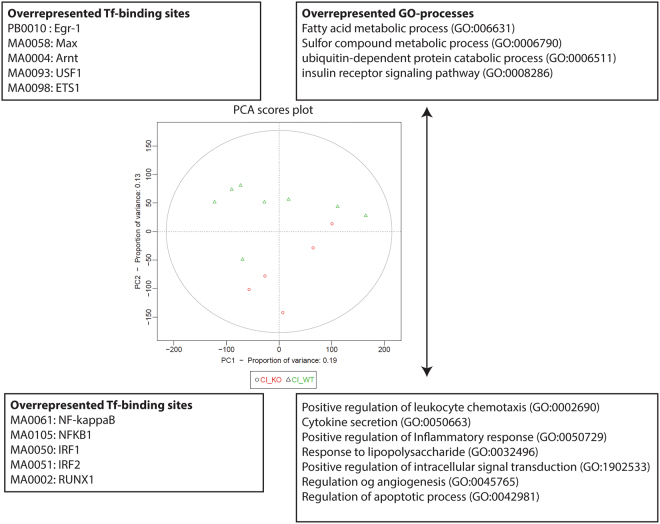
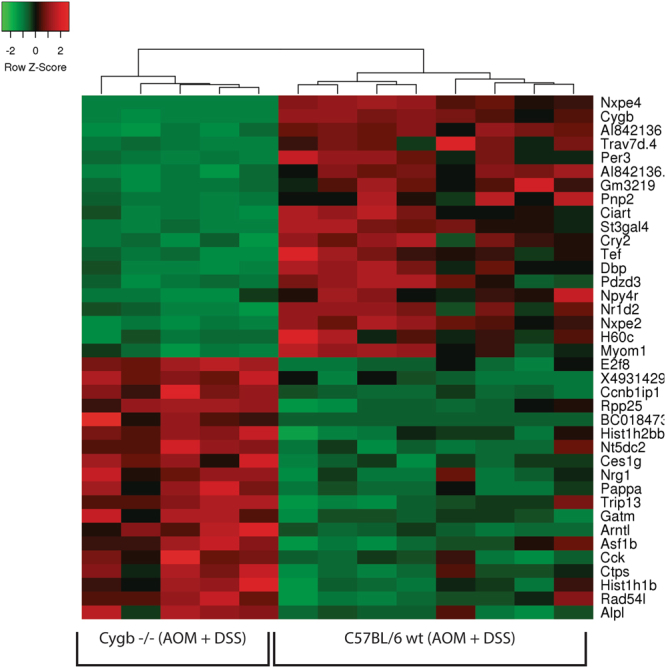
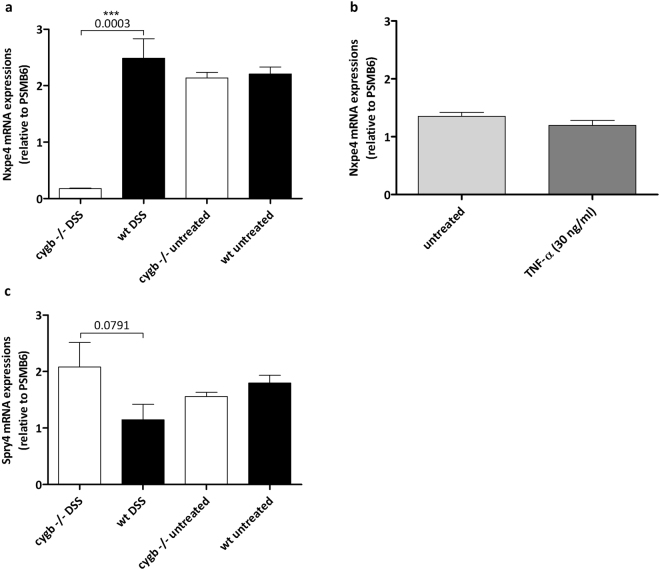
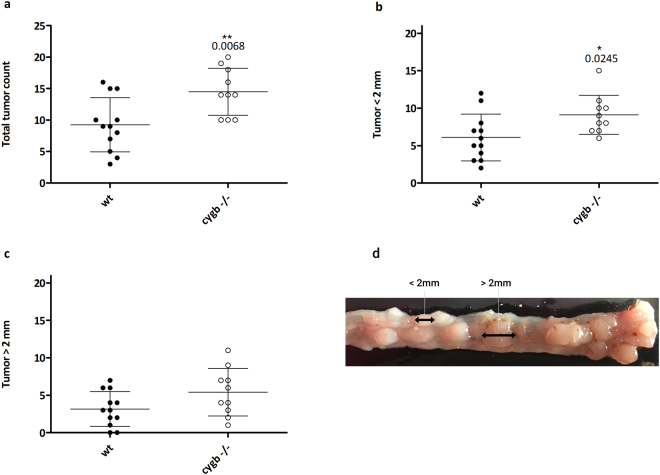
Cytoglobin (Cygb) is a member of the hemoglobin family and is thought to protect against cellular hypoxia and oxidative stress. These functions may be particularly important in inflammation-induced cancer, e.g., in patients with ulcerative colitis (UC). In this study, we investigated the development of inflammation and tumors in a murine model of inflammation-induced colorectal cancer using a combined treatment of azoxymethane and dextran sulfate sodium. A bioinformatics analysis of genome-wide expression data revealed increased colonic inflammation at the molecular level accompanied by enhanced macroscopic tumor development in Cygb-deficient mice. Moreover, the expression of the UC-associated gene neurexophilin and PC-esterase domain family member 4 (Nxpe4) depended on the presence of Cygb in the inflamed colonic mucosa. Compared to wild type mice, RT-qPCR confirmed a 14-fold (p = 0.0003) decrease in Nxpe4 expression in the inflamed colonic mucosa from Cygb-deficient mice. An analysis of Cygb protein expression suggested that Cygb is expressed in fibroblast-like cells surrounding the colonic crypts. Histological examinations of early induced lesions suggested that the effect of Cygb is primarily at the level of tumor promotion. In conclusion, in this model, Cygb primarily seemed to inhibit the development of established microadenomas.


Conflict of interest statement

The authors declare no competing interests.

Figures

Figure 1
Figure 1
Cygb, Ck20, and TNF-α mRNA expression levels. (a) Timeline of the AOM/DSS treatment. Mice were injected i.p. with AOM (7.4 mg/kg), followed by three cycles of 3% DSS in weeks 2, 5 and 8. (b) Cygb mRNA expression in cultured organoids from isolated WT colonic epithelial crypts (n = 6), AOM/DSS-treated colonic tissue from week 7 (n = 8) and untreated control WT mice (n = 8). Real-time RT-qPCR was performed to quantify Cygb mRNA expression levels, which were normalized to that of PSMB6. (c) Cygb mRNA expression in colonic organoids from WT C57BL/6 mice that were untreated (n = 6) or treated with 30 ng/ml TNF-α (24 h) (n = 6). (d) Ck20 mRNA expression in AOM/DSS-treated colonic tissue from week 7, WT (n = 8), Cygb−/− (n = 5) and untreated control WT (n = 8) and Cygb−/− mice (n = 8). (e) TNF-α mRNA expression in AOM/DSS-treated colonic tissue from week 7, WT (n = 8), Cygb−/− (n = 5) and untreated control WT (n = 8) and Cygb−/− mice (n = 8). Data are shown as the mean ± SEM. Statistical analysis was performed using Student’s t-test, and P values are shown. P values < 0.05 were considered statistically significant.
Figure 2
Figure 2
Cytoglobin protein expression in mouse and human colon. (A) Cygb-ir in healthy and inflamed C57BL/6 WT mouse colon tissue. (a) Longitudinal section of colonic crypts from untreated mice. (b) Longitudinal section of colonic crypts from week 7 AOM/DSS-treated mice. Single arrows indicate cells with Cygb-ir along Lieberkühn crypts. Double arrows indicate cells with Cygb-ir in tunica muscularis. L: Lieberkühn crypt, TM: tunica muscularis. 20x magnification, scale bars represent 200 µm. (B) Cygb expression in normal human colon tissue with hematoxylin counterstaining. No Cygb-ir was observed in the crypts. (a) Cross section, 40x magnification b) Longitudinal section, 5x magnification. Scale bar represents 200 µm. (C) Cygb-ir in AOM/DSS-treated C57BL/6 WT mouse colon tissue. (a) Cygb-ir in inflamed area with adenoma. (b) H&E staining of area with adenoma. (c) Cygb-ir in inflamed area without adenoma. (d) H&E staining of area without adenoma. Arrows indicate cells with Cygb-ir. L: Lieberkühn crypt. 20x magnification, Scale bars represent 200 µm.
Figure 3
Figure 3
The effect of Cygb on body weight and colon inflammation in AOM/DSS-induced colitis. (a) Percentage body weight change relative to week 1 in untreated WT (n = 8) and Cygb−/− mice (n = 8). (b) Percentage body weight change relative to week 1 baseline weight. Female WT (n = 10) and Cygb−/− mice (n = 11) after 3 cycles of 3% DSS for 7 days followed by 14 days with tap water. (c) Colitis score in non-cancerous tissue in the distal colons after 2 cycles of 3% DSS (week 7) in AOM/DSS-treated WT (n = 8) and Cygb−/− (n = 5) mice. The results are presented as the mean ± SD.
Figure 4
Figure 4
PCA score plot of inflamed colon tissue samples. RNA was extracted from chronically inflamed colons (7 weeks, second DSS cycle) of Cygb−/− mice (chronic inflammation knockout: CI_KO, red circles, n = 5) and from WT mice (chronic inflammation wild type: CI_WT, green triangles, n = 8) and subjected to a microarray analysis (Affymetrix Mouse Gene 2.0 ST array). An unsupervised multivariate analysis followed by GO and promoter overrepresentation analyses were conducted using the pcaGoPromoter package. The score plot of the first two PCs are shown. The variation represented by the second PC (the Y-axis) is correlated with the Cygb genotype. The most important GO terms associated with each direction of the second PC axis are shown together with the most important overrepresented predicted transcription factor binding sites in the promoters of the genes defining either direction of the second PC axis. The results suggest that more-severe inflammation was present in Cygb−/− mice than in WT mice.
Figure 5
Figure 5
A heatmap depicting the relative expression of the top list of genes (rows) that are either highest expressed (red color) in the wild type mice or in the Cygb−/− mice during AOM/DSS-induced colitis. Gene symbols are shown to the right. Each column represents an individual mouse.
Figure 6
Figure 6
Nxpe4 and Spry4 mRNA expression levels. (a) Nxpe4 mRNA expression in colon tissue from week 7 AOM/DSS-treated C57BL/6 mice, WT (n = 8), Cygb−/− (n = 5), untreated control WT (n = 8) and Cygb−/− mice (n = 8). (b) Nxpe4 mRNA expression in cultured organoids from isolated WT colonic epithelial crypts, untreated colonic epithelial crypts (n = 6) and colonic epithelial crypts treated with 30 ng/ml TNF-α (24 h) (n = 6). (c) Spry4 mRNA expression in colon tissue from week 7 AOM/DSS-treated C57BL/6 mice, WT (n = 8), Cygb−/− (n = 5), untreated control WT (n = 8) and Cygb−/− mice (n = 8). Data are shown as the mean ± SEM. Statistical analysis was performed using Student’s t-test, and P values are shown. P values < 0.05 were considered statistically significant.
Figure 7
Figure 7
Early adenomas in Cygb-deficient mice. Colons were pinned onto a plate, stained with methylene blue, and then total adenomas (a) and adenomas >1 mm (b) were counted under a stereomicroscope. After this procedure, colons were stained with HID-AB, and both total adenomas (c) and adenomas >1 mm (d) were counted again. Each dot represents an individual mouse. The results are presented as the mean ± SD. No significant differences were found between WT and Cygb−/− mice. The experiment was initiated by AOM injection followed by one cycle of 3% DSS in week 2 for seven days. All mice were euthanized at the end of week 5, three weeks after the end of the DSS cycle.
Figure 8
Figure 8
Tumorigenesis in Cygb-deficient mice. (a) Comparison of the total numbers of macroscopic tumors in WT (n = 12) and Cygb−/− mice (n = 10). (b) Tumors <2 mm in WT and Cygb−/− mice. (c) Tumors >2 mm in WT and Cygb−/− mice. (d) A representative image of distal colonic tumors (<2 mm and >2 mm) from an AOM/DSS-treated mouse colon. Each dot represents an individual mouse. The results are presented as the mean ± SD. Statistical analysis was performed using Student’s t-test, and P values are shown. The experiment was initiated by AOM injection, followed by three cycles of 3% DSS for 7 days/cycle in weeks 2, 5 and 8. All mice were euthanized in week 10, two weeks after the end of the third DSS cycle.

Similar articles

Cited by

References

    1. Sugimoto H, et al. Structural basis of human cytoglobin for ligand binding. J Mol Biol. 2004;339:873–885. doi: 10.1016/j.jmb.2004.04.024. - DOI - PubMed
    1. Chakraborty S, John R, Nag A. Cytoglobin in tumor hypoxia: novel insights into cancer suppression. Tumour Biol. 2014;35:6207–6219. doi: 10.1007/s13277-014-1992-z. - DOI - PubMed
    1. Li Z, et al. The Effect of rhCygb on CCl4-Induced Hepatic Fibrogenesis in Rat. Sci Rep. 2016;6:23508. doi: 10.1038/srep23508. - DOI - PMC - PubMed
    1. Tae, B. et al. Evaluation of globins expression in brain, heart, and lung in rats exposed to side stream cigarette smoke. Environmental toxicology, 10.1002/tox.22321 (2016). - PubMed
    1. O’Farrell NJ, et al. Changes in mitochondrial stability during the progression of the Barrett’s esophagus disease sequence. BMC cancer. 2016;16:497. doi: 10.1186/s12885-016-2544-2. - DOI - PMC - PubMed

Publication types

MeSH terms