. 2018 May;557(7704):183-189.
doi: 10.1038/s41586-018-0078-2. Epub 2018 May 2.

A midline thalamic circuit determines reactions to visual threat

Affiliations

A midline thalamic circuit determines reactions to visual threat

Lindsey D Salay et al. Nature. 2018 May.

Abstract

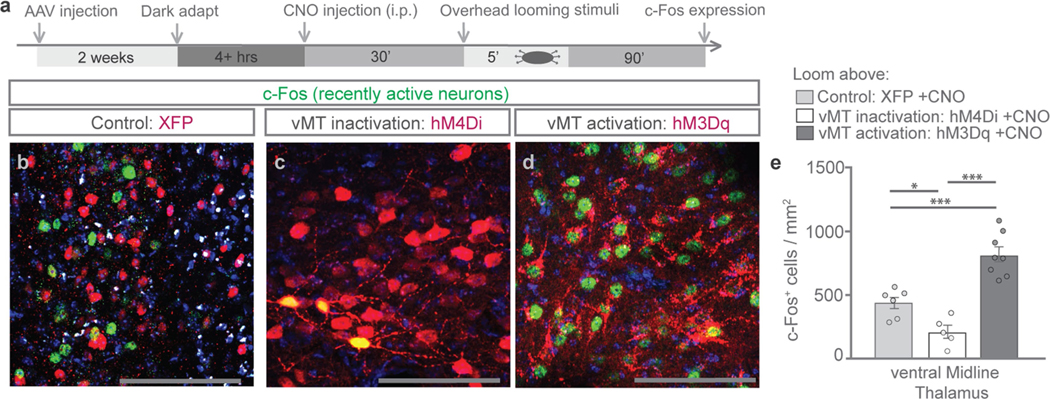
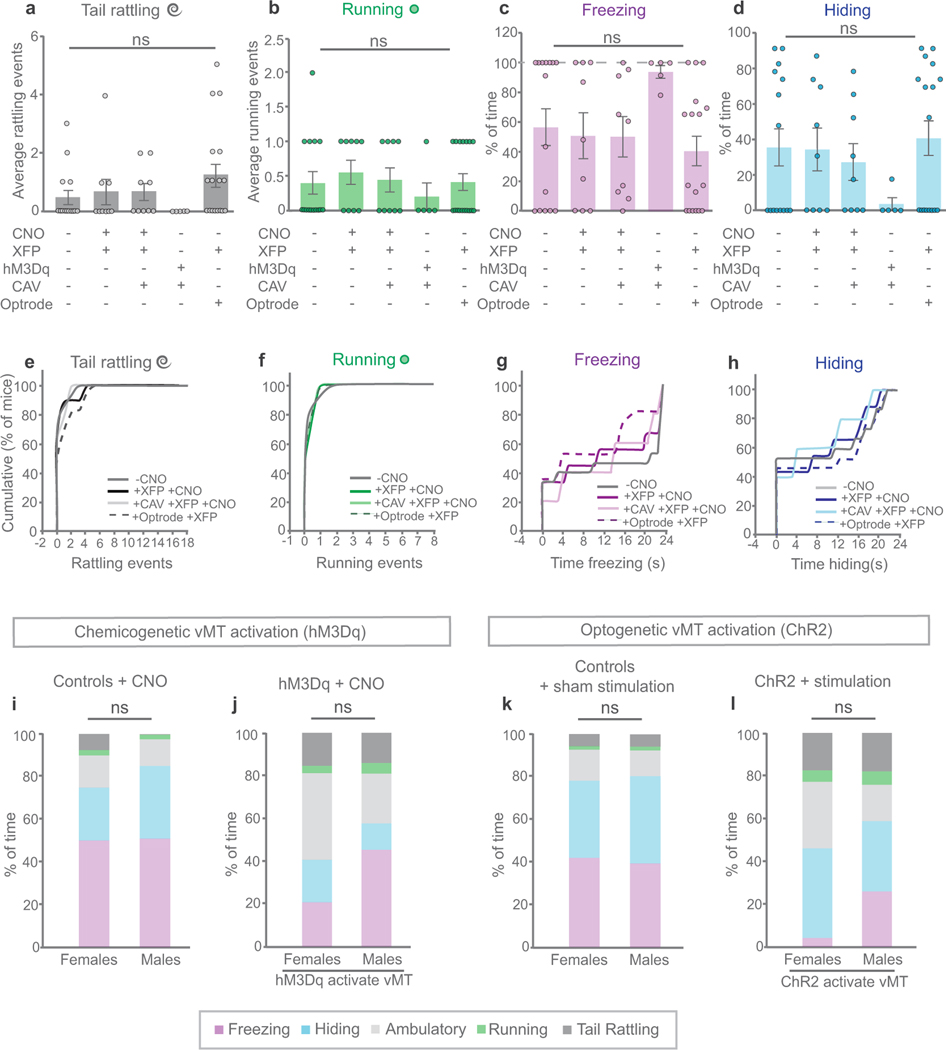
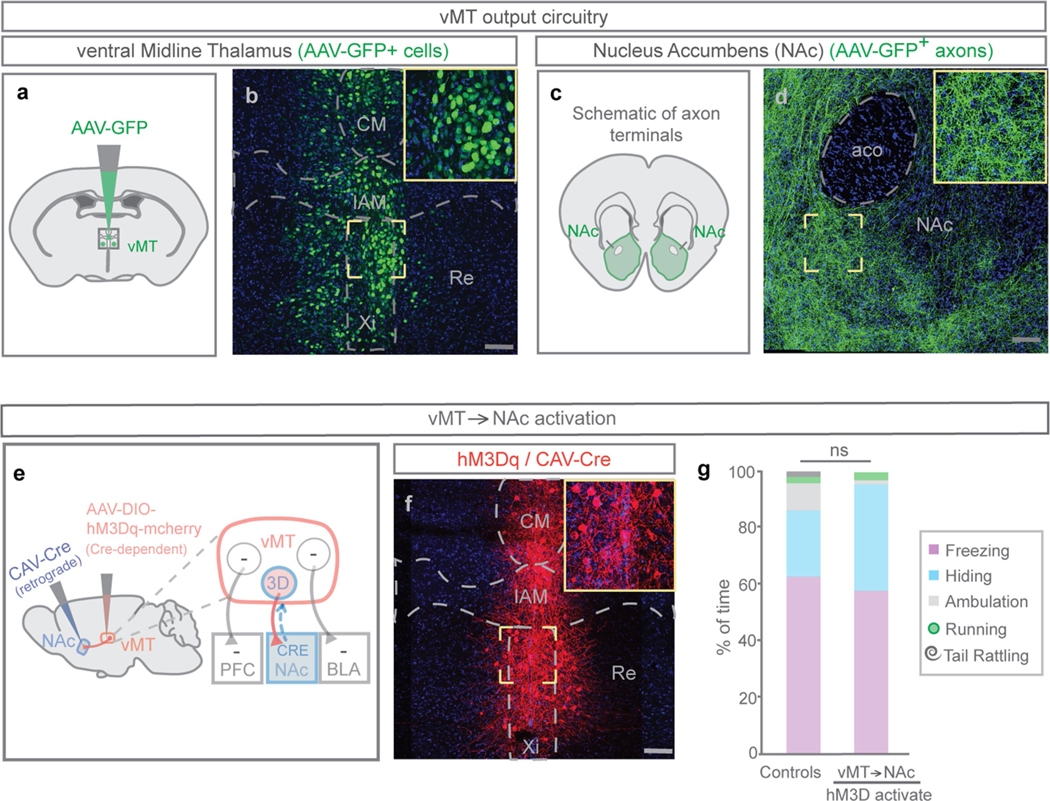
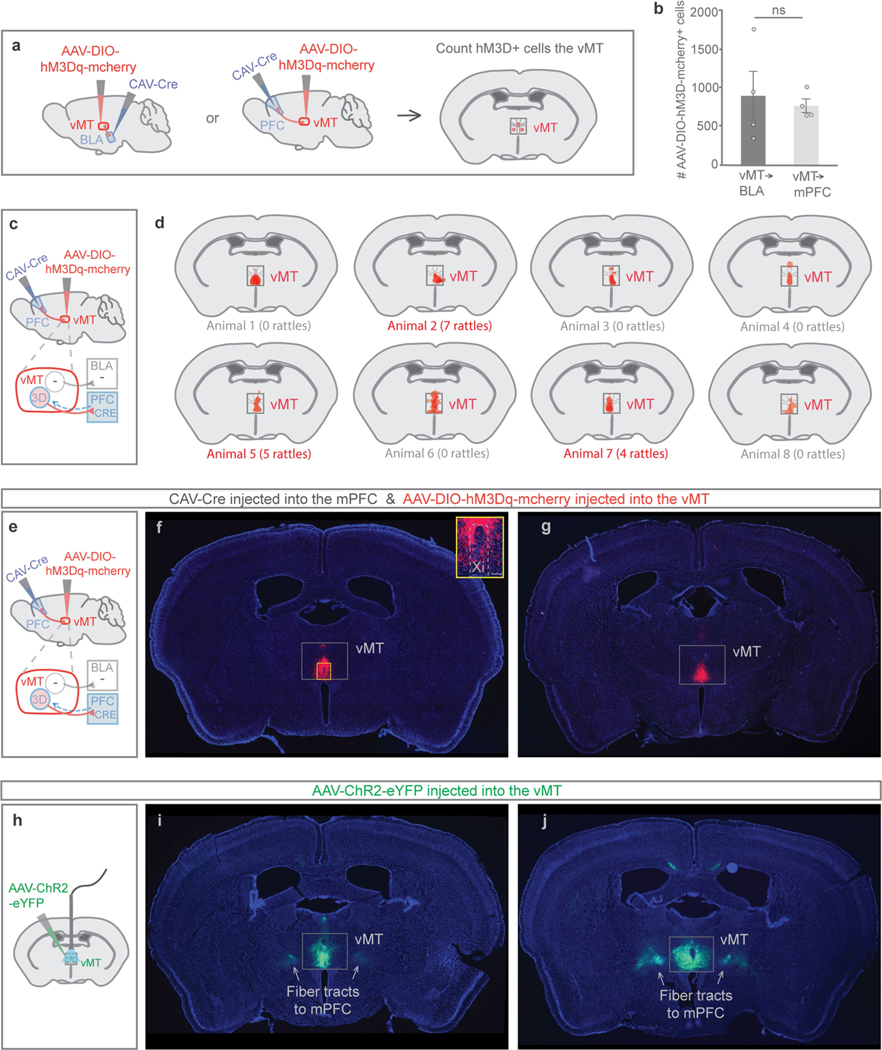
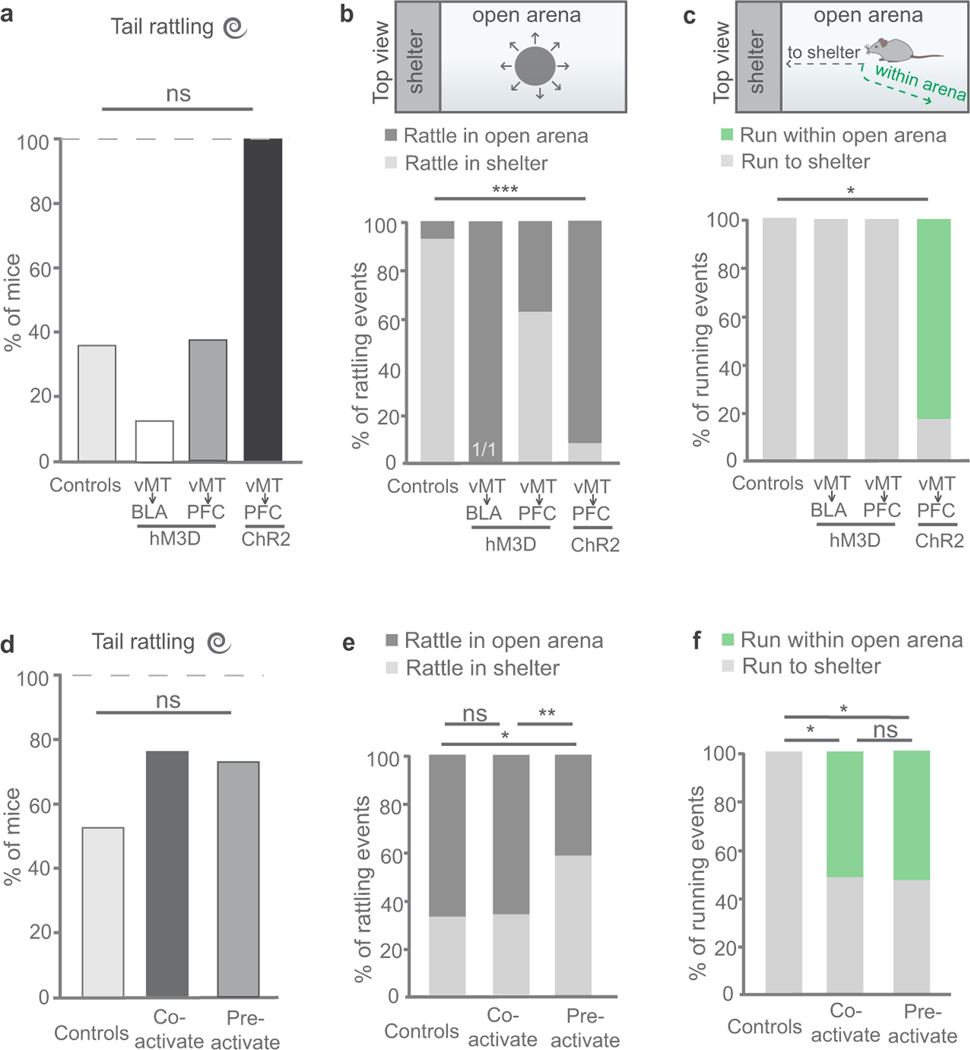
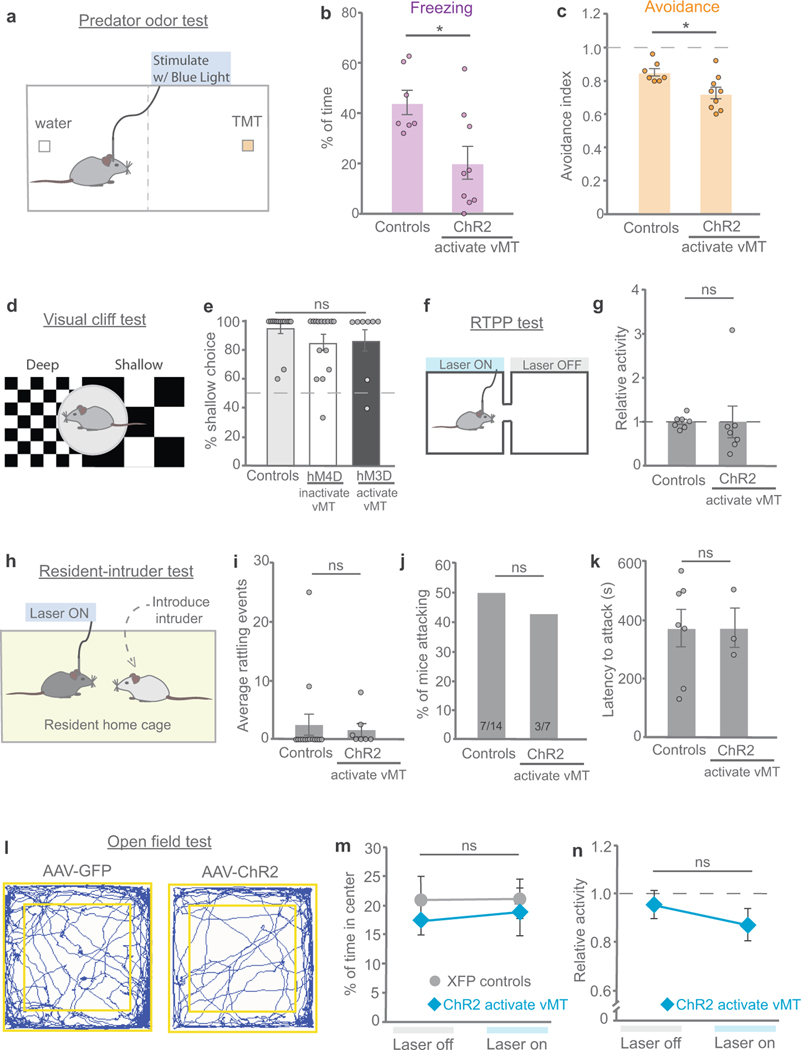
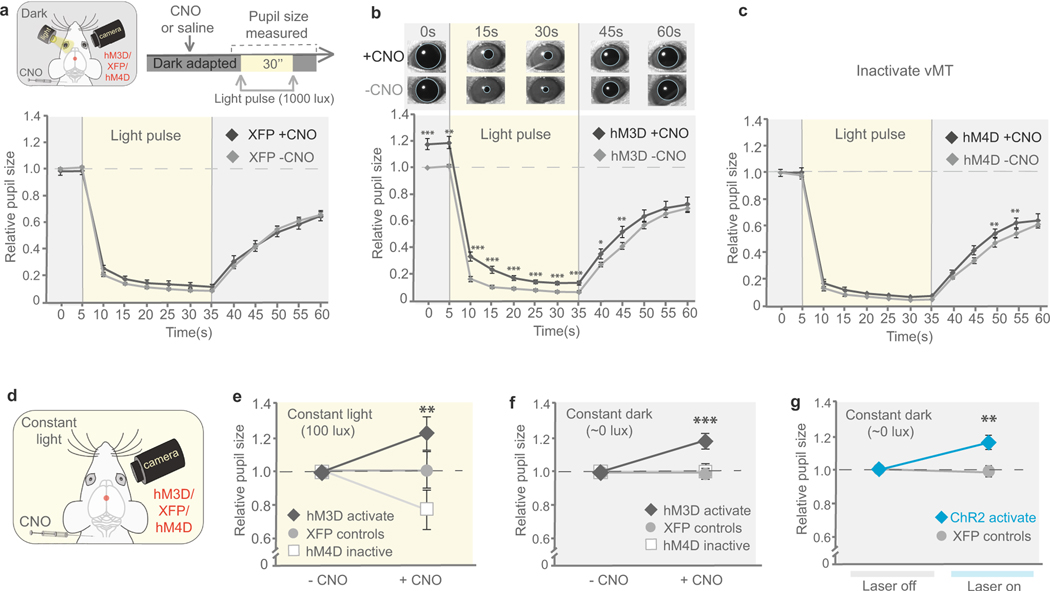
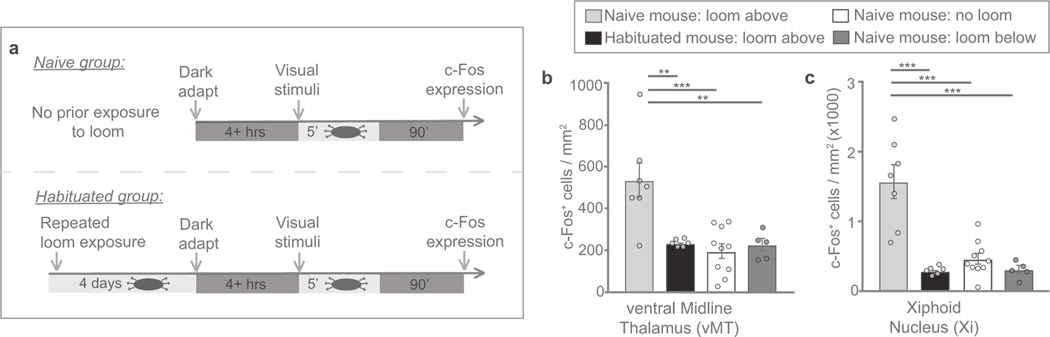
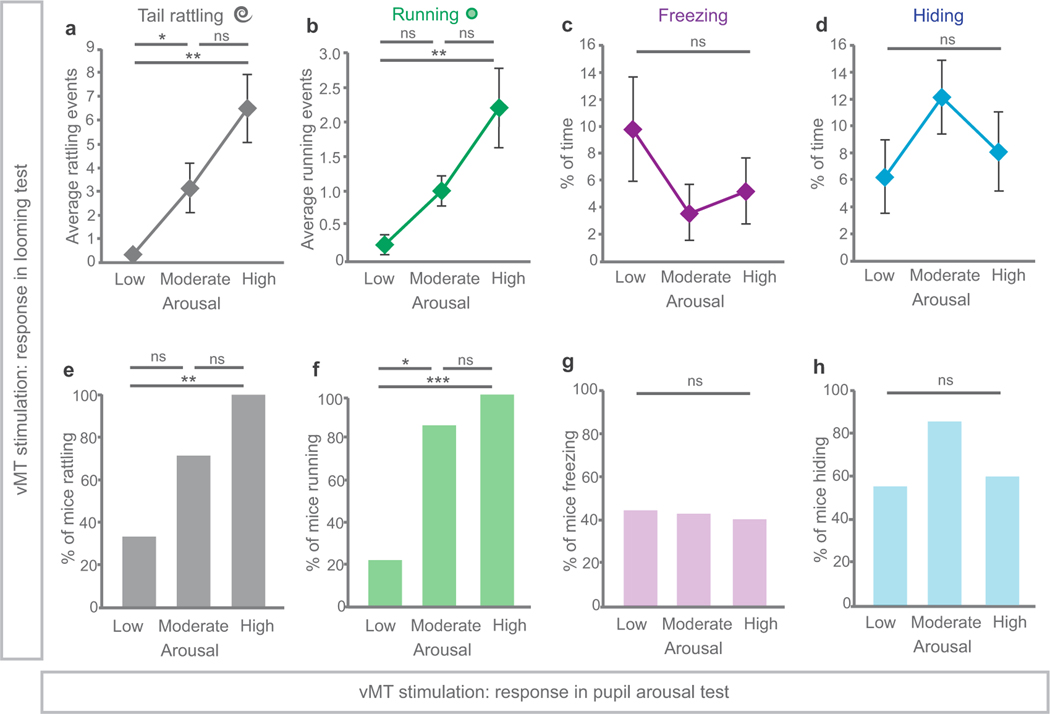
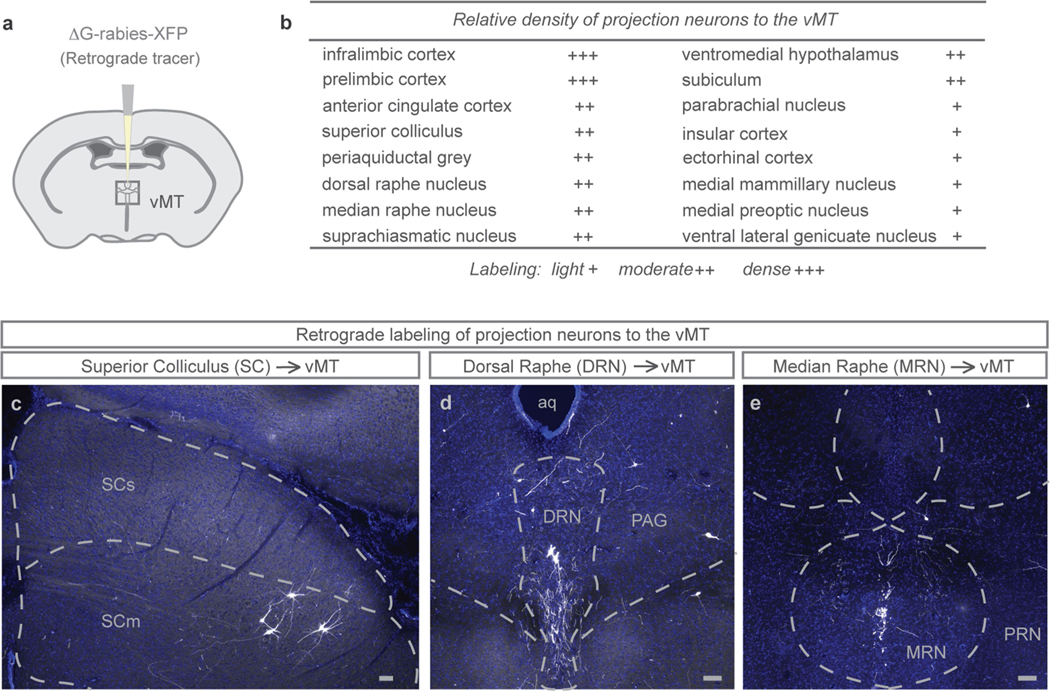
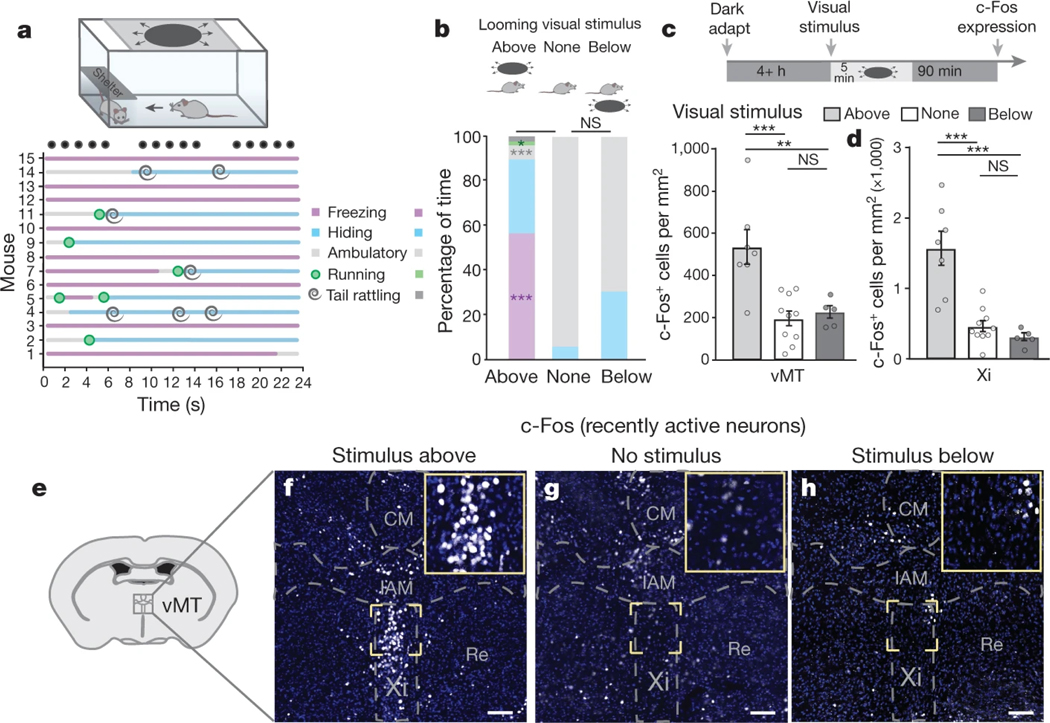
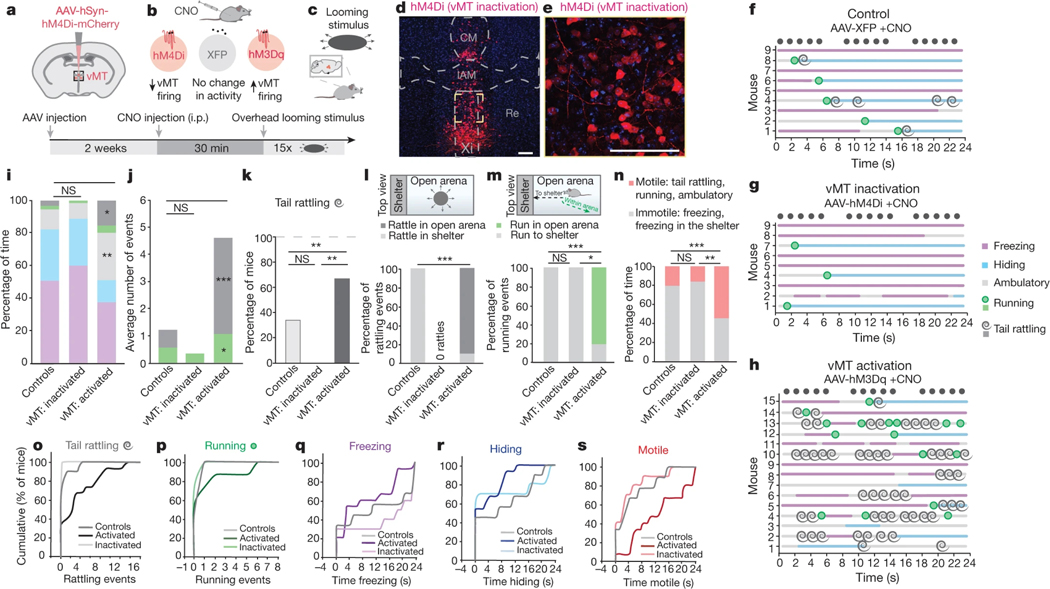
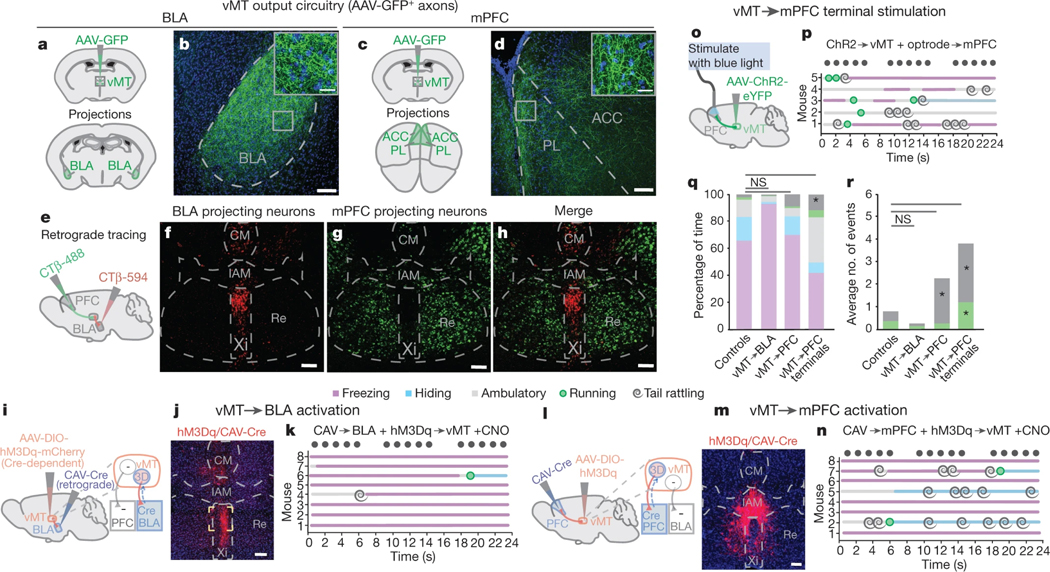
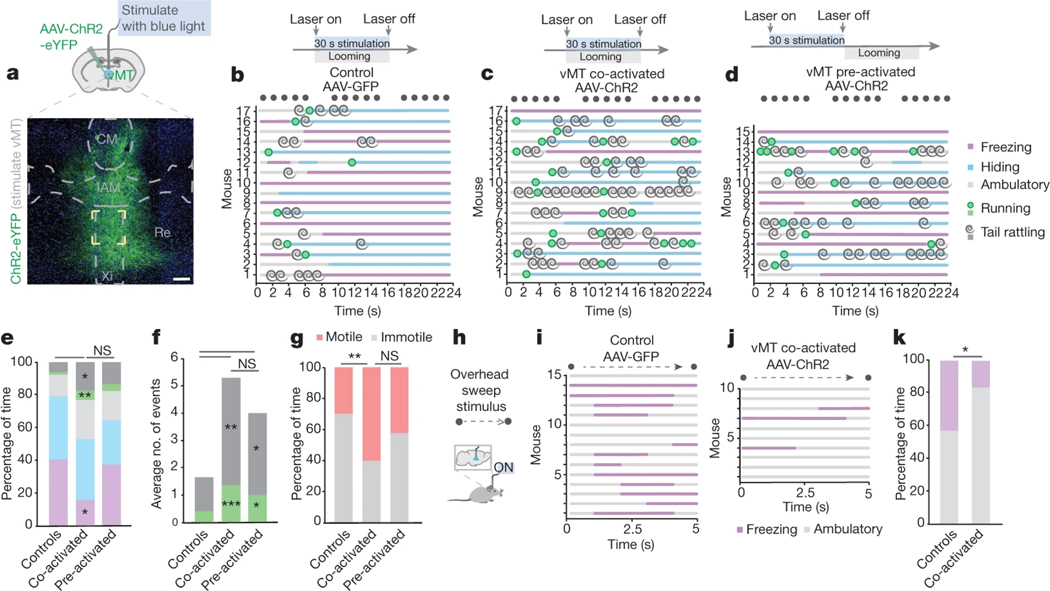
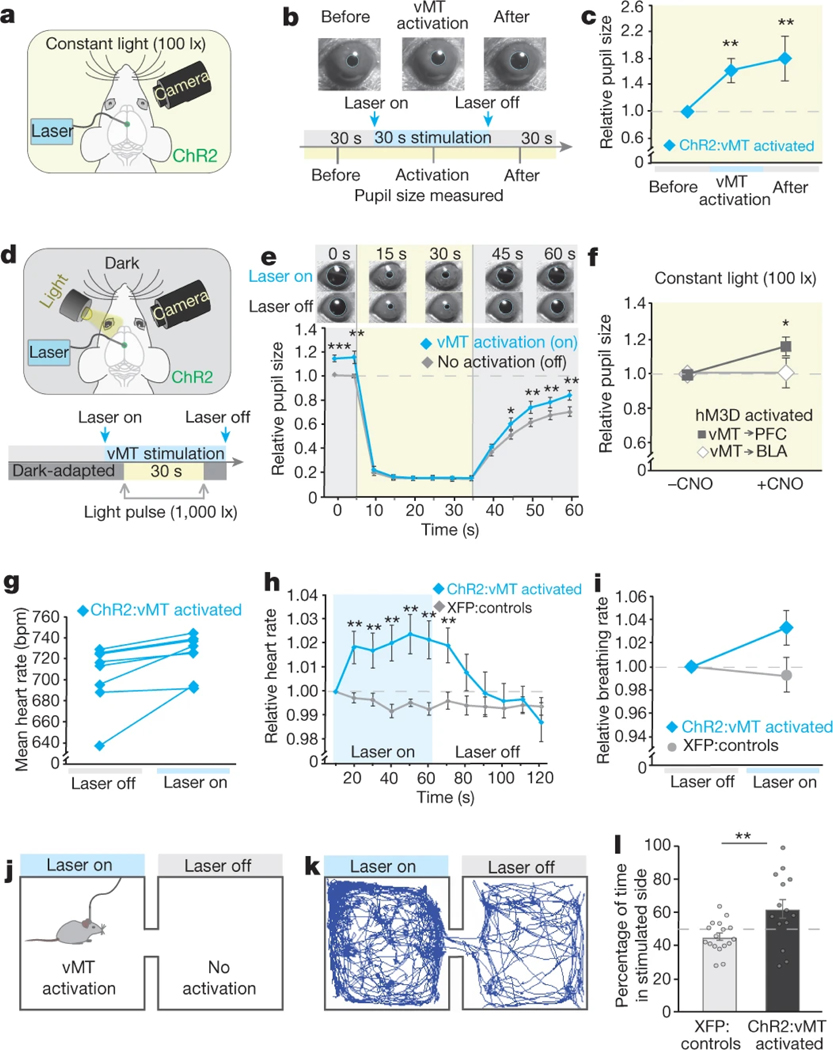
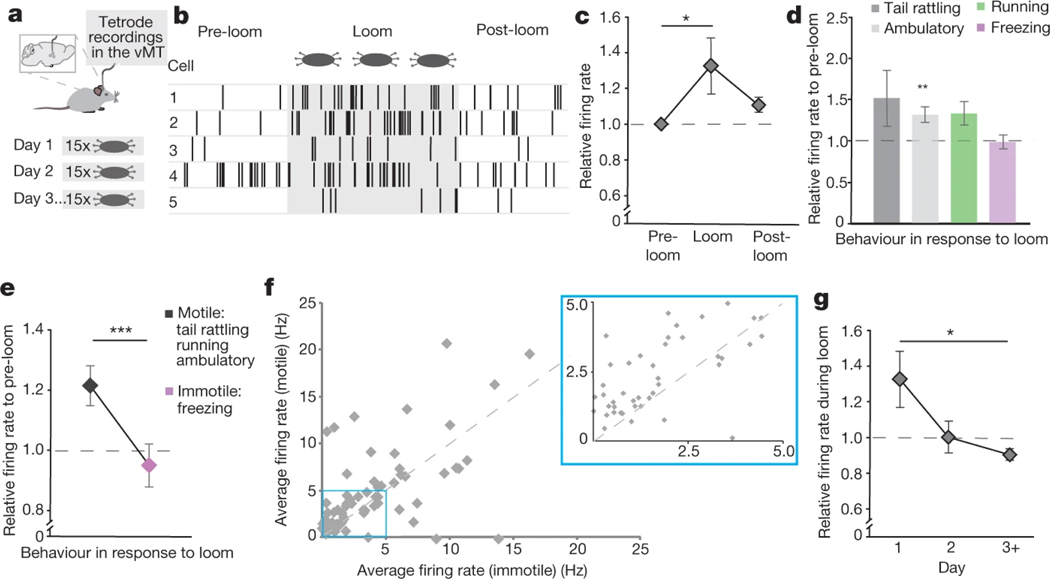
How our internal state is merged with our visual perception of an impending threat to drive an adaptive behavioural response is not known. Mice respond to visual threats by either freezing or seeking shelter. Here we show that nuclei of the ventral midline thalamus (vMT), the xiphoid nucleus (Xi) and nucleus reuniens (Re), represent crucial hubs in the network controlling behavioural responses to visual threats. The Xi projects to the basolateral amygdala to promote saliency-reducing responses to threats, such as freezing, whereas the Re projects to the medial prefrontal cortex (Re→mPFC) to promote saliency-enhancing, even confrontational responses to threats, such as tail rattling. Activation of the Re→mPFC pathway also increases autonomic arousal in a manner that is rewarding. The vMT is therefore important for biasing how internal states are translated into opposing categories of behavioural responses to perceived threats. These findings may have implications for understanding disorders of arousal and adaptive decision-making, such as phobias, post-traumatic stress and addictions.


Figures

Extended Data Fig. 1 |
Extended Data Fig. 1 |. hM3Dq activates vMT, whereas hM4Di inactivates vMT.
Refers to Figs. 1 and 2. a, Timeline of the c-Fos induction protocol. bd, Recently active c-Fos+ neurons (green) in the vMT of mice that were exposed to the looming stimulus, with XFP (b), hM4Di (c), or hM3Dq (d) injections (red) into the vMT and CNO delivered intraperitoneally. e, After CNO delivery, hM3Dq increased whereas hM4Di decreased the number of c-Fos+ cells in the vMT relative to XFP controls. Scale bars, 100 μm. Data are mean ± s.e.m. *P < 0.05, ***P < 0.001. See Supplementary Table 1 for statistical analysis and sample sizes.
Extended Data Fig. 2 |
Extended Data Fig. 2 |. Control groups do not differ in their defensive responses to looming threat.
Refers to Figs. 2–4. ah, Comparison of different control mice reveals no significant differences across any of the behaviours performed in response to the looming threat: tail rattling (a, e), running (b, f), freezing (c, g), or hiding (d, h). Controls include: mice with no treatments; mice with AAV-XFP and CNO; mice with CAV-Cre, AAV-DIO-XFP and CNO; mice with CAV-Cre and AAV-DIO-hM3Dq but without CNO; and mice with AAV-XFP, optrode implant and sham stimulation. il, Comparison of male and female control mice (i, k) and mice with vMT activation (j, l) reveals no significant sex differences across any of the behaviours performed in response to the looming threat. Notably, both male and female mice tail-rattle in response to the looming threat. Data are mean ± s.e.m.; NS, not significant. See Supplementary Table 1 for statistical analysis and sample sizes.
Extended Data Fig. 3 |
Extended Data Fig. 3 |. Activating vMT→NAc does not increase tail rattling or saliency-enhancing behaviours.
Refers to Fig. 3. ad, Mice were injected with AAV-GFP in the vMT (n = 17 mice; a, b) and axons were observed in the NAc (c, d). Representative image of GFP+ neurons in the VMT (b) and GFP+ axons in the NAc (d). e, To activate vMT neurons that project to the NAc, CAV-Cre was injected into the NAc and Cre-dependent hM3Dq was injected into the vMT. f, Representative image of hM3Dq+ neurons in the vMT that project to the NAc. g, Activating the vMT→NAc pathway did not significantly change the behavioural responses to looming as compared to controls. Scale bars, 100 μm. Data are mean ± s.e.m.; NS, not significant. See Supplementary Table 1 for statistical analysis and sample sizes.
Extended Data Fig. 4 |
Extended Data Fig. 4 |. Viral targeting and number of cells infected in the vMT.
Refers to Figs. 3 and 4. a, To activate vMT neurons that project to the mPFC or the BLA, CAV-Cre was injected into the mPFC or the BLA and Cre-dependent hM3D was injected into the vMT. b, The average number of infected hM3d–mCherry+ vMT cells did not differ between the vMT→BLA and the vMT→mPFC pathway activation groups. c, e, Locations of injections to activate the vMT→mPFC pathway. d, Relative expression of hM3D in vMT→mPFC cells does not scale with tail-rattling behaviour. f, g, Representative images of hM3dq– mCherry/Cre+ neurons (red) in the vMT that project to the mPFC. h, Mice were injected with AAV-ChR2 in the vMT to activate the vMT. i, j, Representative images of ChR2–eYFP+ neurons (green) in the vMT and the fibre tracts composed of vMT axons that project to the mPFC. Data are mean ± s.e.m.; NS, not significant. See Supplementary Table 1 for statistical analysis and sample sizes.
Extended Data Fig. 5 |
Extended Data Fig. 5 |. vMT activation results in saliency-enhancing behaviours performed in the open arena.
Refers to Figs. 3 and 4. a, Percentage of mice tail-rattling in response to looming after vMT→PFC or vMT→BLA activation. All of the mice with vMT→mPFC optogenetic stimulation displayed tail-rattling behaviour. b, c, Percentage of tail-rattling (b) or running (c) events performed in the open arena as opposed to in the shelter. Mice with vMT→ mPFC optogenetic stimulation perform most tail-rattling and running events in the open. d, Optogenetic activation of the vMT results in most mice tail-rattling. e, Mice with vMT optogenetic stimulation perform most tail-rattling events in the open arena as opposed to in the shelter. f, Mice with vMT optogenetic stimulation perform most running events within the open arena as opposed to towards the shelter. Data are mean ± s.e.m. *P < 0.05, **P < 0.01, ***P < 0.001; NS, not significant. See Supplementary Table 1 for statistical analysis and sample sizes.
Extended Data Fig. 6 |
Extended Data Fig. 6 |. vMT activation does not change locomotion, aggression or anxiety, but does result in less freezing in response to a predator odour.
Refers to Figs. 4 and 5. a, Mice were injected with AAV-ChR2 in the vMT in order to activate the vMT during presentation of the predator-odour threat. b, Activating the vMT (n = 9 mice) decreased freezing as compared to controls with sham stimulation (n = 7 mice). c, Activating the vMT decreased avoidance as compared to controls with sham stimulation (avoidance index = (P − 50)/50, where P is the percentage of time the mouse spent on the side of the arena away from the odour). d, The visual cliff test. e, Activating the vMT (hM3D + CNO, n = 15 mice) or inactivating the vMT (hM4D + CNO, n = 9) during the visual cliff test did not change the number of times in which the mouse chose the shallow side as compared to control mice (n = 9 mice, P < 0.05). f, The RTPP test. g, Activating the vMT (ChR2, n = 7 mice) did not change the relative activity (distance covered) in the RTPP test as compared to control mice (n = 6 mice). h, Mice were tested on the resident-intruder test for aggressive behaviours. i, Activating the vMT (ChR2, n = 7 mice) did not change the average number of tail-rattling events in the resident-intruder test as compared to control mice (n = 14 mice). j, k, Activating the vMT (ChR2, n = 7 mice) did not change the percentage of mice attacking (j) or the latency to attack (k) in the resident-intruder test as compared to control mice (n = 14 mice). l, Mice were subjected to an open field test to analyse anxiety-related behaviour; representative tracing of a control mouse (AAV-GFP, left) and a mouse with vMT activation (AAV-ChR2, right) in the open field test. m, Activating the vMT (ChR2, n = 10 mice) did not change the percentage of time in the centre of the open field as compared to control mice (n = 10 mice). n, Activating the vMT (ChR2, n = 10 mice) did not change the relative activity (distance covered) in the open field test as compared to control mice (n = 10 mice). Data are mean ± s.e.m. *P < 0.05; NS, not significant. See Supplementary Table 1 for statistical analysis and sample sizes.
Extended Data Fig. 7 |
Extended Data Fig. 7 |. vMT activation results in increased arousal.
Refers to Fig. 5. a, Schematic of the experimental set-up to analyse light-driven pupillary responses in mice. Treating control mice with CNO did not change pupil size across all light levels. b, Chronic vMT activation by chemicogenetic methods (+CNO) significantly increases pupil size across all light levels as compared to the same mice without activation (−CNO). c, Chronic vMT inactivation (+CNO) did not the change pupil size across all light levels as compared to the same mice without activation (−CNO). d, Schematic of experimental set-up to analyse arousal-driven pupillary responses in mice with vMT activation, mice with vMT inactivation and control mice. The pupil was measured in constant light (100 lx) conditions in mice with and without CNO. e, After CNO delivery, mice with hM3Dq had a significant increase in relative pupil size. Mice with XFP and hM4Di did not have a significant change in pupil size after administration of CNO. f, In constant dark conditions, vMT activation significantly increased pupil size, whereas vMT inactivation did not change pupil size as compared to control mice with CNO. g, In constant dark conditions, optogentic activation of the vMT significantly increased pupil size (n = 11 mice) compared to control mice (n = 12 mice). Data are mean ± s.e.m. *P < 0.05; **P < 0.01; ***P < 0.001; NS, not significant. See Supplementary Table 1 for statistical analysis and sample sizes.
Extended Data Fig. 8 |
Extended Data Fig. 8 |. Looming stimuli induce vMT activation in naive, but not experienced mice habituated to looms.
Refers to Fig. 6. a, Schematic of the experimental protocol. b, c, Quantification of c-Fos+ cells in the vMT of naive or pre-exposed mice that experienced looming from above revealed a significant decrease in c-Fos+ cells in the vMT (b) and Xi (c) after looming from above in pre-exposed mice that are habituated to the looms (n = 6 mice) as compared to naive mice (n = 7 mice). Data are mean ± s.e.m. **P < 0.01; ***P < 0.001. Supplementary Table 1 for statistical analysis and sample sizes.
Extended Data Fig. 9 |
Extended Data Fig. 9 |. Tail rattling and running scales with arousal.
Refers to Figs. 4 and 5. a, b, Mice in which ChR2 had been injected into the vMT were divided into three groups based on the extent to which vMT activation increased arousal responses: low, moderate or high (n = 7, n = 9 and n = 10 mice, respectively). Mice with high arousal had significantly more tail-rattling (a) and running (b) events in response to looming, as compared to mice with low arousal (P < 0.001 and P < 0.001). c, d, Mice with high arousal spent similar amounts of time freezing (c) and hiding (d) in response to looming, as compared to mice with low arousal. e, f, 100% of mice with high arousal tail-rattled (e) and ran (f) in response to looming, whereas only 33% and 20% of mice with low arousal tail-rattled and ran, respectively. g, h, Similar numbers of mice with high arousal froze (g) and hid (h) in response to looming as compared to mice with low arousal. Data are mean ± s.e.m. *P < 0.05; **P < 0.01; ***P < 0.001; NS, not significant. See Supplementary Table 1 for statistical analysis and sample sizes.
Extended Data Fig. 10 |
Extended Data Fig. 10 |. Hindbrain inputs to the vMT.
a, Schematic illustration of ΔG-rabies-XFP injection into the vMT to map vMT inputs. b, Quantification of the relative density of projection neurons to the vMT (n = 12 mice). ce, Representative images showing the expression of ΔG-rabies-XFP in transynaptically labelled cells in the superior colliculus (c), dorsal raphe (d), periaqueductal grey (d), and median raphe (e). DRN, dorsal raphe; MRN, median raphe; PAG, periaqueductal grey; PRN, pontine reticular nucleus; SCm, superior colliculus, motor; SCs, superior colliculus, sensory. Scale bars, 100 μm.
Fig. 1 |
Fig. 1 |. Visual threat activates the ventral midline thalamus.
a, Ethogram of responses to a looming threat. Black circles represent the looming stimulus (15 expansions in 24 s). b, Behaviours in response to looming from above, no loom and looming from below. c, d, Looming from above, but not below, induces vMT c-Fos activation (c) and Xi activation (d) relative to no loom. e, Location of the ventral midline thalamus within the mouse brain. fh, c-Fos+ (white) neurons in the vMT after overhead looming (f), no looming stimulus (g) or looming from below (h). Scale bars, 100 μm. CM, central medial nucleus; IAM, intrantereomedial nucleus; Re, nucleus of reuniens; Xi, xiphoid nucleus. Data are mean ± s.e.m. *P < 0.05, **P < 0.01, ***P < 0.001; NS, not significant. See Supplementary Table 1 for further details of the statistical analyses.
Fig. 2 |
Fig. 2 |. vMT neurons modulate visual threat responses.
ac, Diagrams depicting different stages of the experimental protocol. i.p., intraperitoneal. d, hM4Di–mCherry+ cells (red) in the vMT. e, A zoomed-in view of the region outlined by a yellow square in d. Scale bars (d, e), 100 μm. fh, Ethograms of responses to overhead looming in control mice treated with CNO (f), mice with vMT inactivation (g) and mice with vMT activation (h). im, Effects of vMT activation or inactivation on the behavioural responses of mice. vMT inactivation eliminated tail rattling (il); vMT activation increased tail rattling (i, duration; j, incidence; k, percentage of mice) and running (i, duration; j, incidence) in the open arena (l, m). vMT activation increased ambulatory time in the open (i) and total motile behaviours (n) relative to control mice. os, Cumulative frequency distribution plots of behavioural responses. Data are mean ± s.e.m. *P < 0.05, **P < 0.01, ***P < 0.001; NS, not significant. See Supplementary Table 1 for further details of the statistical analyses.
Fig. 3 |
Fig. 3 |. Divergent vMT outputs influence threat responses.
ad, Mice were injected with AAV-GFP in the vMT (a, c; n = 17 mice) and axons (green) were observed in the BLA (b) and mPFC (d). e, Locations in the brain at which retrograde tracing was performed. fh, Retrograde labelled vMT→BLA (red, f), vMT→mPFC projection neurons (green, g), and the merged image (h); n = 5 mice. i, j, Injections (i) and representative image of hM3Dq/Cre+ neurons (red) in the vMT, projecting to the BLA (j). k, Ethogram of the responses to looming in mice when the vMT→BLA neurons are activated. l, m, Injections (l) and representative image of hM3D/Cre+ neurons (red) in the vMT that project to the mPFC (m). n, Ethogram of the responses to looming in mice with vMT→mPFC neurons activated. o, p, Schematic of injections (o) and ethogram of responses to looming in mice with vMT axon terminals activated in the mPFC (p). q, r. Activating the vMT→mPFC pathway, but not the vMT→BLA pathway, increases tail rattling (q, duration; r, incidence) relative to controls. BLA, basolateral amygdala; mPFC, medial prefrontal cortex; PL, prelimbic cortex; ACC, anterior cingulate cortex. Scale bars, 100 μm. Data are mean ± s.e.m. *P < 0.05, **P < 0.01; NS, not significant. See Supplementary Table 1 for further details of the statistical analyses.
Fig. 4 |
Fig. 4 |. Saliency-enhancing behaviours to threat persist after vMT stimulation.
a, Representative image of ChR2–eYFP+ cells in the vMT. Scale bars, 100 μm. bd, Ethograms of responses to looming in control mice (b), mice with vMT activated in concert with the loom (c, co-activated) and mice with vMT activated before the loom (d, pre-activated). eg, Co-activating and pre-activating the vMT increased tail rattling and running (e, duration; f, incidence). Co-activating the vMT decreased freezing (e) and increased total motile behaviours (g). h, Schematic of the overhead-sweep-stimulus experiment. ij, Ethograms of responses to the overhead sweep stimulus in control mice (i) and mice in which the vMT is activated during the sweep (j). k, Co-activating the vMT decreased freezing in response to the sweep. Data are mean ± s.e.m. *P < 0.05, **P < 0.01, ***P < 0.001. See Supplementary Table 1 for further details of the statistical analyses.
Fig. 5 |
Fig. 5 |. vMT activation increases arousal.
a, Schematic of experimental set-up to analyse arousal-driven pupillary responses to vMT stimulation. b, c, Pupil size in constant light (100 lx) conditions before, during and after vMT stimulation (n = 12 mice) relative to controls (n = 8 mice, dashed line in c). d, Schematic of experimental set-up to analyse light-driven pupillary responses in dark-adapted mice. e, Relative pupil size before, during and after a 30-s light pulse (1000 lx) in mice with and without vMT stimulation (n = 11 mice). f, Under constant light conditions, activating the vMT→mPFC pathway, but not the vMT→BLA pathway increased relative pupil size. gi, Heart rate (g, h) and breathing rate (i) in mice with and without vMT stimulation (n = 8 mice). j, Illustration of the RTPP test. k, Representative tracing of a mouse with vMT stimulation in the RTPP test. l, Mice with vMT activation (n = 14) spent more time in the stimulated side as compared to control mice (n = 17). Data are mean ± s.e.m. *P < 0.05, **P < 0.01, ***P < 0.001. See Supplementary Table 1 for further details of the statistical analyses.
Fig. 6 |
Fig. 6 |. vMT neurons are activated during saliency-enhancing behaviours.
a, Tetrode recordings in the vMT were performed during presentation of the looming stimulus. b, Sample raster plots of five isolated units before, during and after the looming stimulus. ce, Mean relative firing rates on the first day of loom presentation (c, 23 cells from 4 mice), during different behaviour epochs (d, 87 total cells from 4 mice) and during motile and immotile behaviours (e, 67 cells from 4 mice), relative to pre-loom (dashed line). f, Mean firing rates of all the recorded units during motile behaviour as compared to immotile behaviour in response to looms. Most of the points are above the y = x line. g, Mean relative firing rate across several days of looming presentation (87 total cells across 4 mice). Data are mean ± s.e.m. *P < 0.05, ***P < 0.001. See Supplementary Table 1 for further details of the statistical analyses.

Comment in

References

    1. Yilmaz M. & Meister M. Rapid innate defensive responses of mice to looming visual stimuli. Curr. Biol 23, 2011–2015 (2013). - PMC - PubMed
    1. Fanselow M. & Lester L. in Evolution and Learning (eds Bolles RC & Beecher MD) 185–212 (Lawrence Erlbaum Associates, Hillsdale, 1988).
    1. Eilam D. Die hard: a blend of freezing and fleeing as a dynamic defense—implications for the control of defensive behavior. Neurosci. Biobehav. Rev 29, 1181–1191 (2005). - PubMed
    1. Crawford M. & Masterson FA Species-specific defense reactions and avoidance learning. An evaluative review. Pavlov. J. Biol. Sci 17, 204–214 (1982). - PubMed
    1. Wei P. et al.Processing of visually evoked innate fear by a non-canonical thalamic pathway. Nat. Commun 6, 6756 (2015). - PMC - PubMed

Publication types