. 2018 May;557(7704):247-251.
doi: 10.1038/s41586-018-0075-5. Epub 2018 May 2.

De novo formation of the biliary system by TGFβ-mediated hepatocyte transdifferentiation

Affiliations

De novo formation of the biliary system by TGFβ-mediated hepatocyte transdifferentiation

Johanna R Schaub et al. Nature. 2018 May.

Abstract

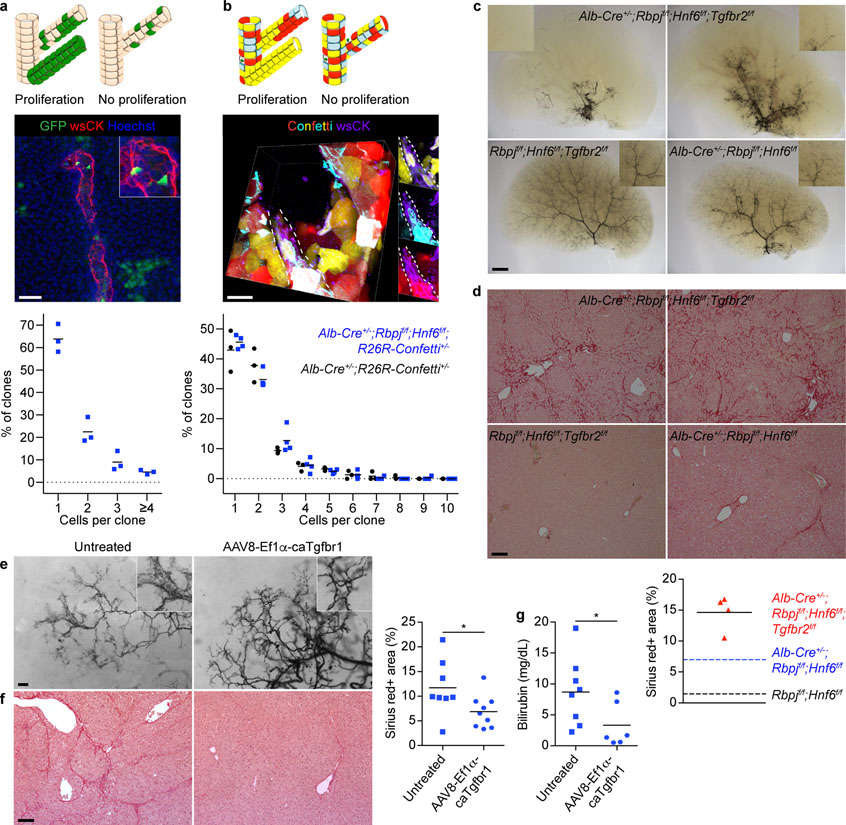
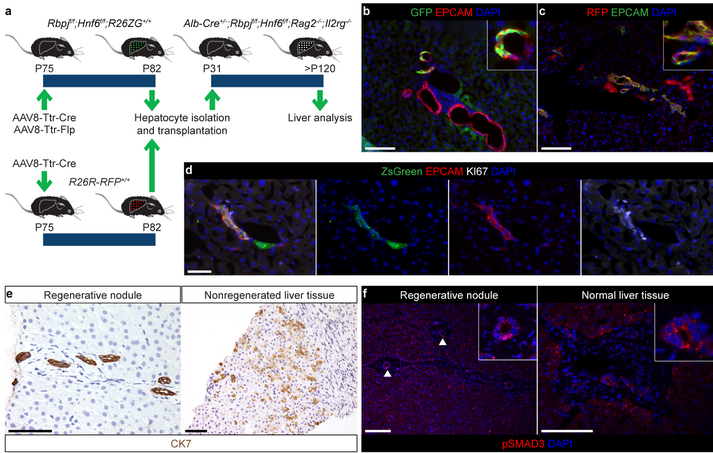
Transdifferentiation is a complete and stable change in cell identity that serves as an alternative to stem-cell-mediated organ regeneration. In adult mammals, findings of transdifferentiation have been limited to the replenishment of cells lost from preexisting structures, in the presence of a fully developed scaffold and niche1. Here we show that transdifferentiation of hepatocytes in the mouse liver can build a structure that failed to form in development-the biliary system in a mouse model that mimics the hepatic phenotype of human Alagille syndrome (ALGS)2. In these mice, hepatocytes convert into mature cholangiocytes and form bile ducts that are effective in draining bile and persist after the cholestatic liver injury is reversed, consistent with transdifferentiation. These findings redefine hepatocyte plasticity, which appeared to be limited to metaplasia, that is, incomplete and transient biliary differentiation as an adaptation to cell injury, based on previous studies in mice with a fully developed biliary system3-6. In contrast to bile duct development7-9, we show that de novo bile duct formation by hepatocyte transdifferentiation is independent of NOTCH signalling. We identify TGFβ signalling as the driver of this compensatory mechanism and show that it is active in some patients with ALGS. Furthermore, we show that TGFβ signalling can be targeted to enhance the formation of the biliary system from hepatocytes, and that the transdifferentiation-inducing signals and remodelling capacity of the bile-duct-deficient liver can be harnessed with transplanted hepatocytes. Our results define the regenerative potential of mammalian transdifferentiation and reveal opportunities for the treatment of ALGS and other cholestatic liver diseases.


Conflict of interest statement

The authors declare no competing financial interests.

Figures

Extended Data Figure 1:
Extended Data Figure 1:. Flp-based hepatocyte fate tracing.
a, R26ZG allele. b, Experimental design for establishing efficient, specific and constitutive labeling of hepatocytes in normal adult R26ZG+/+ mice. c-f, IF of R26ZG+/+ mouse liver (n=2) for GFP and the hepatocyte marker major urinary protein (MUP) (c), peripheral and hilar cholangiocyte marker CK19 (d, e), hilar-cholangiocyte-specific marker DBA (e), hepatic stellate cell marker desmin (DES), macrophage marker F4/80 and endothelial cell marker LYVE1 (f) 2 weeks (wks) after intravenous injection of 1 × 10¹² viral genomes (vgs) of AAV8-Ttr-Flp. g, Reporter activation in R26ZG+/+ mice 1 and 2 weeks after intravenous injection of the indicated dose of AAV8-Ttr-Flp (n=1 for each dose and time point). Scale bars, 100 μm.
Extended Data Figure 2:
Extended Data Figure 2:. Efficiency of hepatocyte fate tracing in mice born with or without pBDs.
a, b, Experimental design for hepatocyte fate tracing at P17 and IF at P120 in Rbpjf/f;Hnf6f/f;R26ZG+/+ mice (n=4). c, Correlation of GFP labeling efficiency between hepatocytes and peripheral cholangiocytes in hepatocyte-fate-traced P120 Alb-Cre+/−;Rbpjf/f;Hnf6f/f;R26ZG+/+ mice (n=5, top and bottom). Measure of center is mean. d, e, Experimental design for hepatocyte fate tracing at P39 and IF at P120 in Alb-Cre+/−;Rbpjf/f;Hnf6f/f;R26ZG+/+ mice (n=3). Scale bars, 100 μm.
Extended Data Figure 3:
Extended Data Figure 3:. HpBDs relieve cholestasis and liver injury.
a, Serum total bilirubin levels in P20–29 (n=6), P30–39 (n=33), P40–49 (n=35), P50–59 (n=8), P60–69 (n=46), P70–79 (n=22), P80–89 (n=13), P90–119 (n=20), P120–149 (n=52) and ≥P150 (n=40) Alb-Cre+/−;Rbpjf/f;Hnf6f/f and P20–29 (n=5), P30–39 (n=24), P40–49 (n=19), P50–59 (n=7), P60–69 (n=27), P70–79 (n=10), P80–89 (n=11), P90–119 (n=10), P120–149 (n=41) and ≥P150 (n=25) Rbpjf/f;Hnf6f/f mice. 2-sided Welch’s t-test; **P=0.0011 at P20–29, ****P=1.7E-13 at P30–39, ****P=8.2E-12 at P40–49, ***P=0.00019 at P50–59, ****P=8.4E-10 at P60–69, ***P=0.00055 at P70–79, nsP=0.090 at P80–89, nsP=0.050 at P90–119, nsP=0.052 at P120–149 and nsP=0.064 at ≥P150. b, Serial measurements of serum total bilirubin levels in Alb-Cre+/−;Rbpjf/f;Hnf6f/f (n=14) and Rbpjf/f;Hnf6f/f (n=5) mice. 2-sided Welch’s t-test; nsP=0.11. c-e, Serum ALP, ALT and AST levels in P43–45 (n=13), P69–82 (n=13), P120 (n=14) and P150 (n=11) Alb-Cre+/−;Rbpjf/f;Hnf6f/f and P43–45 (n=5), P69–82 (n=4), P120 (n=9) and P150 (n=6) Rbpjf/f;Hnf6f/f mice. 2-way ANOVA followed by Holm-Sidak multiple comparison test; ****P=0.000058 at P43–45, ****P=0.000019 at P69–82, **P=0.0064 at P120, nsP=0.22 at P150 and ***P=0.00010 at P120 vs. P69–82 (c); **P=0.0050 at P43–45, nsP=0.47 at P69–82, nsP=0.30 at P120 and nsP=0.47 at P150 (d); **P=0.0024 at P43–45, *P=0.015 at P69–82, ****P=0.000073 at P120 and nsP=0.061 at P150 (e). f, Sirius-red staining in P15 (n=9), P70–90 (n=7) and P120 (n=6) Alb-Cre+/−;Rbpjf/f;Hnf6f/f and P15 (n=5), P70–90 (n=3) and P120 (n=3) Rbpjf/f;Hnf6f/f mice with quantification. 2-way ANOVA followed by Holm-Sidak multiple comparison test; nsP=0.94 at P15, ****P=0.000095 at P70–90, **P=0.0074 at P120 and *P=0.027 at P120 vs. P70–90. g, Immunohistochemistry and Sirius-red staining in P313 Alb-Cre+/−;Rbpjf/f;Hnf6f/f mice with persistent or resolved cholestasis (n=1 each). Measure of center is mean (a-f). Scale bars, 100 μm.
Extended Data Figure 4:
Extended Data Figure 4:. Isolation and gene expression profiling of hepatocyte-derived peripheral cholangiocytes.
a, FACS gates for peripheral cholangiocyte (pC, EPCAM+DBA) and hilar cholangiocyte (hC, EPCAM+DBA+) isolation from Alb-Cre+/−;Rbpjf/f;Hnf6f/f and Rbpjf/f;Hnf6f/f mice. b, qPCR analysis of Rbpj floxed genomic DNA in hepatocyte-derived pC (HpC) and hC isolated from Alb-Cre+/−;Rbpjf/f;Hnf6f/f mice relative to hepatocytes isolated from Rbpjf/f;Hnf6f/f mice (dashed line, n=3 each). Data were normalized to a downstream genomic region of Rbpj to control for gene copy number. Measure of center is mean ± SEM. c, d, RNA-seq analysis of normal pC (n=3 mice), HpC (n=4 mice) and RBPJ- and HNF6-deficient hepatocytes (H, n=3 mice). Heatmap of genes reflecting deletion of Rbpj and Hnf6 (Onecut1) (c). Rbpj mRNA is present in this knockout mouse as a truncated transcript that does not produce a functional protein. Heatmap of all differentially expressed CYP genes distinguishing genes associated with mature (M), adolescent (A) and immature (I) hepatocyte differentiation or low expression in the liver (L) (d). 1-way ANOVA, FDR-corrected P<0.05; fold change > 3 (c, d, except Rbpj and Notch1–4). 2-sided Student’s t-test; bold genes P<0.05 for HpC vs. pC (c, d).
Extended Data Figure 5:
Extended Data Figure 5:. Proliferation in HpBDs and reactive ductules.
a, Size distribution of wsCK-positive DBA-positive hilar cholangiocyte clones in P90 Alb-Cre+/−;Rbpjf/f;Hnf6f/f;R26R-Confetti+/− (n=2) and Alb-Cre+/−;R26R-Confetti+/− (n=2) mouse livers. 2-sided Student’s t-test; **P=0.0079 for 3 cells and ***P=0.00092 for 7 cells. b, IF of reactive ductules in hepatocyte-fate-traced P32 Alb-Cre+/−;Rbpjf/f;Hnf6f/f;R26ZG+/+ mouse liver (n=3). c, Size distribution of wsCK-positive DBA-negative peripheral cholangiocyte clones in P90 Alb-Cre+/−;Rbpjf/f;Hnf6f/f;R26R-Confetti+/− (n=2) and Alb-Cre+/−;R26R-Confetti+/− (n=2) mouse livers. 2-sided Student’s t-test; *P=0.032 for 1 cell, *P=0.024 for 2 cells, *P=0.020 for 3 cells and *P=0.014 for 4 cells. d, IF and breakdown of OPN-positive KI67-positive cells based on CK19 expression in P54 Alb-Cre+/−;Rbpjf/f;Hnf6f/f mouse liver (n=4). Arrowheads indicate OPN-positive KI67-positive CK19-negative cells. e, IF of liver of >P120 Alb-Cre+/−;Rbpjf/f;Hnf6f/f and Rbpjf/f;Hnf6f/f mice after DDC diet feeding for 2 (n=1 each), 4 (n=3 each) and 6 (n=1 each) weeks (wks). f, IF of liver and breakdown of OPN-positive cells based on hepatocyte fate tracing in >P120 Alb-Cre+/−;Rbpjf/f;Hnf6f/f;R26ZG+/+ (n=4) and Rbpjf/f;Hnf6f/f;R26ZG+/+ (n=3) mice fed DDC diet for 5 weeks starting 1 week after hepatocyte fate tracing was induced. Measure of center is mean (a, c, d, f) ± SEM (d, f). Scale bars, 100 μm (b, e, f), 50 μm (d).
Extended Data Figure 6:
Extended Data Figure 6:. TGFβ signaling in hepatocyte transdifferentiation.
a, Ink visualization of biliary tree of P32 Alb-Cre+/−;Tgfbr2f/f mouse (n=2). b, IF of P60 Alb-Cre+/−;Rbpjf/f;Hnf6f/f and Rbpjf/f;Hnf6f/f mouse livers (n=2 each). Arrowheads indicate pSMAD3-positive HNF1-positive nuclei. c, Western blot with quantification of pSMAD3 in nuclear extracts from Alb-Cre+/−;Rbpjf/f;Hnf6f/f, Rbpjf/f;Hnf6f/f and Alb-Cre+/−;Rbpjf/f;Hnf6f/f;Tgfbr2f/f mouse livers (n=2 each). Source data are shown in Supplementary Fig. 1. d-f, Experimental design (d) and results of analysis of the effect of TGFβ signaling on biliary differentiation of adult RBPJ- and HNF6-deficient hepatocytes in 3D culture. Phase-contrast images of RPBJ- and HNF6-deficient hepatocyte spheroids embedded in collagen gels and cultured in the presence or absence of the TGFβ inhibitor SB-431542 (SB) for the indicated number of days (d) (e). Relative expression levels of cholangiocyte and hepatocyte genes in freshly isolated hepatocytes and spheroids before and after embedding in collagen gels (f). Gene expression in the liver of a mouse fed choline-deficient ethionine-supplemented (CDE) diet was used as a positive control. Data are from 3 independent cultures per treatment in a representative experiment (n=2). 2-sided Welch’s t-test; *P=0.038 for Sox9 5 d, *P=0.044 for Sox9 10 d, **P=0.0034 for Krt19 5 d and **P=0.0071 for Spp1 5 d. g, Serum total bilirubin levels in P34–53 Alb-Cre+/−;Rbpjf/f;Hnf6f/f;Tgfbr2f/f (n=16) and Rbpjf/f;Hnf6f/f;Tgfbr2f/f (n=7) mice. 2-sided Welch’s t-test; ****P=0.000024. h, Quantification of Sirius-red staining in P58–100 Rbpjf/f;Hnf6f/f mice after intravenous injection of AAV8-Ef1α-caTgfbr1 at P20 (n=4). Gray area represents the range of liver collagen in the indicated Rbpjf/f;Hnf6f/f mice from Extended Data Fig. 3f. Measure of center is mean (c, f, g, h) ± SEM (f). Scale bars, 2 mm (a), 100 μm (e), 50 μm (b), 10 μm (b, inset).
Figure 1:
Figure 1:. Hepatocytes can convert into peripheral cholangiocytes and form pBDs contiguous with preexisting hBDs.
a, De novo pBD formation and hepatocyte fate tracing in Alb-Cre+/−;Rbpjf/f;Hnf6f/f;R26ZG+/+ mice. Cells identified by dolichos biflorus agglutinin (DBA) lectin labeling and wide-spectrum (ws) cytokeratin (CK) and GFP immunofluorescence (IF). b, IF of hepatocyte-fate-traced P120 Alb-Cre+/−;Rbpjf/f;Hnf6f/f;R26ZG+/+ mouse liver (n=7). c, Biliary tree visualized by retrograde ink injection into the common bile duct of P30 (n=6), P120-P138 (n=6) and ≥P334 (n=6) Alb-Cre+/−;Rbpjf/f;Hnf6f/f and P30 (n=3) and P120-P138 (n=5) Rbpjf/f;Hnf6f/f mice. d, Maximum projection (top) and 3D reconstruction (bottom) of z-stack image of hepatocyte-fate-traced P120 Alb-Cre+/−;Rbpjf/f;Hnf6f/f;R26ZG+/+ mouse liver (n=2). e, IF and brightfield of hepatocyte-fate-traced P468 Alb-Cre+/−;Rbpjf/f;Hnf6f/f;R26ZG+/+ mouse liver after retrograde ink injection into the common bile duct (≥P334, n=3). Scale bars, 2 mm (c, P30, P395 left), 500 μm (c, P138 left), 250 μm (c, P138 right), 100 μm (b, c, P395 right, d, e, left), 25 μm (e, middle).
Figure 2:
Figure 2:. Hepatocyte-derived peripheral cholangiocytes are equivalent to normal mature peripheral cholangiocytes.
a-c, IF of hepatocyte-fate-traced P120 Alb-Cre+/−;Rbpjf/f;Hnf6f/f;R26ZG+/+ mouse liver (n=3 each). Scale bars, 100 μm (c), 20 μm (a, b). d-g, RNA-seq analysis of normal peripheral cholangiocytes (pC, n=3 mice), hepatocyte-derived peripheral cholangiocytes (HpC, n=4 mice) and RBPJ- and HNF6-deficient hepatocytes (H, n=3 mice). Principal-component analysis (d). Venn diagram showing number of genes significantly differentially up- and down-regulated in pC or HpC vs. H (e). Heatmaps of genes reflecting cholangiocyte differentiation, including genes lacking in DDC diet-induced hepatocyte-derived metaplastic biliary cells (top) and other marker genes (bottom) (f). Heatmaps of genes reflecting hepatocyte differentiation, including all differentially expressed CYP genes enriched in adult mouse liver (top) and other marker genes (bottom) (g). 1-way ANOVA, FDR-corrected P<0.05; fold change > 3 (e-g). 2-sided Student’s t-test; bold genes P<0.05 for HpC vs. pC (f, g).
Figure 3:
Figure 3:. HpBD formation entails little proliferation and is driven by TGFβ signaling.
a, Possible outcomes, maximum projection image and size distribution of clones in hepatocyte-fate-traced P120 Alb-Cre+/−;Rbpjf/f;Hnf6f/f;R26ZG+/+ mice (n=3). b, Possible outcomes, image stack volume projection and size distribution of clones in P150 Alb-Cre+/−;Rbpjf/f;Hnf6f/f;R26R-Confetti+/− (n=4) and Alb-Cre+/−;R26R-Confetti+/− (n=3) mice. c, Ink visualization of biliary tree of >P120 Alb-Cre+/−;Rbpjf/f;Hnf6f/f;Tgfbr2f/f (n=16), Rbpjf/f;Hnf6f/f;Tgfbr2f/f (n=4) and Alb-Cre+/−;Rbpjf/f;Hnf6f/f (n=1) mice. d, Sirius-red staining with quantification in >P120 Alb-Cre+/−;Rbpjf/f;Hnf6f/f;Tgfbr2f/f (n=4), Rbpjf/f;Hnf6f/f;Tgfbr2f/f (n=2) and Alb-Cre+/−;Rbpjf/f;Hnf6f/f (n=2) mice. Dotted lines represent the means of the indicated P120 mice from Extended Data Fig. 3f. e, f, Ink visualization of biliary tree and Sirius-red staining with quantification in P100 Alb-Cre+/−;Rbpjf/f;Hnf6f/f mice that did (n=9) or did not (n=8) receive AAV8-Ef1α-caTgfbr1. 2-sided Student’s t-test; *P=0.045. g, Serum total bilirubin in P36 Alb-Cre+/−;Rbpjf/f;Hnf6f/f mice that did (n=6) or did not (n=8) receive AAV8-Ef1α-caTgfbr1. 2-sided Welch’s t-test; *P=0.047. Measure of center is mean (a, b, d, f, g). Scale bars, 2 mm (c), 500 μm (e), 100 μm (d, f), 50 μm (a), 20 μm (b).
Figure 4:
Figure 4:. Clinical relevance and therapeutic potential of HpBD formation.
a, Experimental design for hepatocyte transplantation. b, IF of P127 mouse (n=5) transplanted with adult GFP-expressing RBPJ- and HNF6-deficient hepatocytes. c, IF of P152 mouse (n=4) transplanted with adult RFP-expressing hepatocytes. d, IF of liver of P72 mouse (n=2) transplanted at P43 with hepatocytes isolated from P287 Alb-Cre+/−;R26R-ZsGreen+/+ mouse. e, f, Immunohistochemistry and IF of ALGS (n=2) and normal (n=1) human livers. Arrowheads indicate nuclear pSMAD3 in pBDs. Scale bars, 100 μm (b, c, e, f), 50 μm (d).

Comment in

References

    1. Merrell AJ & Stanger BZ Adult cell plasticity in vivo: de-differentiation and transdifferentiation are back in style. Nat Rev Mol Cell Biol 17, 413–425 (2016). - PMC - PubMed
    1. Vanderpool C et al. Genetic interactions between hepatocyte nuclear factor-6 and Notch signaling regulate mouse intrahepatic bile duct development in vivo. Hepatology 55, 233–243 (2012). - PMC - PubMed
    1. Tarlow BD et al. Bipotential adult liver progenitors are derived from chronically injured mature hepatocytes. Cell Stem Cell 15, 605–618 (2014). - PMC - PubMed
    1. Sekiya S & Suzuki A Hepatocytes, rather than cholangiocytes, can be the major source of primitive ductules in the chronically injured mouse liver. Am J Pathol 184, 1468–1478 (2014). - PubMed
    1. Kamimoto K et al. Heterogeneity and stochastic growth regulation of biliary epithelial cells dictate dynamic epithelial tissue remodeling. Elife 5, e15034 (2016). - PMC - PubMed

Publication types

Substances