. 2018 May 2;8(1):6907.
doi: 10.1038/s41598-018-25246-6.

Coupling Multi Angle Light Scattering to Ion Exchange chromatography (IEX-MALS) for protein characterization

Affiliations

Coupling Multi Angle Light Scattering to Ion Exchange chromatography (IEX-MALS) for protein characterization

Hadar Amartely et al. Sci Rep. .

Erratum in

Abstract

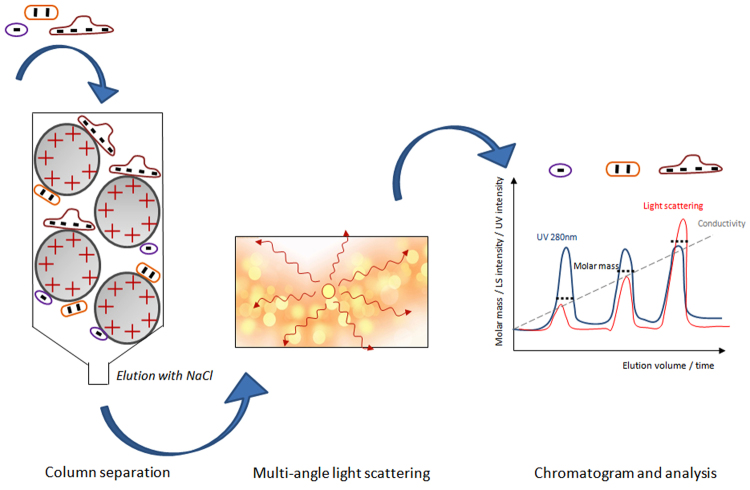
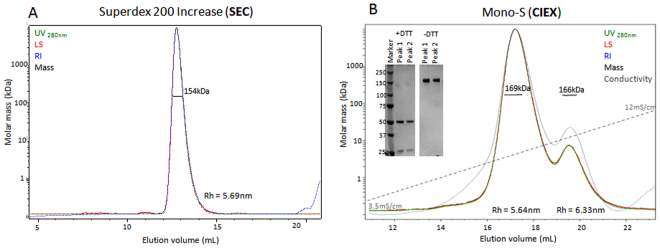
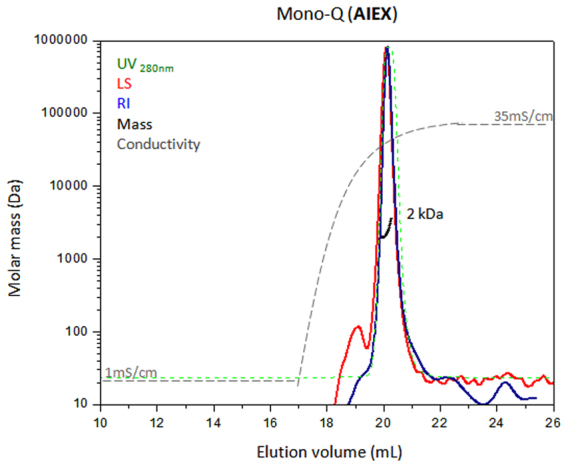
Multi-angle light scattering coupled with size exclusion chromatography (SEC-MALS) is a standard and common approach for characterizing protein mass, overall shape, aggregation, oligomerization, interactions and purity. The limited resolution of analytical SEC restricts in some instances the accurate analysis that can be accomplished by MALS. These include mixtures of protein populations with identical or very similar molecular masses, oligomers with poor separation and short peptides. Here we show that combining MALS with the higher resolution separation technique ion exchange (IEX-MALS) can allow precise analyses of samples that cannot be resolved by SEC-MALS. We conclude that IEX-MALS is a valuable and complementary method for protein characterization, especially for protein systems that could not be fully analyzed by SEC-MALS.


Conflict of interest statement

The authors declare no competing interests.

Figures

Figure 1
Figure 1
Schematic illustration of the IEX-MALS method. A proteins-mixed sample is injected into an IEX chromatography column in-line with a multi-angle light scattering detector. Proteins interact with the charged matrix and elute form the column with increased salt gradient according to the strength of binding: highly charged proteins bind stronger to the matrix and elute with higher salt concentration.
Figure 2
Figure 2
SEC-MALS and AIEX-MALS of BSA. BSA was separated and analyzed using Superdex 75 (A) and Superdex 200 increase (B) analytical SEC columns and an AIEX analytical column Mono-Q with different gradient programs (C,D) and consequently with MALS. The four chromatograms display the UV at 280 nm (green), light scattering at 90° angle (red), refractive index (blue) and conductivity (grey) curves together with the molar mass of each peak calculated by MALS (black).
Figure 3
Figure 3
SEC-MALS and AIEX-MALS of fibronectin. Fibronectin was separated and analyzed using a Superdex 200 increase analytical SEC column (A) and an AIEX analytical column Mono-Q (B) and consequently by MALS. Chromatograms display the UV at 280 nm (green), light scattering at 90° angle (red), refractive index (blue) and conductivity (grey) curves together with the molar mass of the peaks determined by MALS (black).
Figure 4
Figure 4
SEC-MALS and AIEX-MALS of the hoefavidin variant. The protein was separated and analyzed using a Superose 12 analytical SEC column (A) and an AIEX analytical column Mono-Q (B) in-line with MALS. Chromatograms display the UV at 280 nm (green), light scattering at 90° angle (red), refractive index (blue) and conductivity (grey) curves together with the molar mass of the peaks determined by MALS (black). (C) Gel image of native PAGE analysis of fractions from each peak in the AIEX-MALS experiment (see Supplementary Fig. S4 for full gel image).
Figure 5
Figure 5
SEC-MALS and CIEX-MALS of Adalimumab. (A) SEC-MALS results of Adalimumab. (B) CIEX-MALS results of Adalimumab and a gel image of SDS-PAGE analysis of the eluted peaks in reducing (+DTT) and non-reducing (−DTT) conditions (see Supplementary Fig. S4 for full gel image). The chromatograms display the UV at 280 nm (green), light scattering at 90° angle (red), refractive index (blue) and conductivity (grey) curves together with the molar mass of each peak determined by MALS (black).
Figure 6
Figure 6
AIEX-MALS of a peptide. A tested peptide was analyzed using a Mono-Q analytical column in-line with MALS. The chromatogram displays the UV at 280 nm (green), light scattering at 90° angle (red), refractive index (blue) and conductivity (grey) curves together with the molar mass of the peak determined by MALS (black).

Similar articles

Cited by

References

    1. Xu R. Light scattering: A review of particle characterization applications. Particuology. 2015;18:11–21. doi: 10.1016/j.partic.2014.05.002. - DOI
    1. Mhatre RM, Krull IS. Interfacing gradient elution ion-exchange chromatography and low-angle laser light-scattering photometry for analysis of proteins. J. Chromatogr. 1992;591:139–148. doi: 10.1016/0021-9673(92)80231-I. - DOI - PubMed
    1. Minton AP. Recent applications of light scattering measurement in the biological and biopharmaceutical sciences. Anal. Biochem. 2016;501:4–22. doi: 10.1016/j.ab.2016.02.007. - DOI - PMC - PubMed
    1. Sahin E, Roberts CJ. Size-exclusion chromatography with multi-angle light scattering for elucidating protein aggregation mechanisms. Methods Mol. Biol. 2012;899:403–423. doi: 10.1007/978-1-61779-921-1_25. - DOI - PubMed
    1. Andersson M, Wittgren B, Wahlund KG. Ultrahigh molar mass component detected in ethylhydroxyethyl cellulose by asymmetrical flow field-flow fractionation coupled to multiangle light scattering. Anal. Chem. 2001;73:4852–4861. doi: 10.1021/ac0104734. - DOI - PubMed

Publication types

LinkOut - more resources