. 2018 Aug;37(32):4398-4412.
doi: 10.1038/s41388-018-0287-z. Epub 2018 May 3.

Myoferlin controls mitochondrial structure and activity in pancreatic ductal adenocarcinoma, and affects tumor aggressiveness

Affiliations

Myoferlin controls mitochondrial structure and activity in pancreatic ductal adenocarcinoma, and affects tumor aggressiveness

Gilles Rademaker et al. Oncogene. 2018 Aug.

Abstract

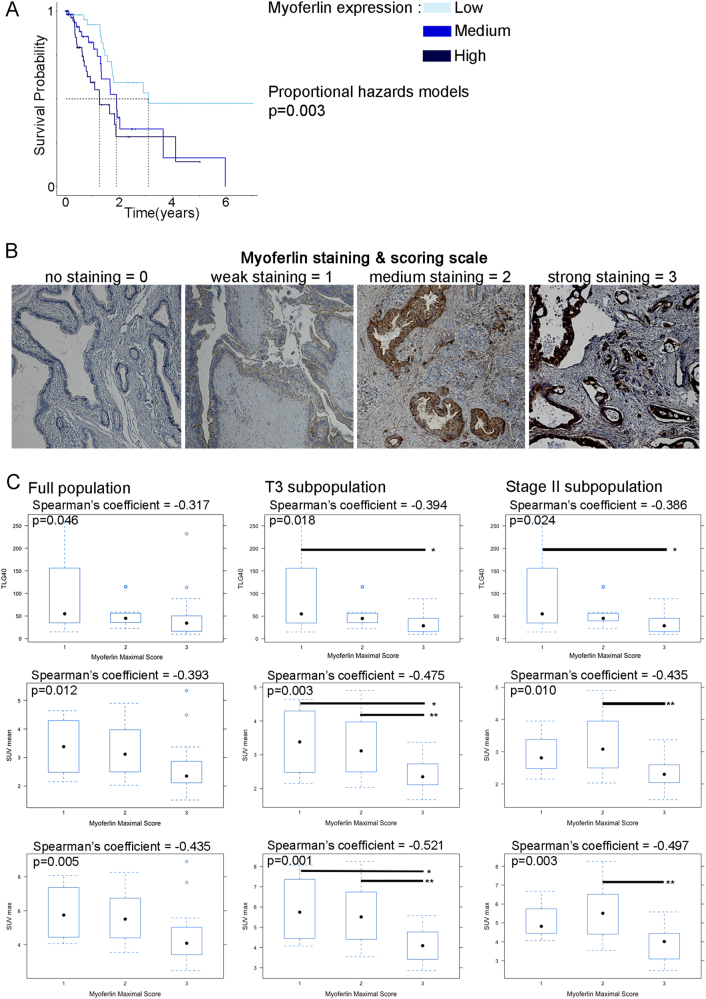
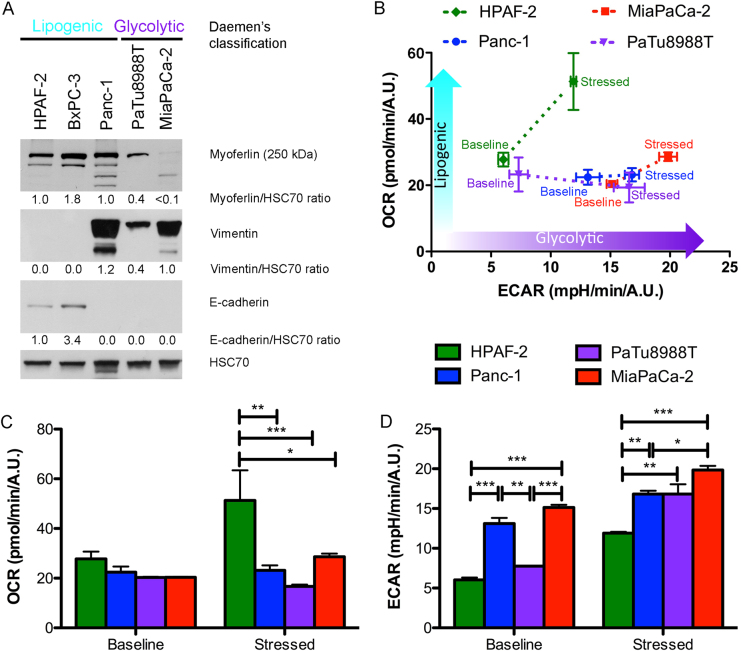
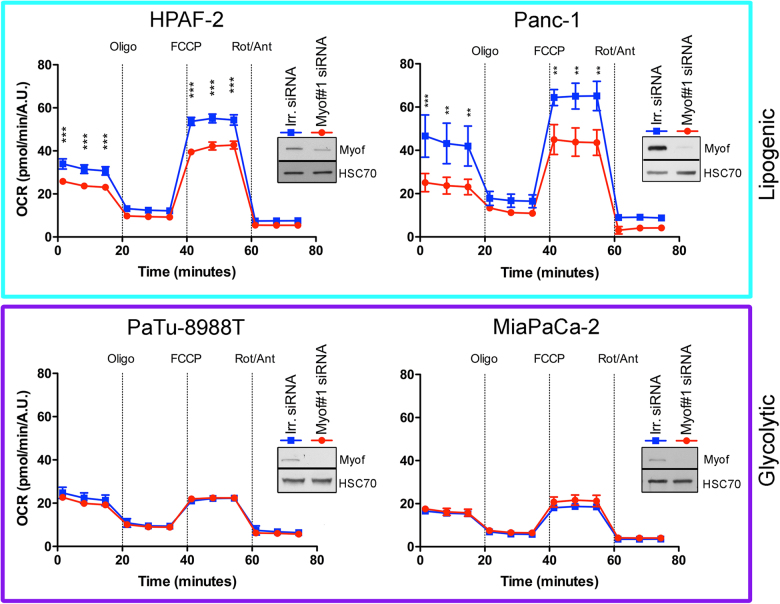
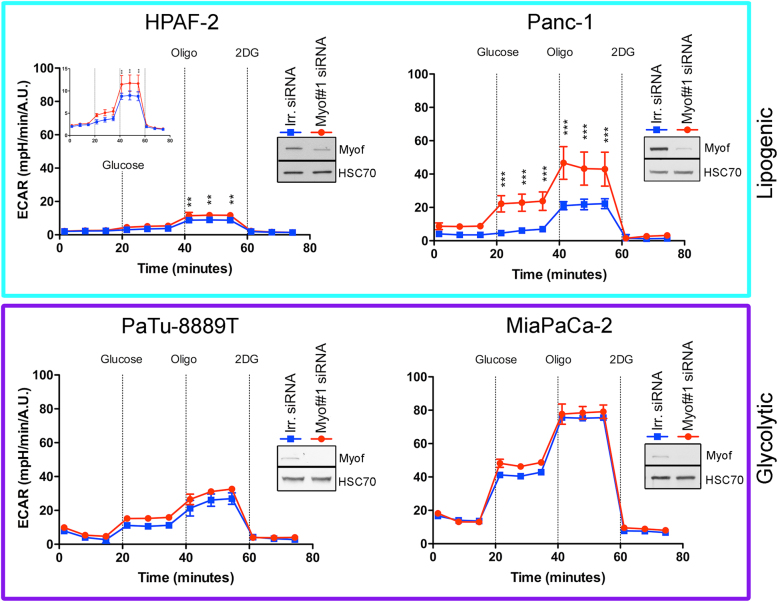
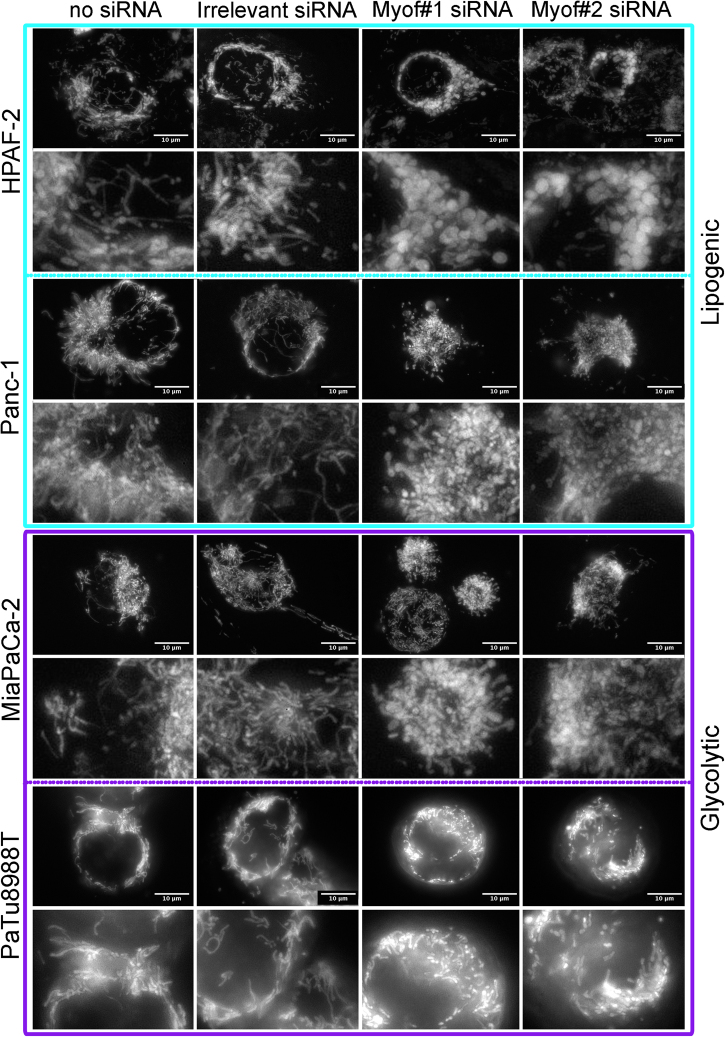
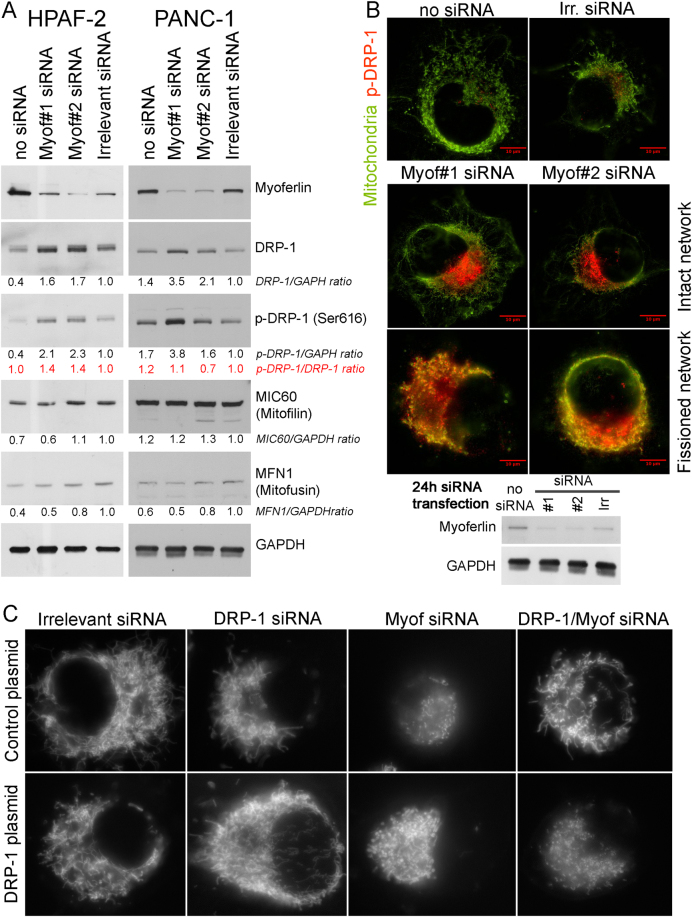
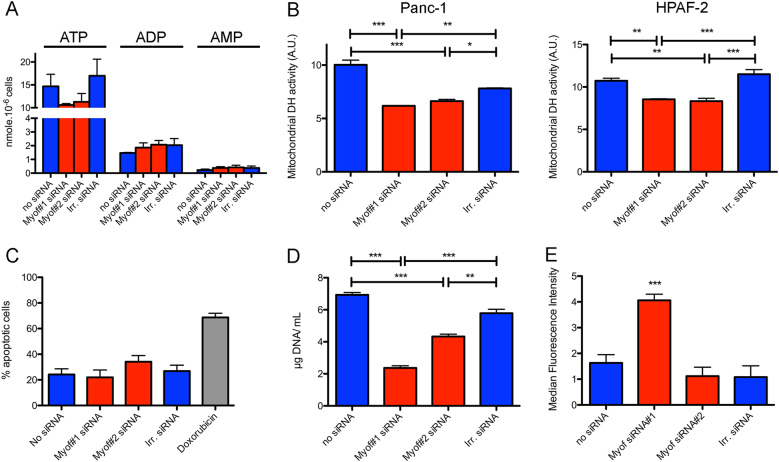
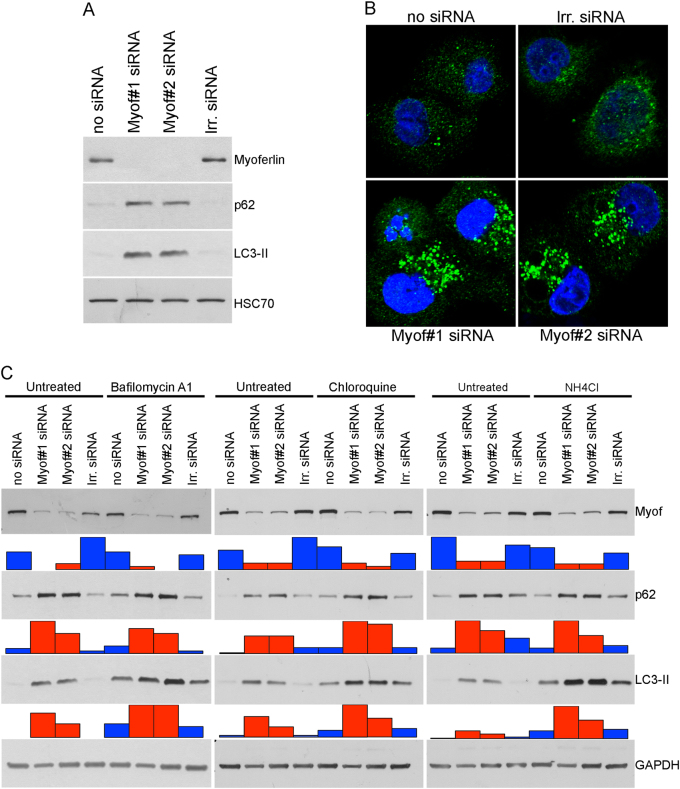
Pancreatic ductal adenocarcinoma (PDAC) is the third leading cause of cancer-related death. Therapeutic options remain very limited and are based on classical chemotherapies. Energy metabolism reprogramming appears as an emerging hallmark of cancer and is considered a therapeutic target with considerable potential. Myoferlin, a ferlin family member protein overexpressed in PDAC, is involved in plasma membrane biology and has a tumor-promoting function. In the continuity of our previous studies, we investigated the role of myoferlin in the context of energy metabolism in PDAC. We used selected PDAC tumor samples and PDAC cell lines together with small interfering RNA technology to study the role of myoferlin in energetic metabolism. In PDAC patients, we showed that myoferlin expression is negatively correlated with overall survival and with glycolytic activity evaluated by 18F-deoxyglucose positron emission tomography. We found out that myoferlin is more abundant in lipogenic pancreatic cancer cell lines and is required to maintain a branched mitochondrial structure and a high oxidative phosphorylation activity. The observed mitochondrial fission induced by myoferlin depletion led to a decrease of cell proliferation, ATP production, and autophagy induction, thus indicating an essential role of myoferlin for PDAC cell fitness. The metabolic phenotype switch generated by myoferlin silencing could open up a new perspective in the development of therapeutic strategies, especially in the context of energy metabolism.


Conflict of interest statement

The authors declare that they have no conflict of interest.

Figures

Fig. 1
Fig. 1
Correlation between myoferlin expression, survival and 18F-deoxyglucose PET scan data in PDAC patients. a TCGA-PAAD data (http://cancergenome.nih.gov/) were analyzed for overall survival according to their myoferlin gene expression split in tertiles (low expression N = 59, medium expression N = 59, high expression N = 61). Kaplan–Meier curve was established and log-rank probability calculated. b FFPE PDAC sections were obtained from institutional tissue biobank and stained for myoferlin. Scoring was performed by three independent investigators. Staining scores were defined as 0 for no staining, 1 for weak staining, 2 for medium staining, and 3 for strong staining. c Forty PDAC sections were stained and scored for myoferlin. Spearman’s rank correlation coefficients were calculated between 18F-DG PET data (total lesion glycolysis—TLG40, standardized uptake values—SUVmean and SUVmax) and myoferlin scores in total population and T3 or stage II sub-population. Each data point represents median with interquartile range. **P < 0.01 and *P 0.05
Fig. 2
Fig. 2
Characterization of PDAC cell lines. HPAF-2, BxPC-3, Panc-1, PaTu8988T, and MiaPaCa-2 cell lines were characterized for a myoferlin, vimentin, and E-cadherin expression. HSC70 was used as a loading control. b Combined representation of oxygen consumption rate (OCR) and extracellular acidification rate (ECAR) before (baseline) and after (stressed) oligomycin (1 µM) and FCCP (1 µM) addition. c OCR and d ECAR are represented individually before (baseline) and after (stressed) oligomycin and FCCP addition. Each data point represents mean ± SD, n = 3. ***P < 0.001, **P < 0.01, and *P < 0.05
Fig. 3
Fig. 3
Oxygen consumption rate (OCR) in PDAC cell lines after myoferlin depletion. Kinetic oxygen consumption rate response of HPAF-2, Panc-1, PaTu8988T, and MiaPaCa-2 cells to oligomycin (oligo, 1 µM), FCCP (1.0 µM, except 0.5 µM for MiaPaCa-2), rotenone, and antimycin A mix (Rot/Ant, 0.5 µM each). Upon assay completion, cells were methanol/acetone fixed, and cell number was evaluated using Hoechst incorporation (arbitrary unit, A.U.). One representative experiment out of three is illustrated here. Same results were obtained with the second myoferlin siRNA. Each data point represents mean ± SD, n = 3. ***P < 0.001, **P < 0.01. Western blot inserts represented the myoferlin silencing validation
Fig. 4
Fig. 4
Extracellular acidification rate (ECAR) in PDAC cell lines after myoferlin silencing. Kinetic oxygen consumption rate response of HPAF-2 (insert represents the same data with a specific scale), Panc-1, PaTu8988T, and MiaPaCa-2 cells to glucose (10 mM), oligomycin (oligo, 1 µM), and 2-deoxyglucose (2DG, 50 mM). Upon assay completion, cells were methanol/acetone fixed, and cell number was evaluated using Hoechst incorporation (arbitrary unit, A.U.). One representative experiment out of three is illustrated here. Same results were obtained with the second myoferlin siRNA. Each data point represents mean ± SD, n = 3. ***P < 0.001, **P < 0.01. Western blot inserts represented the myoferlin silencing validation
Fig. 5
Fig. 5
Mitochondrial network visualization after myoferlin silencing. Tetramethyl rhodamine ethyl ester (TMRE) was used to stain mitochondria in living cells. At 48 h post transfection, cells were seeded in μ-Slides 8-well at low confluence then loaded with TMRE (1 nM). Representative experiment out of three
Fig. 6
Fig. 6
Immunodetection of DRP-1, phospho-DRP-1, mitofilin, or mitofusin in myoferlin-silenced in PDAC cells. a Total protein extract (10 µg) from HPAF-2 or PANC-1 cells were subjected to SDS-PAGE followed by western blot analysis with specific antibodies against myoferlin, DRP-1, phospho-DRP-1 (ser616), MIC60/mitofilin, or Mitofusin-1. GAPDH was used as a loading control. b Colocalization of phospho-DRP-1 (ser616) and mitochondrial 60 kDa nonglycosylated protein in Panc-1 cells 24 h after myoferlin silencing. Total protein extract (10 µg) were subjected to SDS-PAGE followed by western blot analysis with specific antibodies against myoferlin. HSC70 was used as a loading control. c Tetramethyl rhodamine ethyl ester (TMRE) was used to stain mitochondria in living cells. At 48 h post siRNA transfection, cells expressing or not exogenous DRP-1 were seeded in μ-Slides 8-well at low confluence then loaded with TMRE (1 nM). Representative experiments out of three
Fig. 7
Fig. 7
Effects of myoferlin silencing on cell physiology. a ATP, ADP, and AMP quantity (nmol) in 106 Panc-1 cells. b Succinate-tetrazolium dehydrogenase activity (WST-1 assay). Upon assay completion, cells were methanol/acetone fixed and cell number was evaluated using Hoechst incorporation (arbitrary unit, A.U.). c Apoptotic Panc-1 percentage measured by annexin V/PI flow cytometry. Doxorubicin was used as an apoptosis-inducing positive control. d Panc-1 cell growth assayed by Hoechst incorporation. e ROS accumulation in Panc-1 cells after myoferlin silencing. At 48 h after myoferlin silencing, cells were harvested and loaded with CM-H2DCFDA (2 µM) for 15 min at 37 °C. Then, fluorescence was measured by flow cytometry and analyzed as a median fluorescence intensity. Each data point represents mean ± SD, n = 3. ***P < 0.001, **P < 0.01, and *P < 0.05
Fig. 8
Fig. 8
Effects of myoferlin silencing on autophagy. a Panc-1 total protein extract (10 µg) were subjected to SDS-PAGE followed by western blot analysis with specific antibodies against myoferlin, p62, and LC3-II. HSC70 was used as a loading control. b Immunodetection of LC3-II puncta (autophagosomes) in fixed and permeabilized Panc-1 cells. c Autophagic flux analysis 48 h after myoferlin silencing, Panc-1 cells were treated with bafilomycin A1 (200 nM), chloroquine (50 µM), NH4Cl (20 mM), or their respective vehicles for 2 h. Total protein extract (20 µg) were subjected to SDS-PAGE followed by western blot analysis with specific antibodies against myoferlin, p62, and LC3-II. GAPDH was used as a loading control. Histograms below western blots represent the relative quantification of each detected band. One representative experiment out of three is illustrated here

References

    1. Siegel RL, Miller KD, Jemal A. Cancer statistics, 2016. CA Cancer J Clin. 2016;66:7–30. doi: 10.3322/caac.21332. - DOI - PubMed
    1. Ryan DP, Hong TS, Bardeesy N. Pancreatic adenocarcinoma. N Engl J Med. 2014;371:1039–49. doi: 10.1056/NEJMra1404198. - DOI - PubMed
    1. Neuzillet C, Rousseau B, Kocher H, Bourget P, Tournigand C. Unravelling the pharmacologic opportunities and future directions for targeted therapies in gastro-intestinal cancers Part 1: GI carcinomas. Pharmacol Ther. 2017;174:145–72. doi: 10.1016/j.pharmthera.2017.02.028. - DOI - PubMed
    1. Vander Heiden MG, DeBerardinis RJ. Understanding the intersections between metabolism and cancer biology. Cell. 2017;168:657–69. doi: 10.1016/j.cell.2016.12.039. - DOI - PMC - PubMed
    1. Higashi T, Tamaki N, Honda T, Torizuka T, Kimura T, Inokuma T, et al. Expression of glucose transporters in human pancreatic tumors compared with increased FDG accumulation in PET study. J Nucl Med. 1997;38:1337–44. - PubMed

Publication types

MeSH terms