. 2018 May 2;8(1):6870.
doi: 10.1038/s41598-018-25234-w.

Seasonal dynamics of typhoid and paratyphoid fever

Affiliations

Seasonal dynamics of typhoid and paratyphoid fever

Neil J Saad et al. Sci Rep. .

Abstract

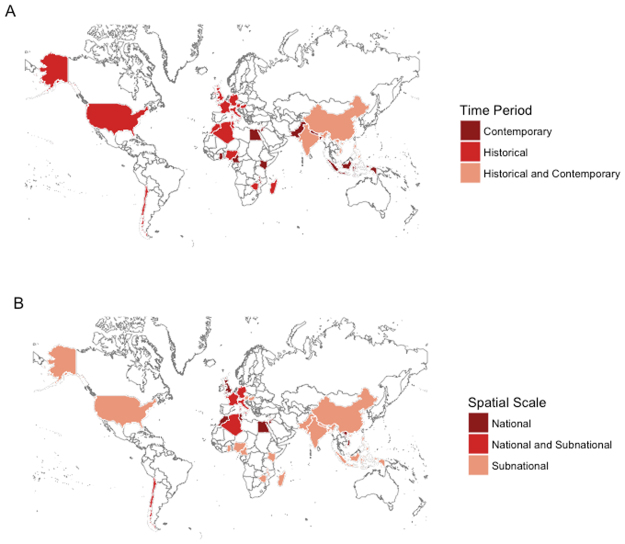
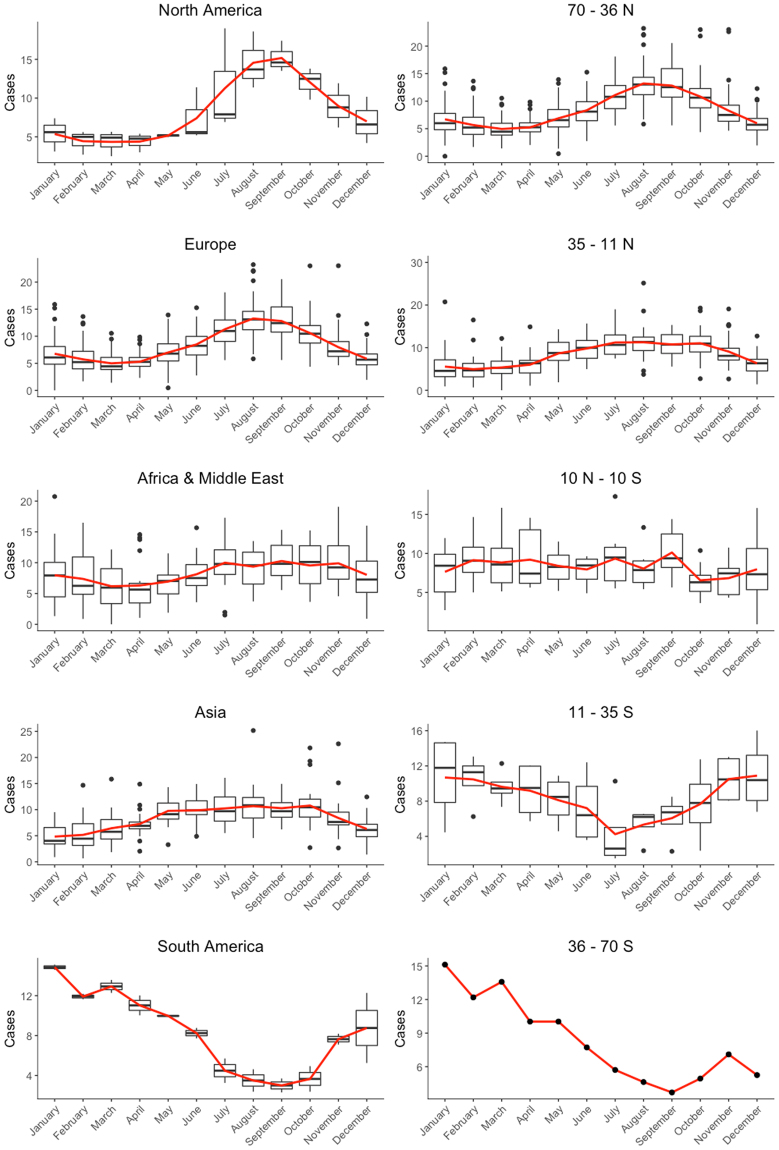
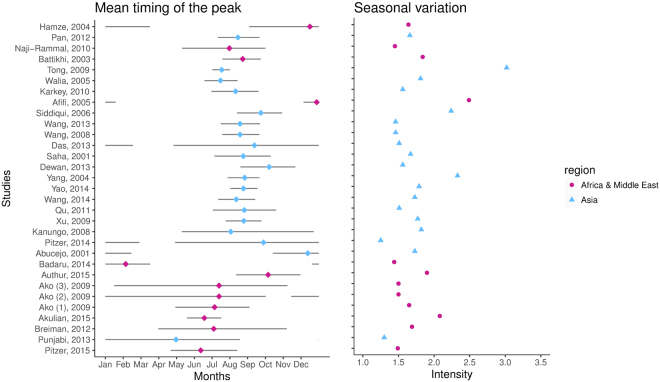
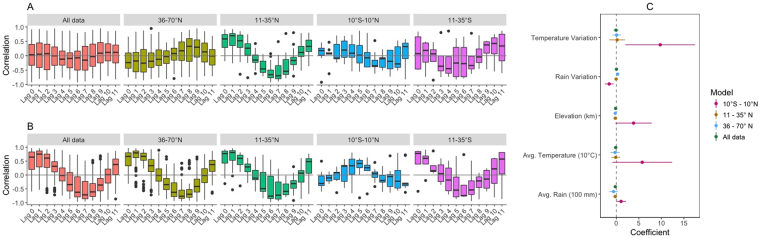
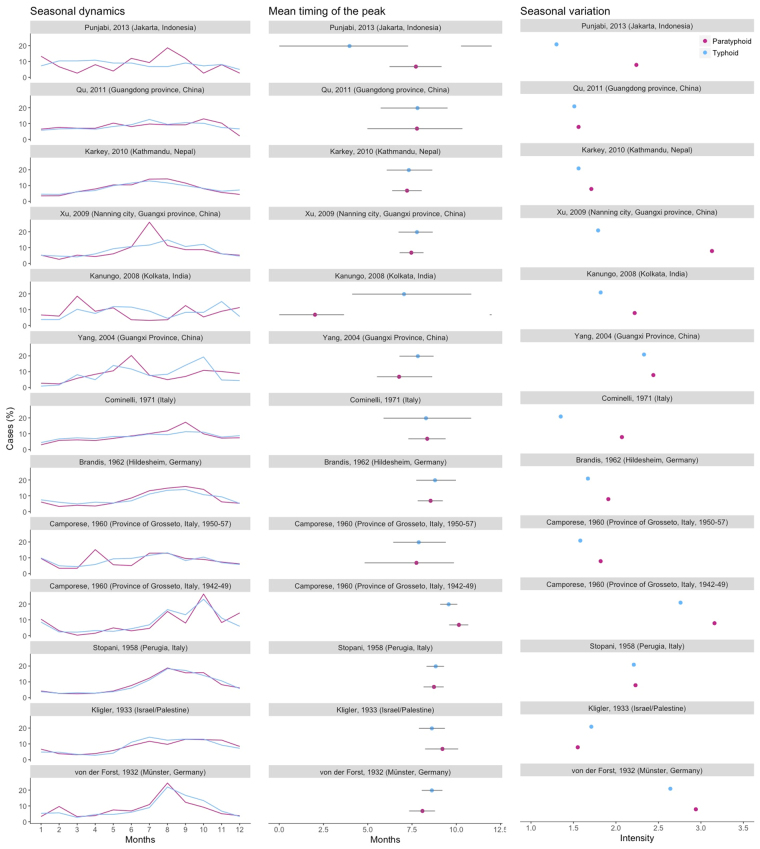
Typhoid and paratyphoid fever may follow a seasonal pattern, but this pattern is not well characterized. Moreover, the environmental drivers that influence seasonal dynamics are not fully understood, although increasing evidence suggests that rainfall and temperature may play an important role. We compiled a database of typhoid, paratyphoid, or enteric fever and their potential environmental drivers. We assessed the seasonal dynamics by region and latitude, quantifying the mean timing of peak prevalence and seasonal variability. Moreover, we investigated the potential drivers of the seasonal dynamics and compared the seasonal dynamics for typhoid and paratyphoid fever. We observed a distinct seasonal pattern for enteric and typhoid fever by latitude, with seasonal variability more pronounced further from the equator. We also found evidence of a positive association between preceding rainfall and enteric fever among settings 35°-11°N and a more consistent positive association between temperature and enteric fever incidence across most regions of the world. In conclusion, we identified varying seasonal dynamics for enteric or typhoid fever in association with environmental factors. The underlying mechanisms that drive the seasonality of enteric fever are likely dependent on the local context and should be taken into account in future control efforts.


Conflict of interest statement

The authors declare no competing interests.

Figures

Figure 1
Figure 1
Map of countries for which data was available by (A) time period and (B) spatial resolution of the data. The Map was created in R 3.2.4 (R Foundation for Statistical Computing, Vienna, Austria) using the ggplot2 and maptools packages.
Figure 2
Figure 2
Seasonal dynamics of enteric and typhoid fever by continent and latitude. The boxplots show the percentage of cases of the different studies for each month of the year and the red line depicts the mean percentage of cases for each month of the year.
Figure 3
Figure 3
Mean timing of the peak and seasonal variation for contemporary (>1990) data on enteric and typhoid fever. Mean timing (as measured by center of gravity) is represented by the colored dots, while the lines represent the corresponding 95% confidence intervals. The seasonal variation is quantified by the seasonal intensity (peak/mean). Studies are ordered by latitude, from North (top) to South (bottom) and colored by region: Africa & Middle East (Purple) and Asia (Blue).
Figure 4
Figure 4
Association of environmental drivers with enteric or typhoid fever and seasonal intensity. The Pearson’s correlation coefficient between enteric or typhoid fever and (A) average monthly rainfall and (B) average monthly temperature (current and lagged (in months), up to 11 months) is summarized for all studies within a specified region. The values of the studies are represented in a boxplot, in which the whiskers represent the interquartile range (25th–75th percentile) times 1.5. (C) Coefficients from the meta-regression of the seasonal variation (peak/mean) against the average location-specific rainfall and temperature, the variation in average rainfall and temperature (peak/mean), and the study location’s elevation for all datasets with subnational data are plotted. The point estimates of the regression coefficients are represented by dots, while the 95% confidence interval is indicated by a horizontal line.
Figure 5
Figure 5
Seasonal dynamics, mean timing of the peak and seasonal variation for studies with typhoid and paratyphoid data. On the left, the percent of annual cases occurring in each month are plotted for paratyphoid fever (purple) and typhoid fever (blue). In the middle, mean timing (as defined by center of gravity) is represented by the dots, while the line corresponds to the 95% confidence interval. On the right, the seasonal variation (peak/mean) is plotted.

References

    1. Buckle GC, Walker CLF, Black RE. Typhoid fever and paratyphoid fever: Systematic review to estimate global morbidity and mortality for 2010. J. Glob. Health. 2012;2:10401. doi: 10.7189/jogh.01.010401. - DOI - PMC - PubMed
    1. Antillón M, et al. The burden of typhoid fever in low- and middle-income countries: A meta-regression approach. PLoS Negl. Trop. Dis. 2017;11:e0005376. doi: 10.1371/journal.pntd.0005376. - DOI - PMC - PubMed
    1. Karkey, A. et al. The burden and characteristics of enteric fever at a healthcare facility in a densely populated area of kathmandu. PLoS One5, (2010). - PMC - PubMed
    1. Das SK, et al. Gastroenteritis due to typhoidal Salmonella: a decade of observation at an urban and a rural diarrheal disease hospital in Bangladesh. BMC Infect. Dis. 2014;14:435. doi: 10.1186/1471-2334-14-435. - DOI - PMC - PubMed
    1. Pham Thanh D, et al. The Molecular and Spatial Epidemiology of Typhoid Fever in Rural Cambodia. PLoS Negl. Trop. Dis. 2016;10:1–16. doi: 10.1371/journal.pntd.0004785. - DOI - PMC - PubMed

Publication types

LinkOut - more resources