. 2018 Apr 18:9:499.
doi: 10.3389/fpls.2018.00499. eCollection 2018.

Wheat miRNA TaemiR408 Acts as an Essential Mediator in Plant Tolerance to Pi Deprivation and Salt Stress via Modulating Stress-Associated Physiological Processes

Affiliations

Wheat miRNA TaemiR408 Acts as an Essential Mediator in Plant Tolerance to Pi Deprivation and Salt Stress via Modulating Stress-Associated Physiological Processes

Qianqian Bai et al. Front Plant Sci. .

Abstract

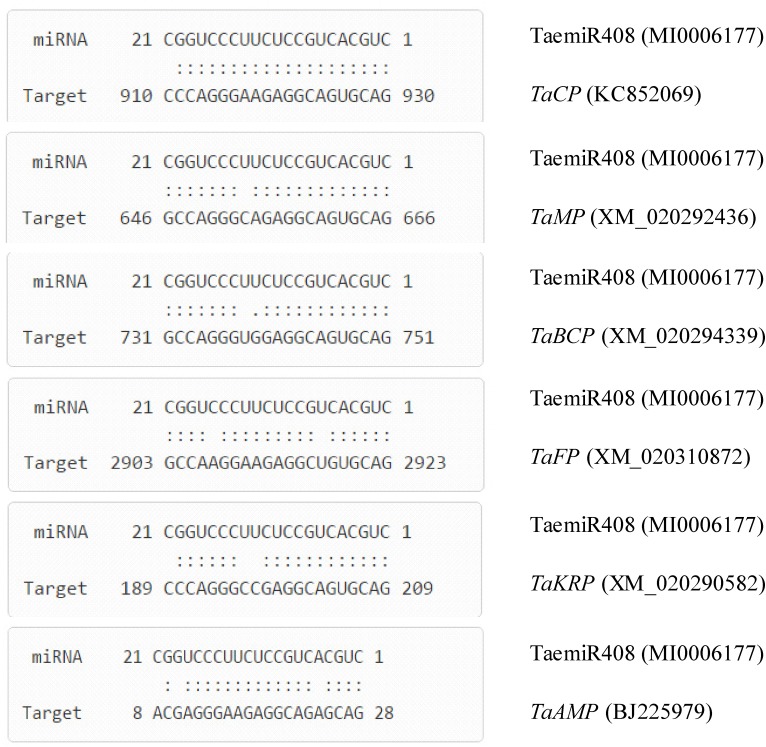
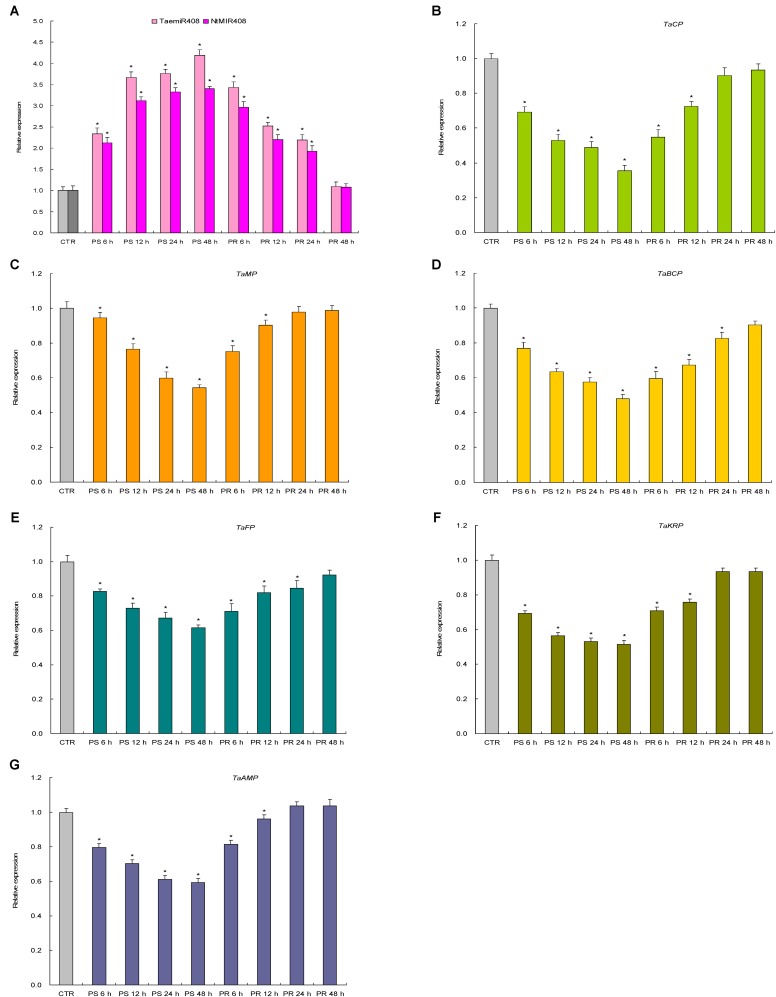
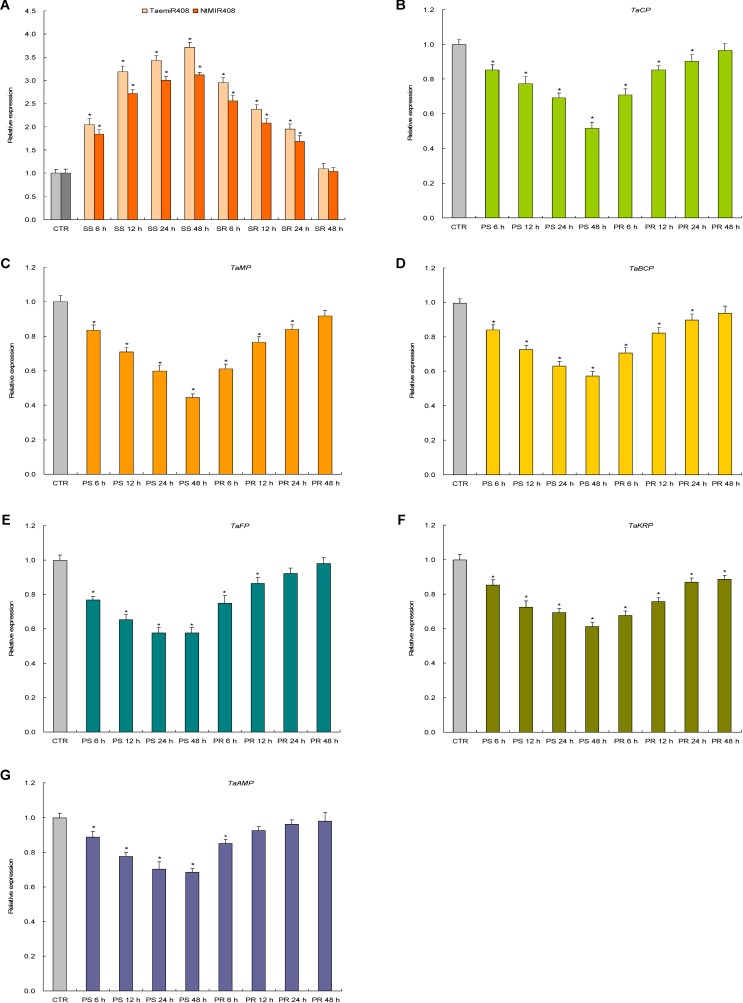
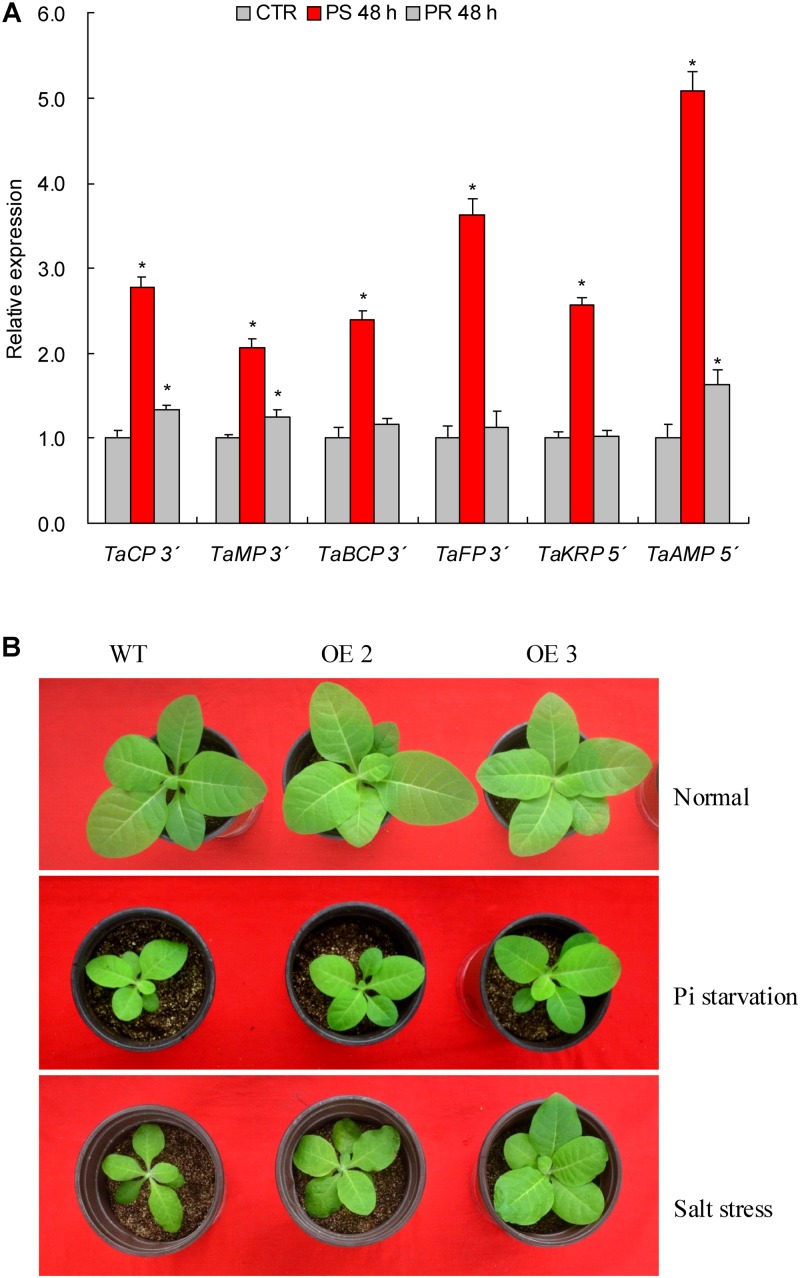
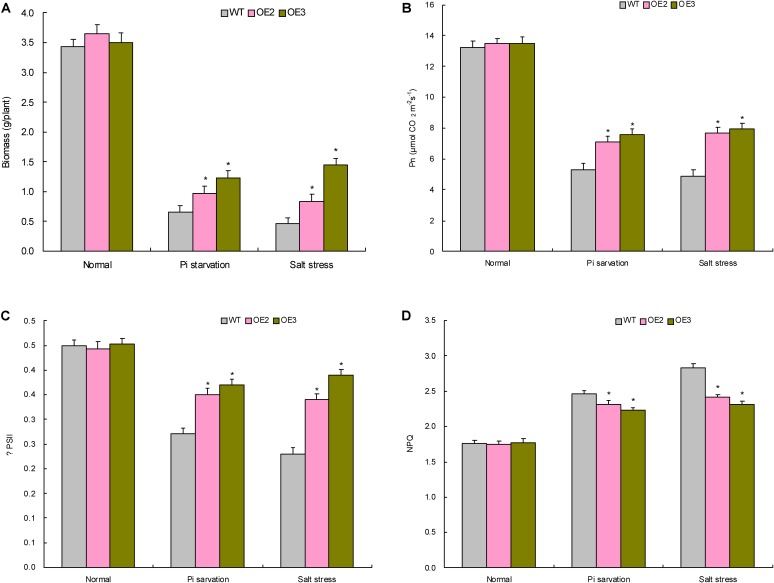
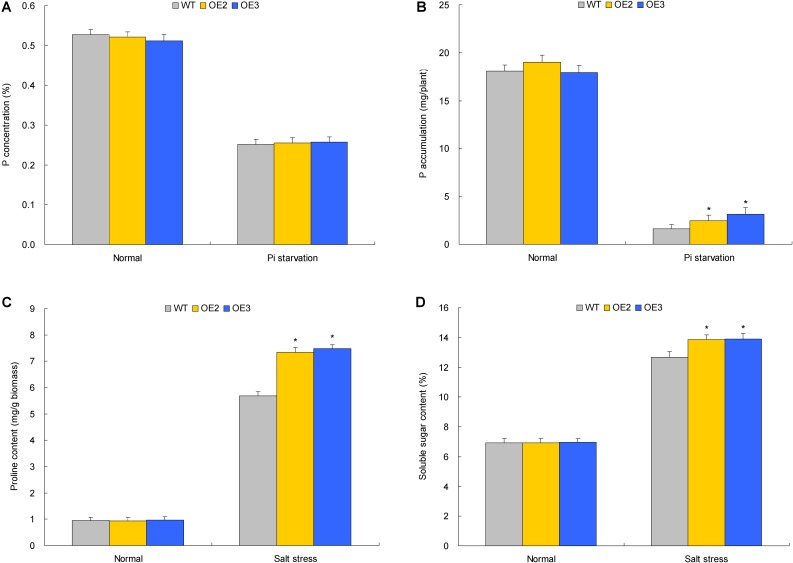
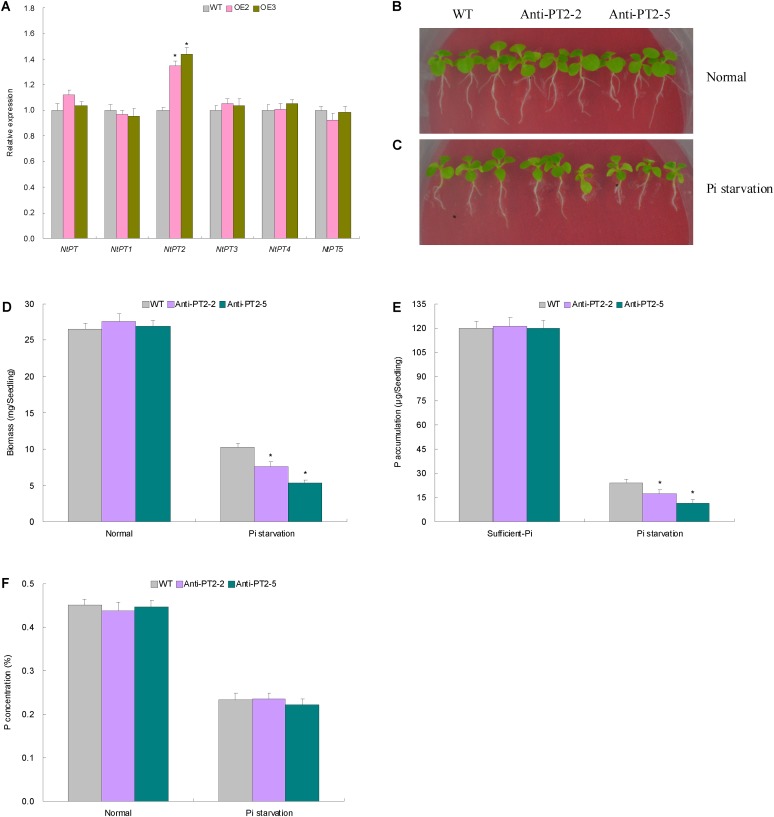
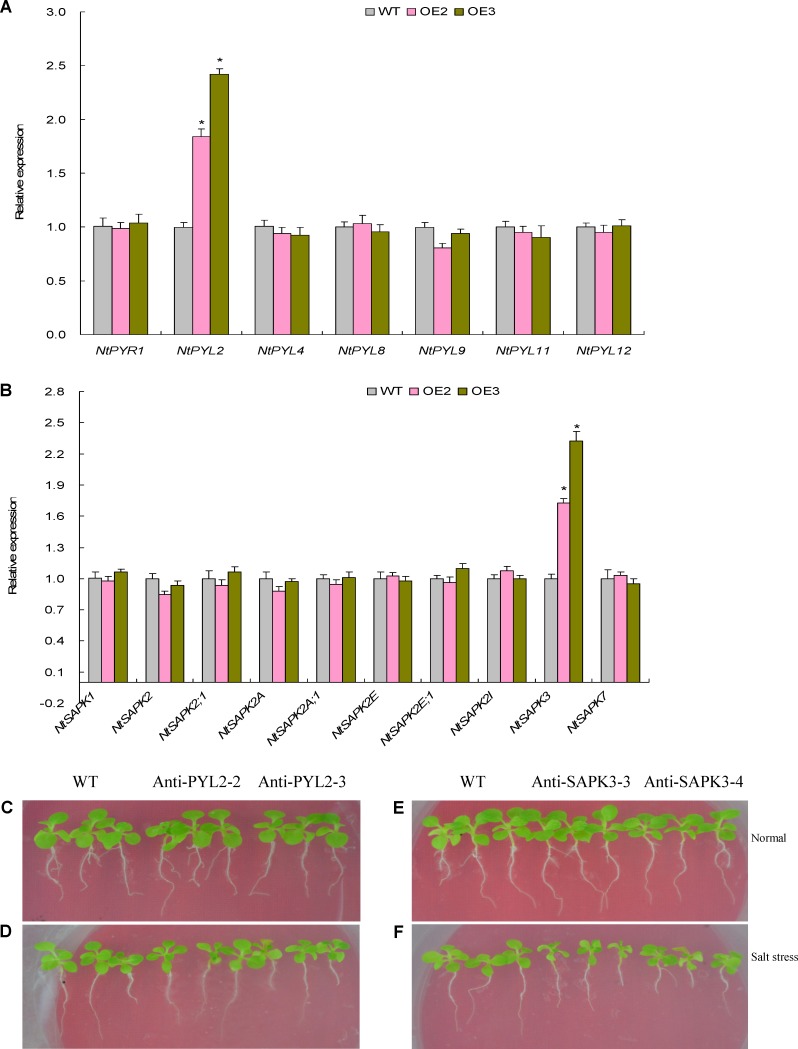
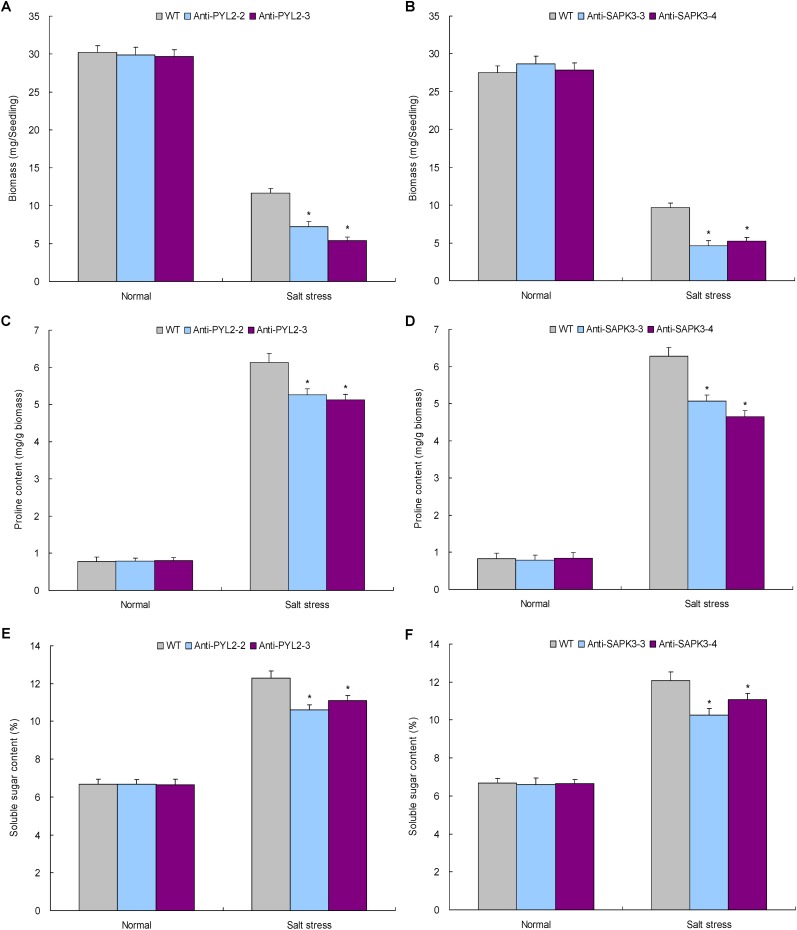
MicroRNAs (miRNA) families act as critical regulators for plant growth, development, and responses to abiotic stresses. In this study, we characterized TaemiR408, a miRNA family member of wheat (Triticum aestivum), for the role in mediating plant responses to Pi starvation and salt stress. TaemiR408 targets six genes that encode proteins involving biochemical metabolism, microtubule organization, and signaling transduction. 5'- and 3'-RACE analyses confirmed the mRNA cleavage of target genes mediated by this wheat miRNA. TaemiR408 showed induced expression patterns upon Pi starvation and salt stress and whose upregulated expression was gradually repressed by the normal recovery treatments. The target genes of TaemiR408 exhibited reverse expression patterns to this miRNA, whose transcripts were downregulated under Pi starvation and salt stress and the reduced expression was recovered by the followed normal condition. These results suggest the regulation of the target genes under TaemiR408 through a cleavage mechanism. Tobacco lines with TaemiR408 overexpression exhibited enhanced stress tolerance, showing improved phenotype, biomass, and photosynthesis behavior compared with wild type under both Pi starvation and salt treatments, which closely associate increased P accumulation upon Pi deprivation and elevated osmolytes under salt stress, respectively. Phosphate transporter (PT) gene NtPT2 displays upregulated transcripts in the Pi-deprived TaemiR408 overexpressors; knockdown of this PT gene reduces Pi acquisition under low-Pi stress, confirming its role in improving plant Pi taken up. Likewise, NtPYL2 and NtSAPK3, genes encoding abscisic acid (ABA) receptor and SnRK2 protein, respectively, exhibited upregulated transcripts in salt-challenged TaemiR408 overexpressors; knockdown of them caused deteriorated growth and lowered osmolytes amounts of plants upon salt treatment. Thus, TaemiR408 is crucial for plant adaptations to Pi starvation and salt stress through regulating Pi acquisition under low-Pi stress and remodel ABA signaling pathway and osmoprotects biosynthesis under salt stress.

Keywords: Pi acquisition; Pi starvation; abiscisic acid signaling; miRNA member; plant growth; salt stress; wheat (Triticum aestivum L.).


Figures

FIGURE 1
FIGURE 1
Base pairing characterization between TaemiR408 and its target genes. TaCP (wheat chemocyanin encoding gene), TaMP (wheat mavicyanin encoding gene), TaBCP (wheat blue copper protein encoding gene), TaFP (wheat filament encoding gene), TaKRP (wheat F-box/kelch-repeat protein encoding gene), and TaAMP (wheat AMP-binding protein encoding gene), six genes that are interacted by TaemiR408.
FIGURE 2
FIGURE 2
The expression patterns of TaemiR408, its tobacco paralog NtMIR408, and the target genes of TaemiR408 upon Pi starvation and Pi recovery treatments. (A) Expression patterns of TaemiR408 and NtMIR408; (B) expression patterns of TaCP; (C) expression patterns of TaMP; (D) expression patterns of TaBCP; (E) expression patterns of TaFP; (F) expression patterns of TaKRP, (G) expression patterns of TaAMP. Data are normalized by internal standards and shown by average plus standard error. CTR, control (before Pi starvation treatment). PS 6 h, PS 12 h, PS 24 h, and PS 48 h, time points after Pi starvation treatment. PR 6 h, PR 12 h, PR 24 h, and PR 48 h, time points after Pi recovery treatment. In (A–G), data are shown by average plus standard error and indicates to be statistically significant compared with CTR (P < 0.05).
FIGURE 3
FIGURE 3
The expression patterns of TaemiR408, its tobacco paralog NtMIR408, and the target genes of TaemiR408 upon salt stress and normal recovery treatments. (A) Expression patterns of TaemiR408 and NtMIR408; (B) expression patterns of TaCP; (C) expression patterns of TaMP; (D) expression patterns of TaBCP; (E) expression patterns of TaFP; (F) expression patterns of TaKRP; (G) expression patterns of TaABP. Data are normalized by internal standards and shown by average plus standard error. CTR, control (before salt treatment). PS 6 h, PS 12 h, PS 24 h, and PS 48 h, time points after salt treatment. PR 6 h, PR 12 h, PR 24 h, and PR 48 h, time points after normal recovery treatment. In (A–G), data are shown by average plus standard error and indicates to be statistically significant compared with CTR (P < 0.05).
FIGURE 4
FIGURE 4
The 5′- and 3′-RACE results of target genes and phenotypes of TaemiR408 overexpression lines under the Pi starvation and salt stress treatments. (A) The 5′- and 3′-RACE results of the target genes. (B) The phenotypes of TaemiR408 overexpression lines under the Pi starvation and salt stress treatments. In (A), TaCP, TaMP, TaBCP, TaFP, TaKRP and TaABP, six genes that are targeted by TaemiR408. CTR, control (before Pi starvation treatment). PS 48 h, PR 48 h, the time points of 48 h after Pi starvation and 48 h after Pi normal recovery treatments, respectively. Data are shown by average plus standard error and indicates to be statistically significant compared with CTR (P < 0.05). In (B), OE2 and OE3, two lines with TaemiR408 overexpression; WT, wild type.
FIGURE 5
FIGURE 5
The biomass and photosynthesis parameters of the transgenic lines with TaemiR408 overexpression under the Pi starvation and salt stress treatments. (A) Biomass; (B) Pn; (C) ΨPSII; (D) NPQ. OE2 and OE3, two lines with TaemiR408 overexpression; WT, wild type. Data are shown by average plus standard error and indicates to be statistically significant compared with WT (P < 0.05).
FIGURE 6
FIGURE 6
The P concentrations, P accumulation, proline contents, and the soluble sugar contents in transgenic lines with TaemiR408 overexpression under the Pi starvation and salt stress treatments. (A) P concentration; (B) P accumulation; (C) proline content; (D) soluble sugar content. OE2 and OE3, two lines with TaemiR408 overexpression; WT, wild type. (A,B) Data sets shown are obtained under the Pi starvation treatment; (C,D) data sets shown are obtained under the salt stress treatment. Data in (A–D) are shown by average plus standard error and indicates to be statistically significant compared with WT (P < 0.05).
FIGURE 7
FIGURE 7
The expression patterns and the biological function results on the tobacco phosphate transporter (PT) genes. (A) The expression patterns of the tobacco PT genes in the Pi-deprived WT and lines with TaemiR408 overexpression. (B) The phenotypes in the lines with NtPT2 knockdown expression under the normal condition; (C) the phenotypes in the lines with NtPT2 knockdown under the Pi starvation treatment; (D) the biomass in the lines with NtPT2 knockdown expression; (E) the P accumulation in the lines with NtPT2 knockdown expression; (F) the P concentrations in the lines with NtPT2 knockdown expression. In (D–F), Anti-PT2-2 and Anti-PT2-5, two lines with NtPT2 knockdown; WT, wild type. In (A), and (D–F), data are shown by average plus standard error and indicates to be statistically significant compared with WT (P < 0.05).
FIGURE 8
FIGURE 8
The expression patterns and functional characterization results on the tobacco ABA signaling genes. (A) The expression patterns of the ABA receptor genes; (B) the expression patterns of the SnRK2 family genes; (C) the phenotypes in the lines with NtPYL2 knockdown expression; (D) the phenotypes in the lines with NtSPAK3 knockdown expression. In (A,B), data are shown by average plus standard error and indicates to be statistically significant compared with WT (P < 0.05). In (C,D), Anti-PYL2-2 and Anti-PYL2-3, two lines with NtPYL2 knockdown expression. In (E,F), Anti-SAPK3-3 and Anti-SAPK3-4, two lines with NtSAPK3 knockdown expression.
FIGURE 9
FIGURE 9
The biomass, proline contents, and the soluble sugar contents in the lines with NtPYL2 and NtSAPK3 knockdown expression under the salt stress treatment. (A,B) The biomass; (C,D) the proline content; (E,F), the soluble sugar content. Anti-PYL2-2 and Anti-PYL2-3, two lines with NtPYL2 knockdown expression; Anti-SAPK3-3 and Anti-SAPK3-4, two lines with NtSAPK3 knockdown expression; WT, wild type. Data are shown by average plus standard error and indicates to be statistically significant compared with WT (P < 0.05).

References

    1. Baek D., Chun H. J., Kang S., Shin G. K., Park S. J., Hong H., et al. (2016). A role for Arabidopsis miR399f in salt, drought, and ABA signaling. Mol. Cells 39 111–118. 10.14348/molcells.2016.2188 - DOI - PMC - PubMed
    1. Baek D., Park H. C., Kim M. C., Yun D. J. (2013). The role of Arabidopsis MYB2 in miR399f-mediated phosphate-starvation response. Plant Signal. Behav. 8:e23488. 10.4161/psb.23488 - DOI - PMC - PubMed
    1. Bakhshi B., Fard E. M., Gharechahi J., Safarzadeh M., Nikpay N., Fotovat R., et al. (2017). The contrasting microRNA content of a drought tolerant and a droughtsusceptible wheat cultivar. J. Plant Physiol. 216 35–43. 10.1016/j.jplph.2017.05.012 - DOI - PubMed
    1. Barciszewska-Pacak M., Milanowska K., Knop K., Bielewicz D., Nuc P., Plewka P., et al. (2015). Arabidopsis microRNA expression regulation in a wide range of abiotic stress responses. Front. Plant Sci. 6:410. 10.3389/fpls.2015.00410 - DOI - PMC - PubMed
    1. Bari R., Pant B. D., Stitt M., Scheible W. R. (2006). PHO2, microRNA399, and PHR1 define a phosphate-signaling pathway in plants. Plant Physiol. 141 988–999. 10.1104/pp.106.079707 - DOI - PMC - PubMed