. 2018 Mar 8;8(8):2202-2216.
doi: 10.7150/thno.24003. eCollection 2018.

OVOL2 links stemness and metastasis via fine-tuning epithelial-mesenchymal transition in nasopharyngeal carcinoma

Affiliations

OVOL2 links stemness and metastasis via fine-tuning epithelial-mesenchymal transition in nasopharyngeal carcinoma

Xue-Kang Qi et al. Theranostics. .

Abstract

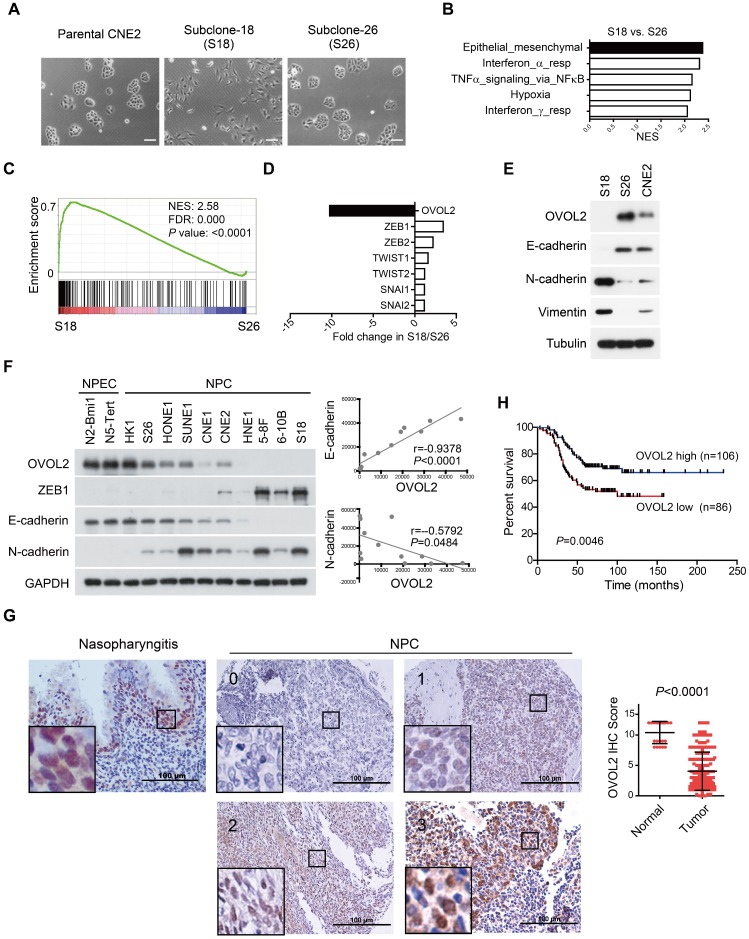
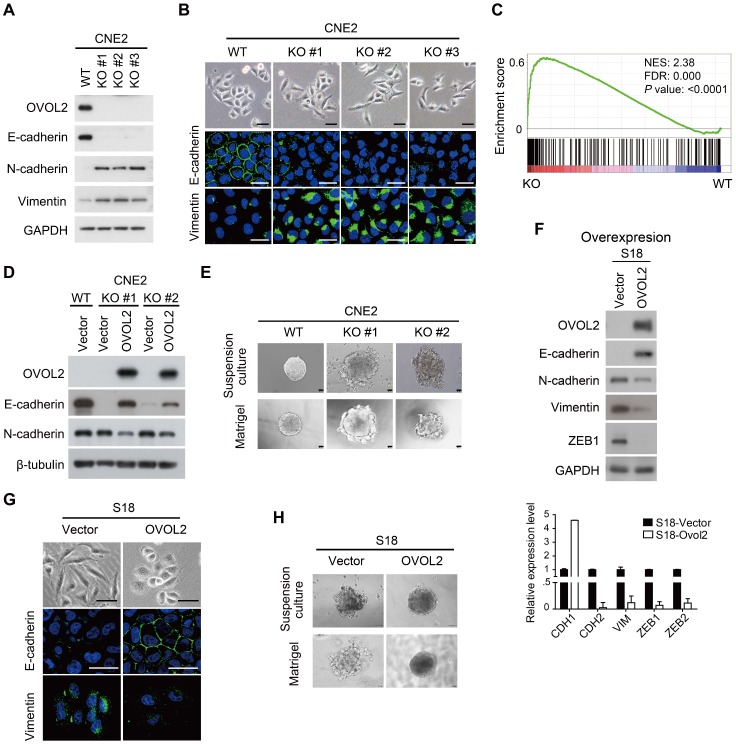
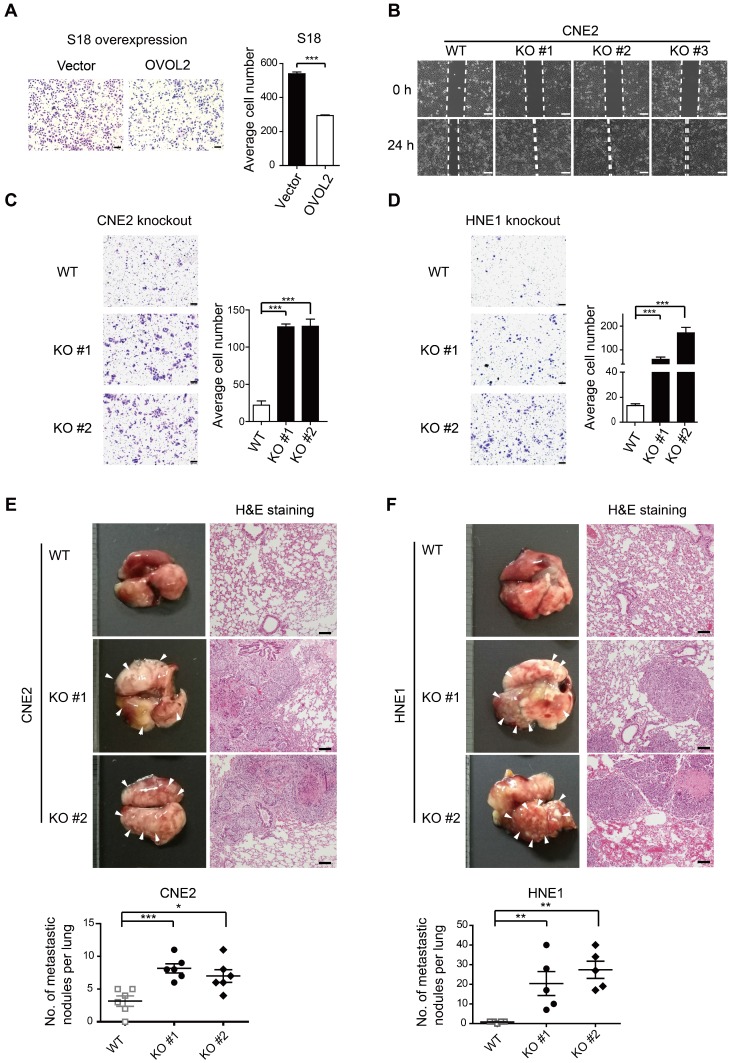
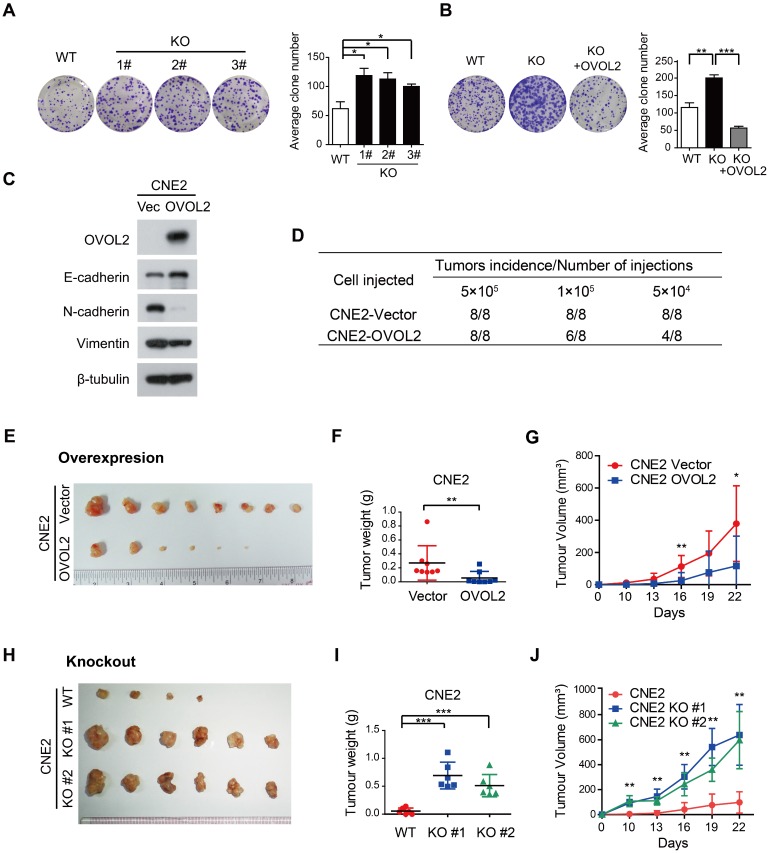
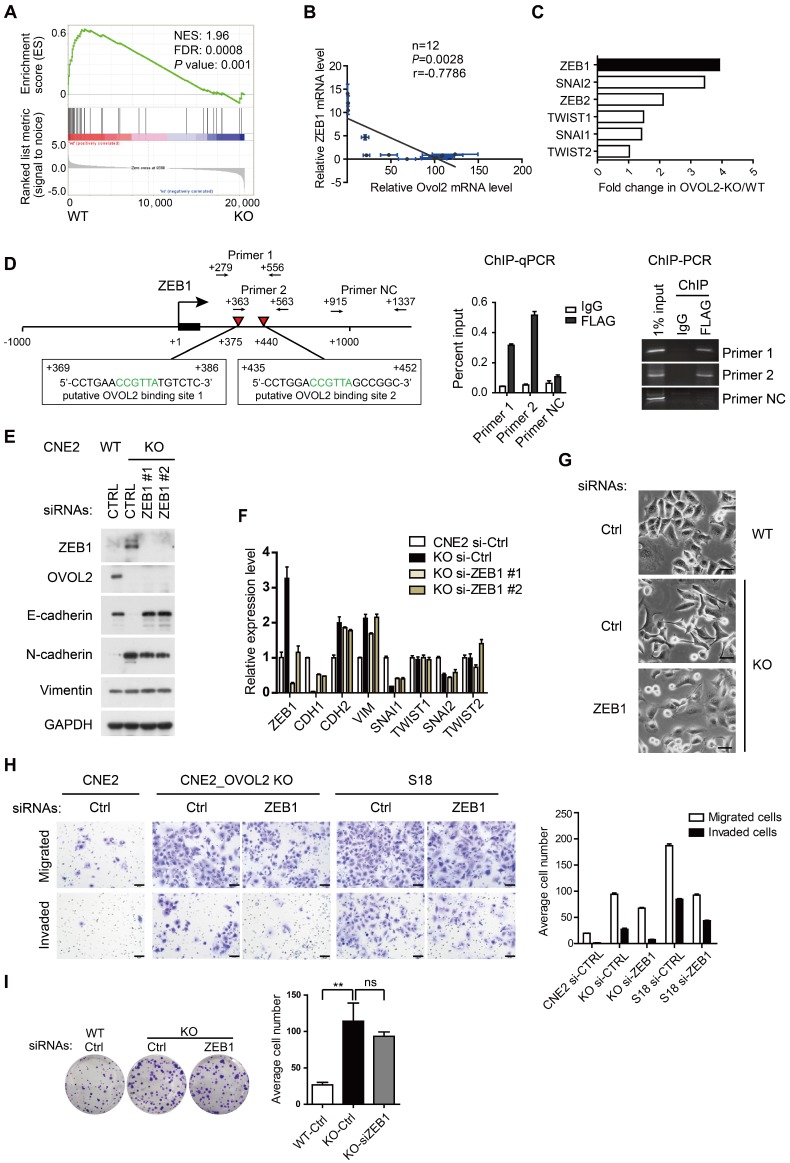
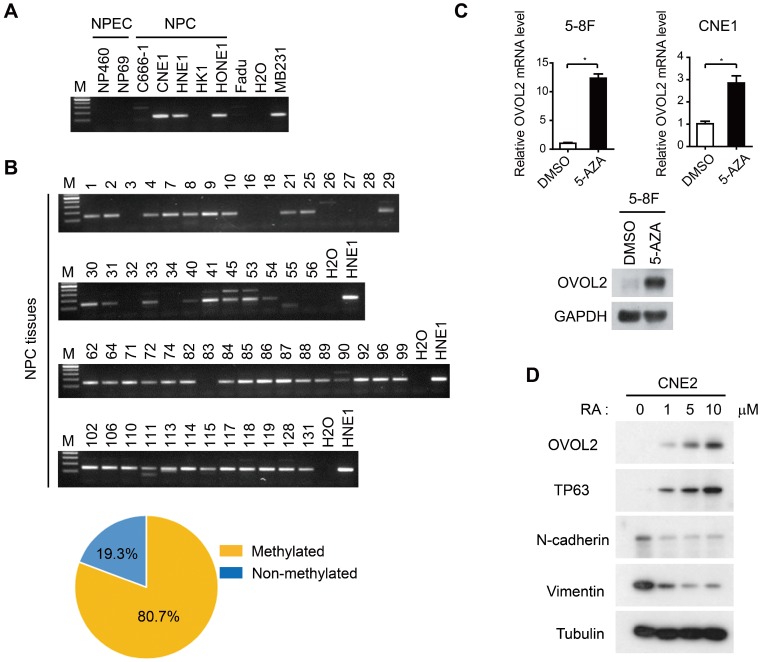
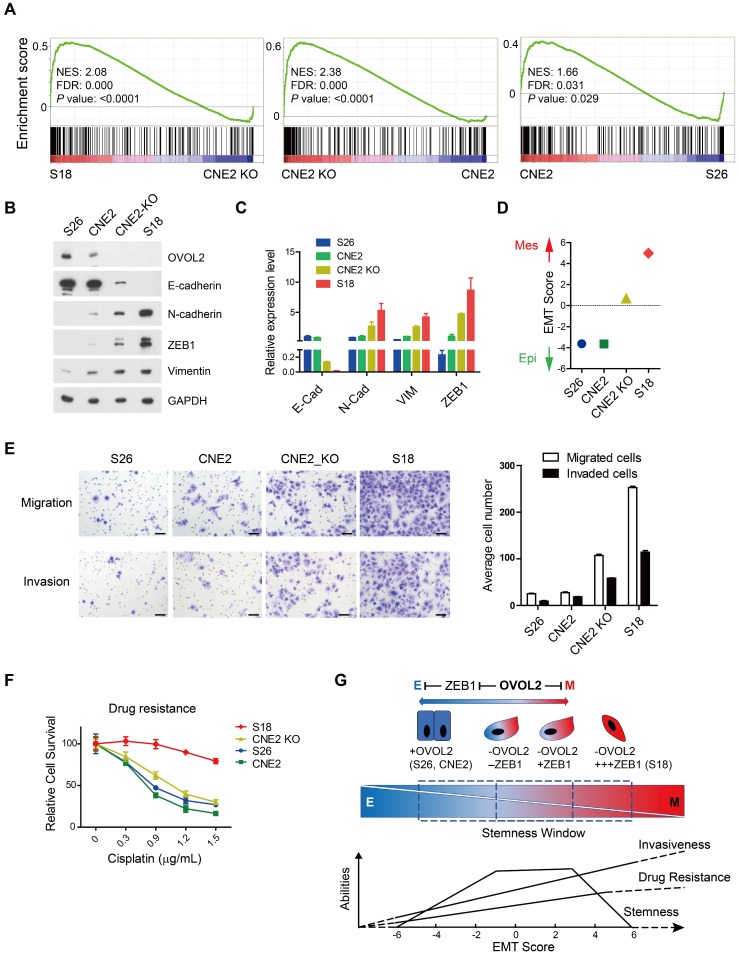
Rationale: Metastasis is the leading cause of disease-related death among patients with nasopharyngeal carcinoma (NPC). Mounting evidence suggest that epithelial-mesenchymal transition (EMT) is crucial for cancer cells to acquire metastatic ability. In this study, we aim to clarify the extent to which EMT is involved in various cancer properties and identify novel markers for predicting the prognosis of NPC patients. Methods: Two cellular models derived from the same NPC cell line with distinct metastasis ability were used for microarray analysis to identify key transcriptional factors that drive metastasis. Cell migration and invasion were analyzed by wound healing and Transwell analysis. Lung metatasis was determined by tail vein injection assay. Cancer stemness was analyzed using colony formation and xenograft assay. The EMT extent was evaluated using immunoblotting, RT-qPCR and immunofluorescence of EMT markers. The value of OVOL2 in prognosis was determined by immunohistochemistry in NPC biopsies. Results: OVOL2 was the most significantly down-regulated EMT transcription factor (EMT-TF) in cellular models of NPC metatasis. Low levels of OVOL2 were associated with poor overall survival of NPC patients and the reduced expression is partly due to promoter methylation and epithelial dedifferentiation. Knockout of OVOL2 in epithelial-like NPC cells partially activates EMT program and significantly promotes cancer stemness and metastatic phenotypes. Conversely, ectopically expression of OVOL2 in mesenchymal-like cells leads to a partial transition to an epithelial phenotype and reduced malignancy. Reversing EMT by depleting ZEB1, a major target of OVOL2, does not eliminate the stemness advantage of OVOL2-deficient cells but does reduce their invasion capacity. A comparison of subpopulations at different stages of EMT revealed that the extent of EMT is positively correlated with metastasis and drug resistance; however, only the intermediate EMT state is associated with cancer stemness. Conclusion: Distinct from other canonical EMT-TFs, OVOL2 only exhibits modest effect on EMT but has a strong impact on both metastasis and tumorigenesis. Therefore, OVOL2 could serve as a prognostic indicator for cancer patients.

Keywords: EMT; OVOL2; metastasis; nasopharyngeal carcinoma; stemness.


Conflict of interest statement

Competing Interests: The authors have declared that no competing interest exists.

Figures

Figure 1
Figure 1
OVOL2 is down-regulated during EMT and in NPC tissues. (A) The morphology of CNE2, subclone-18 (S18) and subclone-26 (S26) cells by bright field microscopy (scale bar = 100 μm). (B) Gene set enrichment analysis (GSEA) of microarray data on S18 and S26 cells. NES: normalized enrichment score. (C) GSEA plot reveals an enrichment of a gene signature associated with EMT between S18 and S26 cells. FDR: false-discovery rate. (D) Fold change in the expression of EMT-transcription factors between S18 and S26 cells from microarray data. (E) Western blotting analysis of OVOL2 and EMT markers in CNE2, S18 and S26 cells. (F) (left) Western blotting analysis of OVOL2 and EMT markers in NPEC/NPC cell lines. (right) Pearson correlation between OVOL2 and E- or N-cadherin protein levels. Densitometry quantifications were performed with ImageJ software. (G) Immunohistochemistry analysis of OVOL2 expression in 22 normal nasopharyngeal epithelium samples and 192 primary tumor samples (scale bar = 100 μm), together with an enlarged view of each in the corresponding inset. (H) Kaplan-Meier survival curve of the overall survival of 192 NPC patients stratified by OVOL2 expression (high-expression group: IHC score ≥3; low-expression group: IHC score <3). The data were statistically evaluated using the log-rank test.
Figure 2
Figure 2
OVOL2 inhibits EMT. (A) Western blot (WB) analysis of EMT markers in OVOL2-knockout (KO) CNE2 cell lines. (B) Morphological changes in OVOL2-KO cells were observed by bright field microscopy, and immunofluorescence analysis of E-cadherin and Vimentin was performed in CNE2 wild-type (WT) and KO cells (scale bar = 50 μm). (C) GSEA plot showing an enrichment of gene signatures associated with EMT between OVOL2-WT and OVOL2-KO cells. (D) WB analysis of EMT markers in OVOL2-KO cells before and after reconstitution with ectopic OVOL2. (E) Morphological features of OVOL2-WT and OVOL2-KO cells in suspension culture or in Matrigel (scale bar = 50 μm). (F) WB and qPCR analysis of EMT markers in S18 cells with or without OVOL2 overexpression. (G) Morphology and E-cadherin and Vimentin staining in S18 cells with or without OVOL2 overexpression (scale bar = 50 μm). (H) Morphology of S18 cells with or without OVOL2 overexpression in suspension culture or in Matrigel (scale bar = 50 μm).
Figure 3
Figure 3
OVOL2 suppresses the migration and metastasis of NPC cells. (A) Representative image and quantification of Transwell cell migration assays with S18 cells stably expressing ectopic OVOL2 or empty vector. n = 3, scale bar = 100 μm. (B) Wound healing assays with CNE2 WT and OVOL2-KO cells. (C) Representative image and quantification of Transwell cell invasion assays with CNE2 WT and OVOL2-KO cells. n = 3, scale bar = 100 μm. (D) Representative image and quantification of Transwell cell invasion assays with HNE1 WT and OVOL2-KO cells. (E) (left) Metastatic nodules on the lung surface driven by tail vein injection of CNE2 WT and OVOL2-KO cells were counted with the naked eye, n = 6. (right) Lung sections stained by hematoxylin and eosin (H&E) showed more metastatic nodules in KO cells than in WT cells. (F) Metastasis assay as in (E) with HNE1 WT and OVOL2-KO cells, n = 5. Data are presented as the mean ± SD. *p<0.05, **p<0.01, *** p<0.001.
Figure 4
Figure 4
OVOL2 negatively regulates the tumorigenicity of NPC. (A) OVOL2 knockout (KO) in CNE2 cells increased the ability to form colonies on conventional plates. Mean ± SD, n = 3. (B) Colony formation of CNE2 WT, OVOL2-KO and OVOL2-KO cells reconstituted with ectopic OVOL2 (n = 3). (C) EMT marker expression in CNE2 cells stably expressing OVOL2 or empty vector. (D) Serial transplantation experiments using limiting dilutions of WT or OVOL2-KO CNE2 cells (n = 8 mice for each dilution). (E) CNE2 cells stably expressing OVOL2 or empty vector were subcutaneously injected into nude mice, and images were taken 22 days post-implantation. (F) Tumor weight in mice injected s.c. with CNE2 control or OVOL2-overexpressing cells (1×10⁵ cells; n = 8). (G) Growth curves of xenograft tumors formed by CNE2 cells stably expressing OVOL2 or empty vector (1×10⁵ cells were inoculated s.c.; n = 8). (H) WT or OVOL2-KO CNE2 cells were subcutaneously injected into nude mice, and images were taken 22 days post-implantation. (I) Tumor weight in mice injected with CNE2 WT or OVOL2-KO cells. (J) Growth curves of xenograft tumors formed by WT or OVOL2-KO CNE2 cells (5×10⁴ cells were inoculated s.c.; n = 6).
Figure 5
Figure 5
Reversal of EMT by ZEB1 knockdown in OVOL2-deficient cells. (A) GSEA of transcriptome data from WT versus OVOL2-KO cells revealed an enrichment of gene signatures associated with the down-regulation of ZEB1 target genes. (B) Correlation analysis of OVOL2 and ZEB1 mRNA expression in NPEC/NPC cell lines (two-tailed Pearson correlation). Blue line: error bar. (C) Fold changes in the expression of EMT-TFs between WT and OVOL2-KO CNE2 cells from microarray data. (D) (left) Diagram showing the presence of OVOL2 consensus motifs in the first intron of human ZEB1 gene. Black: exon 1; red triangle: putative OVOL2 binding sites; arrowhead: primers used in ChIP-qPCR/PCR; +1: transcriptional start site. (right) ChIP-qPCR/PCR analysis in CNE2 cells transfected with FLAG-OVOL2 showed that immunoprecipitation (IP) with anti-FLAG antibody results in enrichment of the two putative binding sites compared with IP with control immunoglobulin. (E) Protein levels of EMT-related genes with or without ZEB1 knockdown in OVOL2-KO cells. (F) mRNA levels of EMT-related genes in cells described in (E). (G) Morphology of CNE2 WT, CNE2 OVOL2-KO and S18 cells with or without ZEB1 knockdown (scale bar = 50 μm). (H) Representative image and quantification of Transwell cell migration and invasion assays with CNE2 WT, OVOL2-KO and S18 cells. n = 3, scale bar = 50 μm. (I) Colony formation of OVOL2-KO cells with or without ZEB1 knockdown. Mean ± SD, n = 3.
Figure 6
Figure 6
Regulation of OVOL2 in NPC. (A) Methylation-specific PCR (MSP) of the OVOL2 promoter in NPEC and NPC cell lines. (B) MSP of the OVOL2 promoter in 57 NPC tissues. (C) 5-Aza-2′-deoxycytidine (5-AZA) up-regulated OVOL2 expression in 5-8F and CNE1 cells as determined by qPCR (n = 4) and Western blotting. Cells were treated with 2.5 μM 5-AZA for 72 h. (D) All-trans-retinoic acid (RA) induced the differentiation of CNE2 cells and up-regulated OVOL2. Cells were treated with various concentrations of RA as indicated for 72 h.
Figure 7
Figure 7
Loss of OVOL2 leads to partial EMT, which confers NPC with stemness properties. (A) GSEA of transcriptome data from S18, CNE2 OVOL2_KO, CNE2 WT and S26 cells reveals the enrichment of an EMT signature. (B) Western blot analysis of OVOL2 and EMT markers in S18, CNE2 OVOL2_KO, CNE2 WT and S26 cells. (C) qPCR analysis of OVOL2 and EMT markers in cells in (B). (D) EMT scores of cell lines in (B). (E) Migration and invasion ability of cell lines in (B) determined by Transwell assays (scale bar = 100 μm). (F) Cisplatin sensitivity of cells in (B) determined by treatment with various concentrations of cisplatin for 72 h. Cell viability was determined by CCK8 assay. (G) Proposed model of metastasis, drug resistance and stemness properties across the EMT spectrum.

Comment in

  • OVOL2 in metastasis prevention in NPC.
    Song KA, Faber AC. Song KA, et al. Theranostics. 2018 Mar 8;8(8):2242-2244. doi: 10.7150/thno.25181. eCollection 2018. Theranostics. 2018. PMID: 29721076 Free PMC article.

References

    1. Wei KR, Zheng RS, Zhang SW, Liang ZH, Ou ZX, Chen WQ. Nasopharyngeal carcinoma incidence and mortality in China in 2010. Chin J Cancer. 2014;33:381–7. - PMC - PubMed
    1. Kamran SC, Riaz N, Lee N. Nasopharyngeal carcinoma. Surg Oncol Clin N Am. 2015;24:547–61. - PubMed
    1. Chua ML, Wee JT, Hui EP, Chan AT. Nasopharyngeal carcinoma. Lancet. 2016;387:1012–24. - PubMed
    1. Shibue T, Weinberg RA. EMT, CSCs, and drug resistance: the mechanistic link and clinical implications. Nat Rev Clin Oncol. 2017;14:611–29. - PMC - PubMed
    1. Thiery JP, Acloque H, Huang RY, Nieto MA. Epithelial-mesenchymal transitions in development and disease. Cell. 2009;139:871–90. - PubMed

Publication types

MeSH terms

Substances