. 2018 Mar 26;8(8):4120-4135.
doi: 10.1002/ece3.3973. eCollection 2018 Apr.

Structural and functional responses of plant communities to climate change-mediated alterations in the hydrology of riparian areas in temperate Europe

Affiliations

Structural and functional responses of plant communities to climate change-mediated alterations in the hydrology of riparian areas in temperate Europe

Annette Baattrup-Pedersen et al. Ecol Evol. .

Abstract

The hydrology of riparian areas changes rapidly these years because of climate change-mediated alterations in precipitation patterns. In this study, we used a large-scale in situ experimental approach to explore effects of drought and flooding on plant taxonomic diversity and functional trait composition in riparian areas in temperate Europe. We found significant effects of flooding and drought in all study areas, the effects being most pronounced under flooded conditions. In near-stream areas, taxonomic diversity initially declined in response to both drought and flooding (although not significantly so in all years) and remained stable under drought conditions, whereas the decline continued under flooded conditions. For most traits, we found clear indications that the functional diversity also declined under flooded conditions, particularly in near-stream areas, indicating that fewer strategies succeeded under flooded conditions. Consistent changes in community mean trait values were also identified, but fewer than expected. This can have several, not mutually exclusive, explanations. First, different adaptive strategies may coexist in a community. Second, intraspecific variability was not considered for any of the traits. For example, many species can elongate shoots and petioles that enable them to survive shallow, prolonged flooding but such abilities will not be captured when applying mean trait values. Third, we only followed the communities for 3 years. Flooding excludes species intolerant of the altered hydrology, whereas the establishment of new species relies on time-dependent processes, for instance the dispersal and establishment of species within the areas. We expect that altered precipitation patterns will have profound consequences for riparian vegetation in temperate Europe. Riparian areas will experience loss of taxonomic and functional diversity and, over time, possibly also alterations in community trait responses that may have cascading effects on ecosystem functioning.

Keywords: climate change; drought; flooding; lowland; plant; trait; vegetation.


Figures
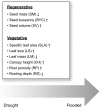
Figure 1
Figure 1
Hypothesized changes in community trait composition moving from drought to flooded conditions. Arrows indicate whether a trait is expected to increase or decrease with increased flooding, with an expectation of the opposite response to drought
Figure 2
Figure 2
A schematic presentation of the experimental setup applied in our study. The control section is situated upstream of the drought and flooded sections with buffers in‐between. Flooding was created by constructing dams (marked as bars on the figure) to obstruct the water flow in the main channels. (a) In Denmark, a lateral dam of sandbags was constructed across the stream channel. (b) In Germany and the Netherlands, longitudinal dams were built within the channel, which together with a lateral dam across the channel obstructed the water flow in the main channel. (c) The position of the sample transects within the experimental sections. The first piezometer was placed just above the summer water table (position 1), the second piezometer just above the normal winter water table (position 2) and the third at the high end of the floodplain (position 3). The circles indicate the position of the piezometers along each transect
Figure 3
Figure 3
Ordination plots of the canonical correspondence analyses (CCAs) of plant species composition within each riparian area (Boye, Groote Molenbeek, Sandemandsbækken, and Voel Bæk). In the CCAs, species composition was constrained by the type of vegetation (seed, existing, and bareplot), whereas the variation in species composition explained by treatment (flood, drought, control) and year (2011, 2012, 2013) was partialled out. Traits significantly associated with the CCA axes (p < .05) are plotted onto the ordination
Figure 4
Figure 4
Ordination plots of the canonical correspondence analyses (CCAs) of plant species composition within each stream (Boye, Groote Molenbeek, Sandemandsbækken, and Voel Bæk). In the CCAs, species composition was constrained by treatment (flood, drought, control), whereas the variation in species composition explained by type of vegetation (seed, existing, and bareplot) and year (2011, 2012, 2013) was partialled out. Trait vectors significantly associated with the CCA axes (p < .05) are plotted onto the ordination
Figure 5
Figure 5
Average response ratios (±1 SE) of taxonomic diversity (richness and Shannon diversity) in plots positioned close to the stream channel just above the normal summer water table (position 1; a) and in plots situated just above the normal winter water table (position 2; b). No significant changes in richness or diversity occurred further up the floodplain, position 3, following the applied drought and flooding treatment. Open symbols (existing) comprise data for the vegetation surveys, whereas closed symbols (seed) comprise data for the seed trap surveys. The color of the asterisk indicates the type of vegetation differing significantly from zero (i.e., black asterisk = seed, white asterisk = existing)
Figure 6
Figure 6
Average response ratios (±1 SE) of functional trait diversity (FDis) (a) and trait composition (CWMs) (b) in plots positioned close to the stream channel just above the normal summer water table (position 1). When a response ratio is significantly different from zero, this is indicated with an asterisk above the error bar (p < .05). Open symbols (existing) comprise data for the vegetation surveys, whereas closed symbols (seed) comprise data for the seed trap surveys. The color of the asterisk indicates the type of vegetation differing significantly from zero (i.e., black asterisk = seed, white asterisk = existing). Note that the scale for FDis for CH is different in comparison with the other traits
Figure 7
Figure 7
Average response ratios (±1 SE) of functional trait diversity (FDis) (a) and trait composition (CWMs) (b) in plots positioned just above the normal winter water table (position 2). When a response ratio is significantly different from zero, this is indicated with an asterisk above the error bar (p < .05). Open symbols (existing) comprise data for the vegetation surveys, whereas closed symbols (seed) comprise data for the seed trap surveys. The color of the asterisk indicates the type of vegetation differing significantly from zero (i.e., black asterisk = seed, white asterisk = existing. Note that the scale for FDis for SM is different in comparison with the other traits
Figure 8
Figure 8
Average response ratios (±1 SE) of functional trait diversity (FDis) (a) and trait composition (CWMs) (b) in plots positioned at the high end of the floodplain (position 3). When a response ratio is significantly different from zero, this is indicated with an asterisk above the error bar (p < .05). Open symbols (existing) comprise data for the vegetation surveys, whereas closed symbols (seed) comprise data for the seed trap surveys. The color of the asterisk indicates the type of vegetation differing significantly from zero (i.e., black asterisk = seed, white asterisk = existing). Note that the scale for FDis for BYC, LM, and LS is different in comparison with the other traits

References

    1. Ackerly, D. (2004). Functional strategies of chaparral shrubs in relation to seasonal water deficit and disturbance. Ecological Monographs, 74, 25–44. https://doi.org/10.1890/03-4022 - DOI
    1. Albert, C. H. , Grassein, F. , Schurr, F. M. , Vieilledent, G. , & Violle, C. (2011). When and how should intraspecific variability be considered in trait‐based plant ecology?. Perspectives in Plant Ecology, Evolution and Systematics, 13, 217–225. https://doi.org/10.1016/j.ppees.2011.04.003 - DOI
    1. Andersen, H. E. , Kronvang, B. , Larsen, S. E. , Hoffmann, C. C. , Jensen, T. S. , & Rasmussen, E. K. (2006). Climate‐change mediated impacts on hydrology and nutrients in a Danish lowland river basin. Science of the Total Environment, 365, 223–237. https://doi.org/10.1016/j.scitotenv.2006.02.036 - DOI - PubMed
    1. Armstrong, W. , Brandle, R. , & Jackson, M. B. (1994). Mechanisms of flood tolerance in plants. Acta Botanica Neerlandica, 43, 307–358. https://doi.org/10.1111/j.1438-8677.1994.tb00756.x - DOI
    1. Baattrup‐Pedersen, A. , Dalkvist, D. , Dybkjær, J. B. , Riis, T. , Larsen, S. E. , & Kronvang, B. (2013). Species recruitment following flooding, sediment deposition and seed addition in restored riparian areas. Restoration Ecology, 21, 399–408. https://doi.org/10.1111/j.1526-100X.2012.00893.x - DOI

LinkOut - more resources