. 2018 May;10(5):573-583.
doi: 10.2217/epi-2017-0143. Epub 2018 May 3.

Histone acetylation maps in aged mice developmentally exposed to lead: epigenetic drift and Alzheimer-related genes

Affiliations

Histone acetylation maps in aged mice developmentally exposed to lead: epigenetic drift and Alzheimer-related genes

Aseel Eid et al. Epigenomics. 2018 May.

Abstract

Aim: Early life exposure to lead (Pb) has been shown to increase late life biomarkers involved in Alzheimer's disease (AD) pathology. Here, we tested the hypothesis that latent over expression of AD-related genes may be regulated through histone activation pathways.

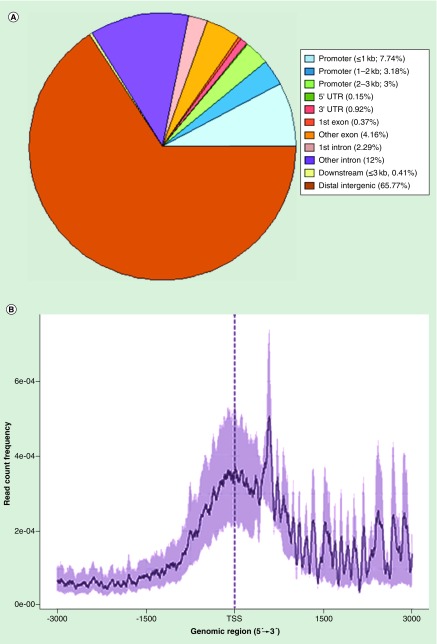
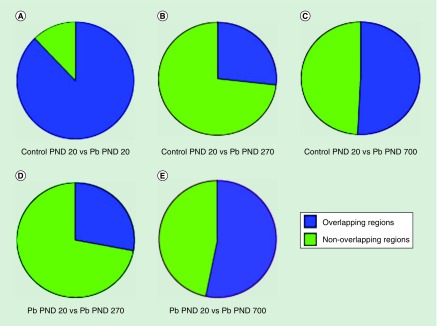
Methods: Chromatin immunoprecipitation sequencing was used to map the histone activation mark (H3K9Ac) to the mouse genome in developmentally Pb exposed mice on postnatal days 20, 270 and 700.

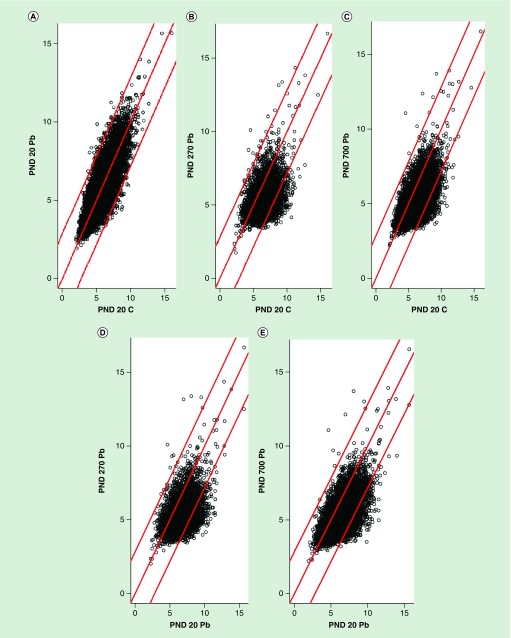
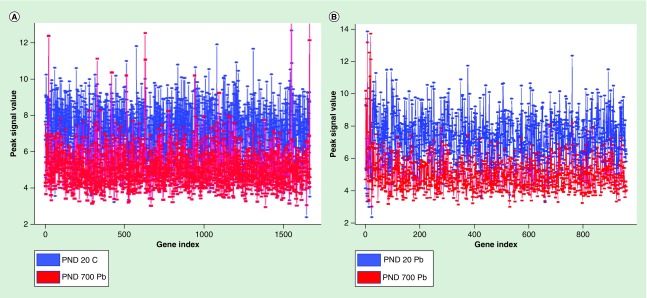
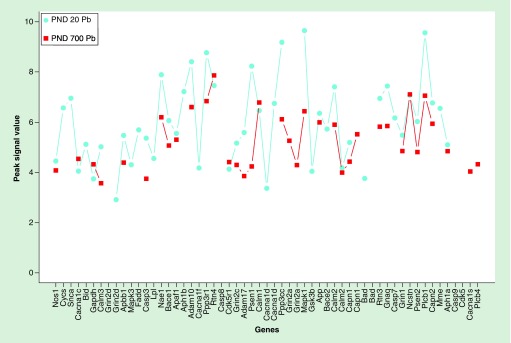
Results: Exposure to Pb resulted in a global downregulation of H3K9Ac across the lifespan; except in genes associated with the Alzheimer pathway.

Discussion: Early life exposure to Pb results in an epigenetic drift in H3K9Ac consistent with latent global gene repression. Alzheimer-related genes do not follow this trend.

Keywords: Alzheimer's disease; epigenetics; histone acetylation; lead (Pb).


Conflict of interest statement

Financial & competing interests disclosure

This research was supported by the Intramural Research Program of the NIH, National Institute of Environmental Health Sciences, and by grant 5RO1ES015867-03. This research is based in part upon work conducted using the Rhode Island IDeA Network for Excellence in Biomedical Research Bioinformatics Core which is supported by the NIH under grant 2P20GM103430. JM Gaspar and RP Hart were supported by NIH grants 1R01AT009152 to A-N Kong of Rutgers University and 1R01ES026057 and R21DA035594 to RP Hart. The authors have no other relevant affiliations or financial involvement with any organization or entity with a financial interest in or financial conflict with the subject matter or materials discussed in the manuscript apart from those disclosed.

No writing assistance was utilized in the production of this manuscript.

Figures

<b>Figure 1.</b>
Figure 1.. Distribution of histone peak regions within the genome.
(A) Displays the data in pie chart format, indicating the percentage of peaks obtained from the chromatin immunoprecipitation sequencing experiment in different genomic regions. (B) When examining 2000 base pairs in either direction of aggregated TSS, acetylation peak intensity tends to cluster around the TSS and promoter region. TSS: Transcription start site.
<b>Figure 2.</b>
Figure 2.. Overlapping H3K9Ac peak regions across the lifespan.
Figures display both overlapping and unique peaks among control and Pb exposed animals. (A) Control PND 20 versus Pb PND 20. (B) Control PND 20 versus Pb exposed PND 270. (C) Control PND 20 versus Pb exposed PND 700. (D) Pb exposed PND 20 versus Pb exposed PND 270. (E) Pb exposed PND 20 versus Pb exposed PND 700. Pb: Lead; PND: Postnatal day.
<b>Figure 3.</b>
Figure 3.. Differential histone acetylation.
Scatterplots display raw number of acetylation sites between the samples. The red basal line indicates where the values are equal between samples. (A) PND 20 control against PND 20 Pb exposed animals. (B) PND 20 control against PND 270 Pb exposed animals. (C) PND 20 control against PND 700 Pb exposed animals. (D) PND 20 Pb exposed against PND 270 Pb exposed animals. (E) PND 20 Pb exposed against PND 700 Pb exposed animals. Pb: Lead; PND: Postnatal day.
<b>Figure 4.</b>
Figure 4.. Line plot of common peak intensities with >twofold difference.
(A) Blue lines represent PND 20 control peak intensity values and red lines represent PND 700 Pb exposed peak intensity values. (B) Blue lines represent PND 20 Pb exposed peak intensity values and red lines represent PND 700 Pb exposed peak intensity. Pb: Lead; PND: Postnatal day.
<b>Figure 5.</b>
Figure 5.. Line plot of Ko5010 pathway genes with >twofold difference.
The turquoise points represent peak signal values of Pb exposed animals at PND 20, whereas the red points represent Pb exposed animals at PND 700. Pb: Lead; PND: Postnatal day.

Similar articles

Cited by

References

    1. Ravussin E, Redman LM, Rochon J, et al. A 2-year randomized controlled trial of human caloric restriction: feasibility and effects on predictors of health span and longevity. J. Gerontol. A Biol. Sci. Med. Sci. 2015;70(9):1097–1104. - PMC - PubMed
    1. Habauzit V, Morand C. Evidence for a protective effect of polyphenols-containing foods on cardiovascular health: an update for clinicians. Ther. Adv. Chronic Dis. 2012;3(2):87–106. - PMC - PubMed
    1. Portha B, Fournier A, Kioon MD, Mezger V, Movassat J. Early environmental factors, alteration of epigenetic marks and metabolic disease susceptibility. Biochimie. 2014;97:1–15. - PubMed
    1. Modgil S, Lahiri DK, Sharma VL, Anand A. Role of early life exposure and environment on neurodegeneration: implications on brain disorders. Transl. Neurodegener. 2014;3:9. - PMC - PubMed
    1. Tanner CM, Goldman SM, Ross GW, Grate SJ. The disease intersection of susceptibility and exposure: chemical exposures and neurodegenerative disease risk. Alzheimers Dement. 2014;10(3 Suppl.):S213–S225. - PubMed

Publication types

LinkOut - more resources