. 2018 Oct 15;34(20):3496-3502.
doi: 10.1093/bioinformatics/bty371.

polymapR-linkage analysis and genetic map construction from F1 populations of outcrossing polyploids

Affiliations

polymapR-linkage analysis and genetic map construction from F1 populations of outcrossing polyploids

Peter M Bourke et al. Bioinformatics. .

Erratum in

Abstract

Motivation: Polyploid species carry more than two copies of each chromosome, a condition found in many of the world's most important crops. Genetic mapping in polyploids is more complex than in diploid species, resulting in a lack of available software tools. These are needed if we are to realize all the opportunities offered by modern genotyping platforms for genetic research and breeding in polyploid crops.

Results: polymapR is an R package for genetic linkage analysis and integrated genetic map construction from bi-parental populations of outcrossing autopolyploids. It can currently analyse triploid, tetraploid and hexaploid marker datasets and is applicable to various crops including potato, leek, alfalfa, blueberry, chrysanthemum, sweet potato or kiwifruit. It can detect, estimate and correct for preferential chromosome pairing, and has been tested on high-density marker datasets from potato, rose and chrysanthemum, generating high-density integrated linkage maps in all of these crops.

Availability and implementation: polymapR is freely available under the general public license from the Comprehensive R Archive Network (CRAN) at http://cran.r-project.org/package=polymapR.

Supplementary information: Supplementary data are available at Bioinformatics online.


Figures
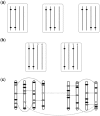
Fig. 1.
Fig. 1.
Phase considerations and clustering strategy in a tetraploid. (a) The three phases considered for a pair of 2 × 0 markers, from left to right, ‘coupling’, ‘mixed’ and ‘repulsion’; (b) In the case of preferential pairing between homologues 1–2 and 3–4, we must consider two separate types of coupling phase, either coupling within preferential bivalents (left) or coupling between preferential bivalents (right). In the extreme case of an allotetraploid, this distinction could also be termed ‘subgenome-specific’ versus ‘subgenome-straddling’; (c) Simplex × nulliplex (1 × 0) markers (solid black dots) uniquely define homologous chromosomes and are initially clustered together. Higher-dosage marker types such as duplex × nulliplex (2 × 0) markers (dark grey) provide linkage associations between simplex × nulliplex homologues, helping to identify chromosomal linkage groups. Cross-parental markers such as simplex × simplex (1 × 1, light grey) can also link these groups together, leading to consistent linkage group numbering across parents
Fig. 2.
Fig. 2.
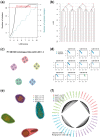
Example visualizations produced by polymapR to facilitate linkage group identification and marker clustering. (a) As LOD score is increased, the number of 1 × 0 clusters increases, as does the number of single-marker clusters (unlinked markers). For a given ploidy and chromosome base number, the expected number of (homologue) clusters is also shown; (b) Alternative representation of (a) which shows the splitting of each cluster as the LOD score is increased. In this example, five chromosomal clusters are identified at LOD 3.5, which split into four homologue clusters between LOD 4.5 and 7; (c) Using linkage to other marker segregation types such as 2 × 0 markers, homologue clusters can be associated into chromosomal clusters, if this was not achieved using 1 × 0 data alone. Here, five chromosomes are represented; (d) If homologues fragment, cross-homologue phase information can help determine which fragments to merge. Here, homologues 4 and 5 show only coupling-phase linkage and should therefore be joined as a single homologue; (e) Alternative approach to merge fragments showing network of linkages over a range of LOD scores. Here, four homologues were successfully identified and merged directly; (f) Alternative representation of (e), showing these connections in a circular format instead
Fig. 3.
Fig. 3.
Linkage map visualizations of polymapR. (a) Integrated chromosomal linkage maps generated using the sample tetraploid dataset provided with the package, with each marker segregation type highlighted; (b) Phased homologue-specific maps of a single chromosomal linkage group from a triploid dataset (simulated with PedigreeSim; Voorrips and Maliepaard, 2012). Maternal homologue maps (h1–h4) from the tetraploid parent are shown on the left, and paternal homologue maps (h5–h6) from the diploid parent are shown on the right, with the integrated chromosomal map in the middle

References

    1. Acquaah G. (2012). Principles of Plant Genetics and Breeding. Wiley-Blackwell; , West Sussex, UK.
    1. Bomblies K. et al. (2016) The challenge of evolving stable polyploidy: could an increase in “crossover interference distance” play a central role? Chromosoma, 125, 287–300. - PMC - PubMed
    1. Bourke P.M. et al. (2017) Partial preferential chromosome pairing is genotype dependent in tetraploid rose. Plant J., 90, 330–343. - PubMed
    1. Bourke P.M. et al. (2016) Integrating haplotype-specific linkage maps in tetraploid species using SNP markers. Theor. Appl. Genet., 129, 2211–2226. - PMC - PubMed
    1. Bourke P.M. et al. (2015) The double reduction landscape in tetraploid potato as revealed by a high-density linkage map. Genetics, 201, 853–863. - PMC - PubMed

Publication types