. 2018 May 3;16(5):e2003648.
doi: 10.1371/journal.pbio.2003648. eCollection 2018 May.

A direct link between MITF, innate immunity, and hair graying

Affiliations

A direct link between MITF, innate immunity, and hair graying

Melissa L Harris et al. PLoS Biol. .

Abstract

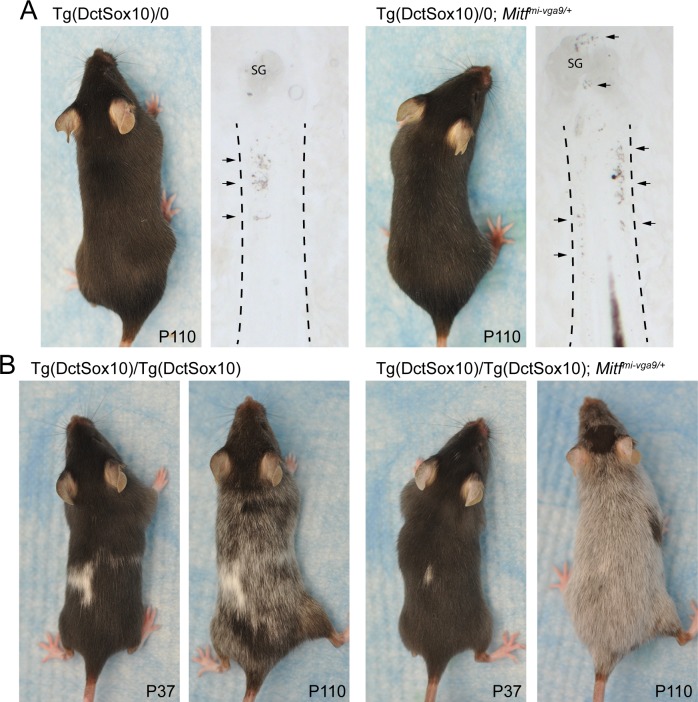
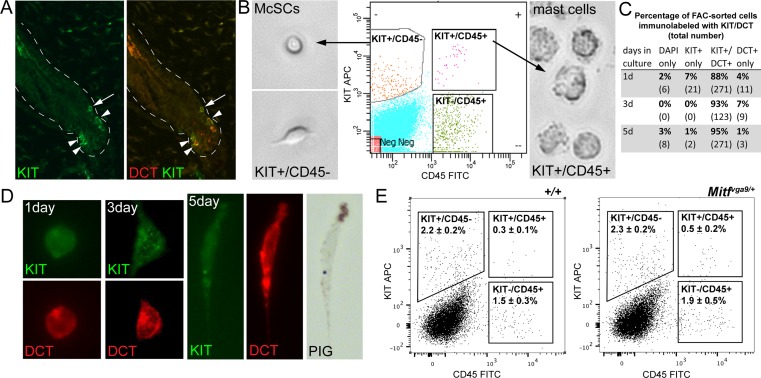
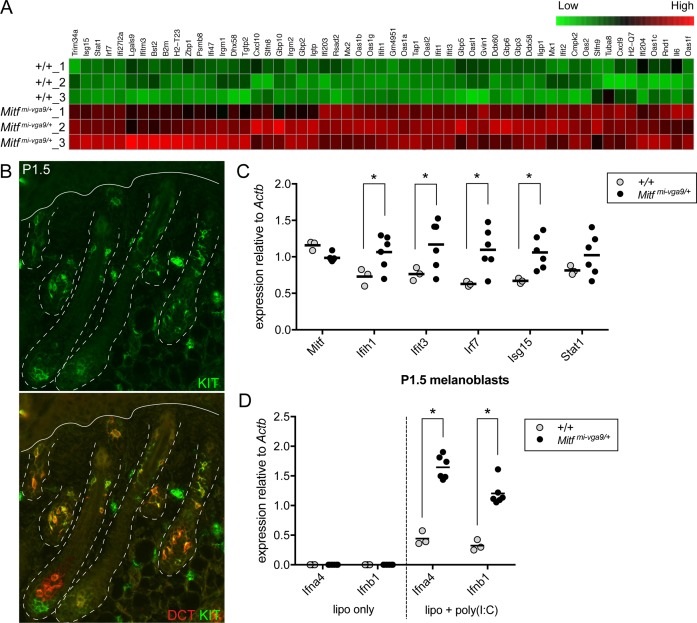
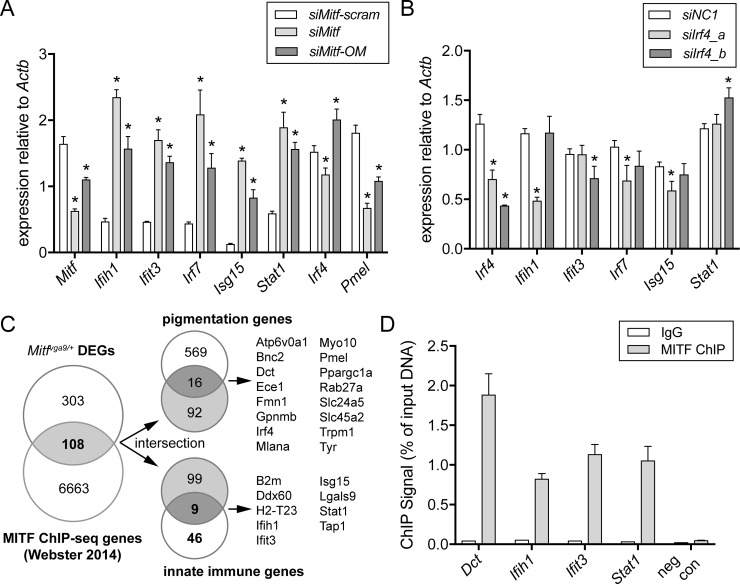
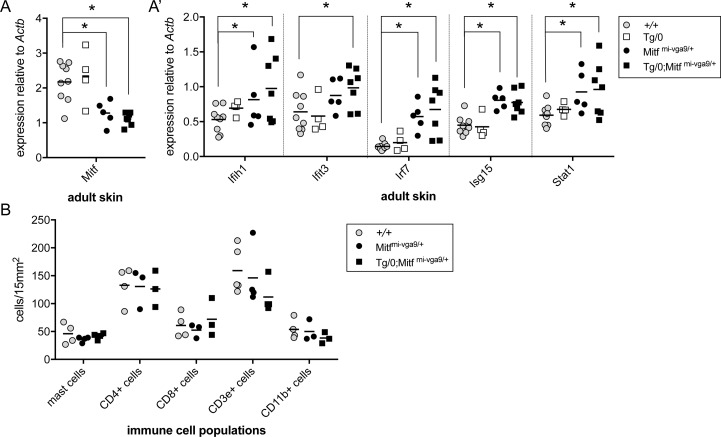
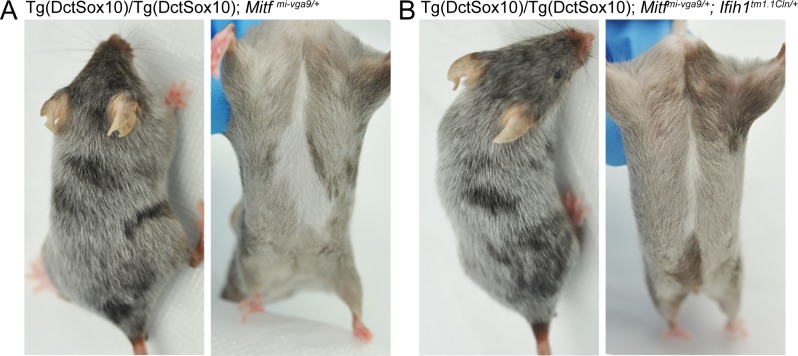
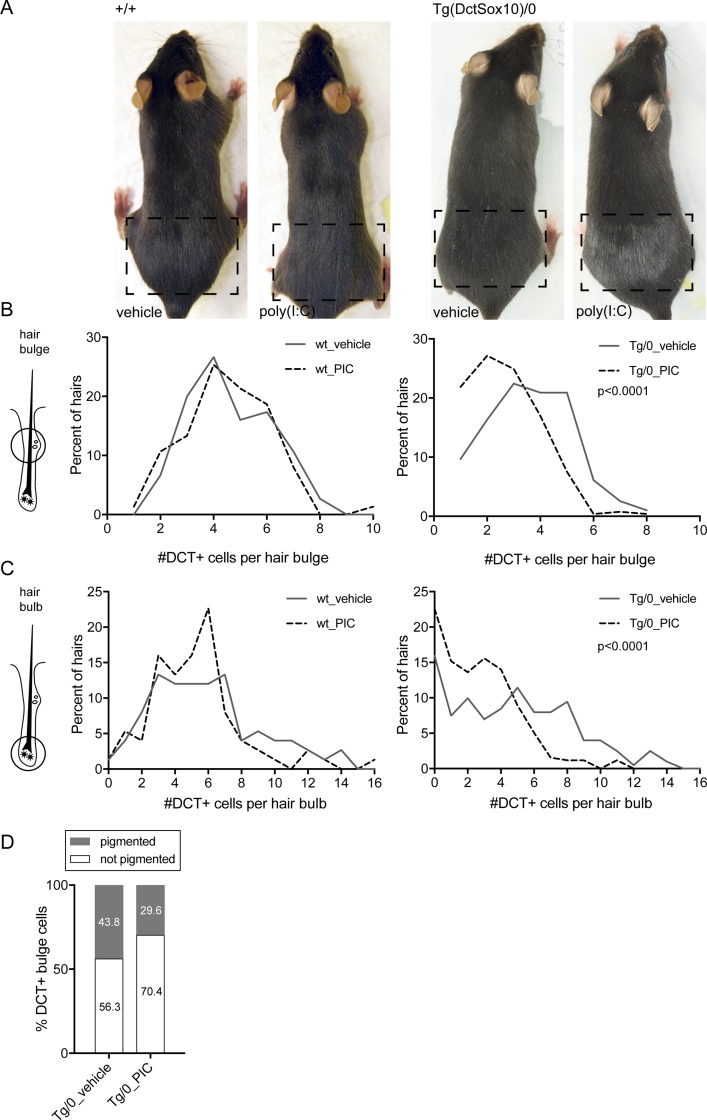
Melanocyte stem cells (McSCs) and mouse models of hair graying serve as useful systems to uncover mechanisms involved in stem cell self-renewal and the maintenance of regenerating tissues. Interested in assessing genetic variants that influence McSC maintenance, we found previously that heterozygosity for the melanogenesis associated transcription factor, Mitf, exacerbates McSC differentiation and hair graying in mice that are predisposed for this phenotype. Based on transcriptome and molecular analyses of Mitfmi-vga9/+ mice, we report a novel role for MITF in the regulation of systemic innate immune gene expression. We also demonstrate that the viral mimic poly(I:C) is sufficient to expose genetic susceptibility to hair graying. These observations point to a critical suppressor of innate immunity, the consequences of innate immune dysregulation on pigmentation, both of which may have implications in the autoimmune, depigmenting disease, vitiligo.


Conflict of interest statement

The authors have declared that no competing interests exist.

Figures

Fig 1
Fig 1. Increased hair graying and McSC differentiation occurs in Tg(Dct-Sox10) animals that are haploinsufficient for Mitfmi-vga9/+.
(A) Dorsal images of two female littermates taken at P110. At this age, the coat of Tg(Dct-Sox10)/0 mice appears solid black, while the coat of Tg(Dct-Sox10)/0; Mitfmi-vga9/+ mice exhibits a small number of gray hairs along its back. Bright-field images of histological sections of the skins from these mice reveal increased ectopic pigmentation (arrows) within the hair bulge (region between the dotted lines) of hairs from Tg(Dct-Sox10)/0; Mitfmi-vga9/+ animals in comparison to Tg(Dct-Sox10)/0 animals. (B) Dorsal images of two female littermates taken at P37 and P110. At P37, Tg(Dct-Sox10)/Tg(Dct-Sox10) mice exhibit a black coat with congenital white spotting on the belly and back. These mice experience progressive hair graying and by P110 exhibit a “salt and pepper” coat color in regions of the back fur that were originally black. In comparison to Tg(Dct-Sox10)/Tg(Dct-Sox10) mice, hair graying in Tg(Dct-Sox10)/Tg(Dct-Sox10); Mitfmi-vga9/+ mice at P110 is more severe, with a majority of the back fur exhibiting gray hairs. The images for this figure were generated in the original study presented in [17]. McSC, melanocyte stem cell; P, postnatal day; SG, sebaceous gland.
Fig 2
Fig 2. FACS isolation of adult McSCs.
(A) Immunolabeling for KIT protein in mouse skin at 8 weeks of age. At this time point, the majority of hairs exist in the telogen hair stage, and McSCs that are positive for both KIT (green) and DCT (red) are observed in the hair bulge (arrow) and secondary hair germ (arrowheads). The dotted white lines outline the hair follicles. (B) FACS of dermal cells from 8-week-old mice produces two KIT+ populations. McSCs are CD45− and mast cells are CD45+. The FACS gating strategy (center fluorescence plot) used to isolate McSCs successfully separates each of these cell types and is confirmed by visualizing their distinct morphologies; McSCs are small and often bipolar (left phase images), while mast cells are large and rough looking (right phase image). (C) KIT+/CD45− cells isolated by FACS were placed in culture and assessed for their expression of KIT and DCT by immunolabeling over a 5-day period. Total cells were identified by the nuclear marker DAPI. The table shows the percentage and total number (in parentheses) of cells exhibiting the indicated staining pattern. This FACS protocol produces a relatively pure McSC population, with >92% of cells being DCT+ 1 day after sorting. (D) FACS-isolated KIT+/CD45− McSCs remain positive for the melanocyte markers KIT (green) and DCT (red) and exhibit melanocyte-like traits while in tissue culture. These cells progress from being round at 1 day, to slightly spread at 3 days, to dendritic and pigmented over 5 days. (E) Evaluation of the indicated gates (boxes) on FACS fluorescence plots confirms that there is no significant difference by t test when comparing the percentage of each cell population between wild-type (left plot) and Mitfmi-vga9/+ (right plot) dermal cell suspensions (KIT+/CD45−, p = 0.85; KIT+/CD45+, p = 0.14; KIT−/CD45+, p = 0.28). Percentages are represented as the mean ± standard deviation, with n = 3 sorts per genotype. The raw data used to generate these graphs are available in S1 Data. APC, allophycocyanin; CD45, cluster of differentiation 45; DCT, dopachrome tautomerase; FACS, fluorescence-activated cell sorting; FITC, fluorescein; McSC, melanocyte stem cell; Mitf, melanogenesis associated transcription factor; Neg, negative; PIG, pigment.
Fig 3
Fig 3. Mitfmi-vga9/+ McSCs and melanoblasts exhibit an elevated type I interferon gene expression signature and Mitfmi-vga9/+ melanoblasts show increased sensitivity to viral mimic.
(A) Heatmap of scaled and clustered, rlog-transformed read count values obtained from RNA-seq analysis of Mitfmi-vga9/+ and wild-type McSCs. Fifty-five of the four hundred eleven genes that demonstrated a statistically significant, greater than 1.5-fold increase in expression in Mitfmi-vga9/+ McSCs over wild-type McSCs participate in innate immune signaling and are presented here (padjusted < 0.05, Benjamini-Hochberg adjusted p-value). (B) Immunolabeling for KIT protein in mouse skin at P1.5. At this time point, KIT+ (green), DCT+ (red) melanoblasts are observed migrating into the developing hair follicles. The dotted white lines outline the hair follicles and the solid line indicates the position of the epidermis. (C) qRT-PCR analysis of Mitf and ISG expression (Ifih1, Ifit3, Irf7, Isg15, and Stat1) in primary melanoblasts isolated from Mitfmi-vga9/+ and wild-type littermate pups at P1.5. Each circle indicates the expression of cells from an individual primary melanoblast cell line generated from an individual pup. The horizontal bars represent the mean, and the asterisks indicate gene expression changes with a q-value of <0.05 using the two-stage linear step-up procedure of Benjamini, Krieger, and Yekutieli, with Q = 5%. (D) qRT-PCR analysis of type I interferon gene expression (Ifna4 and Ifnb1) in primary melanoblast cell lines (isolated as described in [C]). Melanoblast cell lines were treated for 9 hours with lipofectamine only (lipo only) or lipofectamine and poly(I:C) (lipo + poly(I:C)). The horizontal bars represent the mean, and the asterisks indicate gene expression changes with a q-value of <0.05 using the two-stage linear step-up procedure of Benjamini, Krieger, and Yekutieli, with Q = 5%. The data presented here are representative of two independent experiments testing poly(I:C) treatment of primary melanoblast cell lines at two different cell passages. The raw data used to generate the graphs in (C) and (D) are available in S1 Data. DCT, dopachrome tautomerase; ISG, IFN-stimulated gene; lipo + poly(I:C), lipofectamine and poly(I:C); lipo only, lipofectamine only; Mitf, melanogenesis associated transcription factor; McSC, melanocyte stem cell; P, postnatal day; qRT-PCR, quantitative reverse transcriptase polymerase chain reaction; RNA-seq, RNA sequencing.
Fig 4
Fig 4. MITF binds to the promoter of innate immune target genes and acts as a transcriptional repressor.
(A, B) Relative gene expression in melan-a cells 48 hours after transfection with siRNA. In (A), cells were transfected with siRNAs targeting Mitf (siMitf and siMitf-OM) or an analogous scrambled control siRNA (siMitf-scram). In (B), cells were transfected with one of two siRNAs targeting Irf4 (siIrf4_a, siIrf4_b) or siNC1. The bars represent the mean ± standard deviation, and the asterisks indicate gene expression changes with a q-value of <0.05 using the two-stage linear step-up procedure of Benjamini, Krieger, and Yekutieli, with Q = 5%. Data presented in A and B are representative of two independent knockdown experiments performed in melan-a cells at two different cell passages. (C) Venn diagrams demonstrating the intersection of gene lists. The left diagram represents the genes exhibiting a 1.5-fold or greater difference in expression in Mitfmi-vga9/+ over wild-type McSCs (Mitfmi-vga9/+DEGs, top circle) overlapped with the list of genes associated with MITF ChIP-seq peaks reported by Webster et al. 2014 (MITF ChIP-seq genes, bottom circle) [41] and are considered potential direct targets of MITF. These 108 direct targets are provided in S4 Data. Direct target genes were further identified by comparing them with a list of known pigmentation genes in the upper right diagram and with the list of 55 innate immune-related genes up-regulated in Mitfmi-vga9/+ McSCs (as defined in Fig 3A) in the lower right diagram. (D) MITF ChIP-qPCR performed in melan-a cells and assayed for enrichment at the indicated gene loci (Dct, Ifih1, Ifit3, Stat1). A centromeric DNA sequence was amplified as a negative control (neg con). Error bars indicate mean ± standard deviation of two independent ChIP pulldowns. The raw data used to generate the graphs in (A), (B), and (D) are available in S1 Data. Actb, actin beta; ChIP, chromatin immunoprecipitation; ChIP-qPCR, chromatin immunoprecipitation quantitative polymerase chain reaction; ChIP-seq, chromatin immunoprecipitation sequencing; DEG, differentially expressed gene; IgG, immunoglobulin G; McSC, melanocyte stem cell; MITF, melanogenesis associated transcription factor; neg con, negative control; siNC1, nontargeting control siRNA; siRNA, small interfering RNA.
Fig 5
Fig 5. Mitfmi-vga9/+ and Tg(Dct-Sox10)/0; Mitfmi-vga9/+ animals exhibit elevated ISG expression but no change in the density of immune populations within the skin.
(A, A′) qRT-PCR analysis of Mitf and ISG expression in skin isolated from adult wild-type, Tg(Dct-Sox10)/0, Mitfmi-vga9/+, and Tg(Dct-Sox10)/0; Mitfmi-vga9/+ littermates. Each point on the graph represents the expression value from skin of an individual animal. The horizontal bars represent the mean, and the asterisks indicate gene expression changes with a q-value of <0.05 using the two-stage linear step-up procedure of Benjamini, Krieger, and Yekutieli, with Q = 5%. (B) Number of immune-related cells per a 15 mm2 area of skin from the same animals as described in (A) harvested at mid-anagen. Mast cells were detected using toluidine blue staining, and other immune cells were detected by immunofluorescence for the indicated markers. Representative images of histological sections used for cell counts are provided in S2 Fig. Each point on the graph represents cell counts from an individual animal, and the horizontal bar represents the mean. t tests confirmed no statistically significant differences in the density of immune cells when comparing wild-type animals to Mitfmi-vga9/+ or Tg(Dct-Sox10)/0; Mitfmi-vga9/+ animals. The raw data used to generate the graphs in (A), (A′), and (B) are available in S1 Data. Actb, actin beta; CD, cluster of differentiation; ISG, IFN-stimulated gene; Mitf, melanogenesis associated transcription factor; qRT-PCR, quantitative reverse transcription polymerase chain reaction.
Fig 6
Fig 6. Ifih1tm1.1Cln/+ does not affect hair graying in Tg(Dct-Sox10)/Tg(Dct-Sox10); Mitfmi-vga9/+ mice.
(A, B) Images of Tg(Dct-Sox10)/Tg(Dct-Sox10); Mitfmi-vga9/+ and Tg(Dct-Sox10)/Tg(Dct-Sox10); Mitfmi-vga9/+; Ifih tm1.1Cln/+ littermates imaged at postnatal day 95. (A) Tg(Dct-Sox10)/Tg(Dct-Sox10); Mitfmi-vga9/+ animals exhibit a white belly spot at birth and premature hair graying as they age. (B) Tg(Dct-Sox10)/Tg(Dct-Sox10); Mitfmi-vga9/+; Ifih tm1.1Cln/+ animals also exhibit hair graying and a belly spot that is slightly reduced in size. Images shown here are representative of five biological replicates for each genotype, with additional images provided in S3 Fig. Ifih1; interferon induced with helicase C domain 1; Mitf, melanogenesis associated transcription factor.
Fig 7
Fig 7. Treatment with the viral mimic poly(I:C) worsens hair graying in Tg(Dct-Sox10)/0 susceptible mice.
(A) Wild-type (left) and Tg(Dct-Sox10)/0 (right) mice were plucked along their lower back (the plucked region is indicated by the dashed boxes) to synchronize and initiate the hair cycle in this area. Starting on the fourth day after plucking, mice received an intraperitoneal injection on three consecutive days of 100 μL of physiological water alone (vehicle) or physiological water containing 100 μg of poly(I:C). Hair regrowth was allowed to proceed normally and the mice were imaged within the same hair cycle, approximately 21 days after the initial plucking. Images shown here are representative of 3–5 animals for each genotype and treatment. (B, C) Histograms of the percent of hairs exhibiting DCT+ McSCs in the hair bulge (B) or DCT+ melanocytes in the hair bulb (C) of mice treated similarly to those described in (A). For this experiment, skins were harvested on the seventh day after plucking, sectioned, and immunolabeled for DCT. For the wild-type mice, each histogram represents 75 hairs evaluated across 3 animals for each anatomic location. For the Tg(Dct-Sox10)/0 mice, each histogram represents >190 hairs evaluated across 6 animals for each anatomic location. Histogram distributions were assessed for significance using the Kolmogorov-Smirnov test. (D) Quantification of pigmented and not pigmented DCT+ McSCs within the hair bulge of mice treated and prepared similarly to those described in (B). For the Tg(Dct-Sox10)/0 mice injected with the vehicle control, 256 McSCs were assessed across 3 animals. For the Tg(Dct-Sox10)/0 mice injected with poly(I:C), 260 McSCs were assessed across 5 animals. The difference in the proportion of pigmented and not pigmented DCT+ McSCs between treatments was tested for significance using the Fisher’s exact test (p = 0.001). The raw data used to generate the graphs in (B), (C), and (D) are available in S1 Data. DCT, dopachrome tautomerase; McSC, melanocyte stem cell; poly(I:C); polyinosinic:polycytidylic acid.

References

    1. Jaenisch R. Retroviruses and embryogenesis: Microinjection of Moloney leukemia virus into midgestation mouse embryos. Cell. 1980;19: 181–188. doi: 10.1016/0092-8674(80)90399-2 - DOI - PubMed
    1. Jaenisch R, Jähner D, Nobis P, Simon I, Löhler J, Harbers K, et al. Chromosomal position and activation of retroviral genomes inserted into the germ line of mice. Cell. 1981;24: 519–529. doi: 10.1016/0092-8674(81)90343-3 - DOI - PubMed
    1. Morse HC III, Yetter RA, Stimpfling JH, Pitts OM, Fredrickson TN, Hartley JW. Greying with age in mice: relation to expression of murine leukemia viruses. Cell. 1985;41: 439–448. doi: 10.1016/S0092-8674(85)80017-9 - DOI - PubMed
    1. Aubin-Houzelstein G, Djian-Zaouche J, Bernex F, Gadin S, Delmas V, Larue L, et al. Melanoblasts’ Proper Location and Timed Differentiation Depend on Notch/RBP-J Signaling in Postnatal Hair Follicles. J Invest Dermatol. 2008;128: 2686–2695. doi: 10.1038/jid.2008.120 - DOI - PubMed
    1. Botchkareva NV, Khlgatian M, Longley BJ, Botchkarev VA, Gilchrest BA. SCF/c-kit signaling is required for cyclic regeneration of the hair pigmentation unit. FASEB J. 2001;15: 645–658. doi: 10.1096/fj.00-0368com - DOI - PubMed

Publication types