

Heat/mortality sensitivities in Los Angeles during winter: a unique phenomenon in the United States
- PMID: 29724242
- PMCID: PMC5934864
- DOI: 10.1186/s12940-018-0389-7
Heat/mortality sensitivities in Los Angeles during winter: a unique phenomenon in the United States
Abstract
Background: Extreme heat is often associated with elevated levels of human mortality, particularly across the mid-latitudes. Los Angeles, CA exhibits a unique, highly variable winter climate, with brief periods of intense heat caused by downsloping winds commonly known as Santa Ana winds. The goal is to determine if Los Angeles County is susceptible to heat-related mortality during the winter season. This is the first study to specifically evaluate heat-related mortality during the winter for a U.S. city.
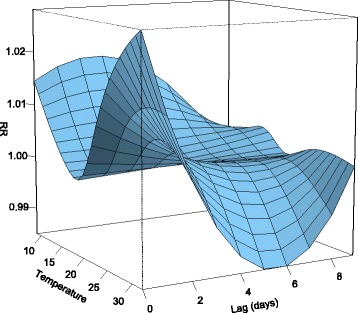
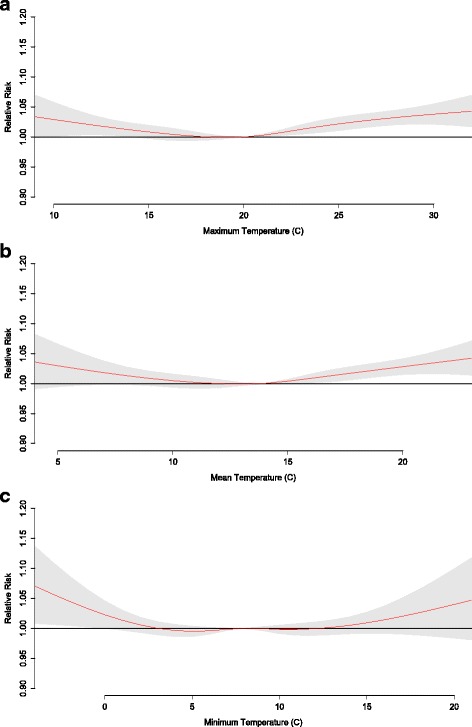
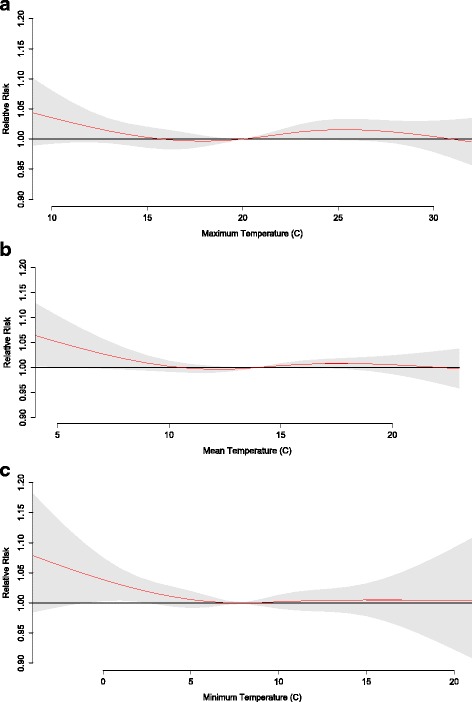
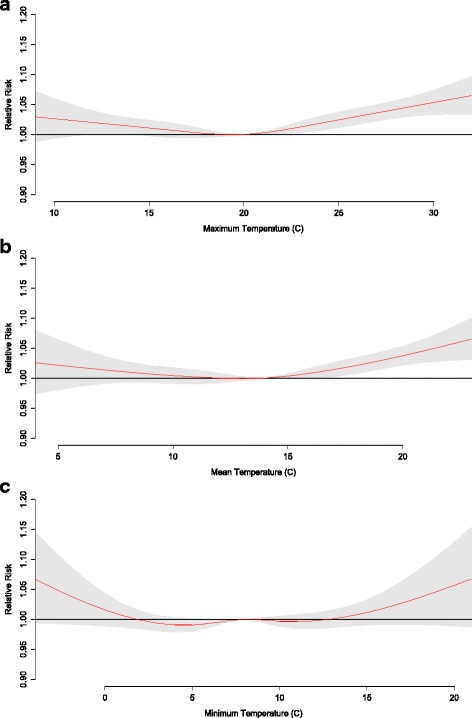
Methods: Utilizing the Spatial Synoptic Classification system in Los Angeles County from 1979 through 2010, we first relate daily human mortality to synoptic air mass type during the winter season (December, January, February) using Welch's t-tests. However, this methodology is only somewhat effective at controlling for important inter- and intra-annual trends in human mortality unrelated to heat such as influenza outbreaks. As a result, we use distributed lag nonlinear modeling (DLNM) to evaluate if the relative risk of human mortality increases during higher temperatures in Los Angeles, as the DLNM is more effective at controlling for variability at multiple temporal scales within the human mortality dataset.
Results: Significantly higher human mortality is uncovered in winter when dry tropical air is present in Los Angeles, particularly among those 65 years and older (p < 0.001). The DLNM reveals the relative risk of human mortality increases when above average temperatures are present. Results are especially pronounced for maximum and mean temperatures, along with total mortality and those 65 + .
Conclusions: The discovery of heat-related mortality in winter is a unique finding in the United States, and we recommend stakeholders consider warning and intervention techniques to mitigate the role of winter heat on human health in the County.
Keywords: Air masses; DLNM; Heat; Human mortality; Los Angeles; Winter heat waves.
Conflict of interest statement
Ethics approval and consent to participate
Not applicable.
Competing interests
The authors declare that they have no competing interests.
Publisher’s Note
Springer Nature remains neutral with regard to jurisdictional claims in published maps and institutional affiliations.
Figures


References
-
- Greene JS, Kalkstein LS, Mills DM, Samenow J. An examination of climate change on extreme heat events and climate-mortality relationships in large U.S. cities. Weather Clim Soc. 2011;3:281–292. doi: 10.1175/WCAS-D-11-00055.1. - DOI
Publication types
MeSH terms
LinkOut - more resources
Full Text Sources
Other Literature Sources
Research Materials
