Review
. 2018 Jun 25:75:1-12.
doi: 10.1016/j.jbiomech.2018.04.017. Epub 2018 Apr 18.

Ankle and foot power in gait analysis: Implications for science, technology and clinical assessment

Affiliations
Review

Ankle and foot power in gait analysis: Implications for science, technology and clinical assessment

Karl E Zelik et al. J Biomech. .

Abstract

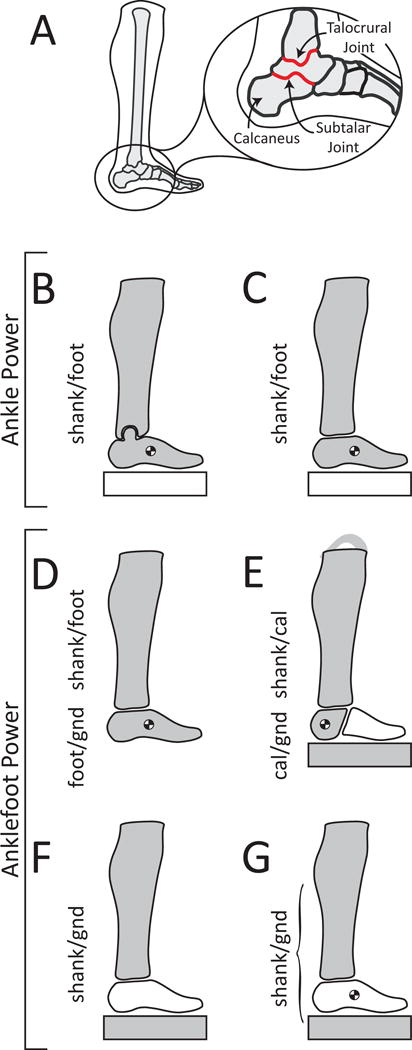
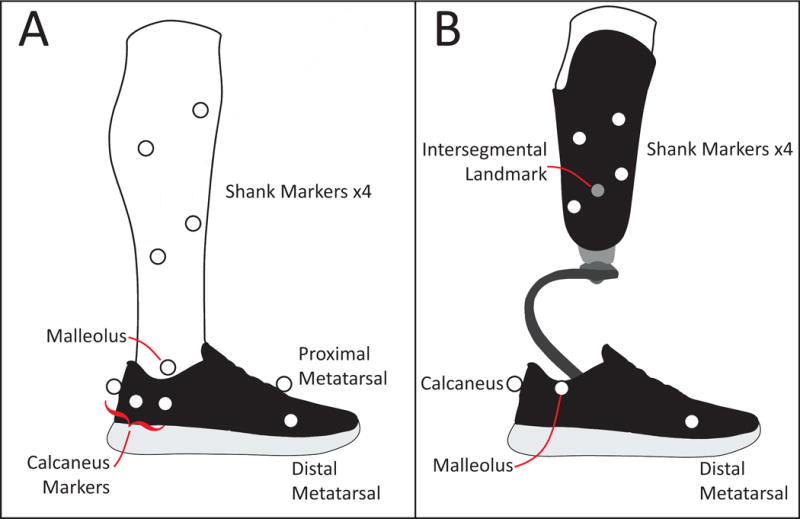
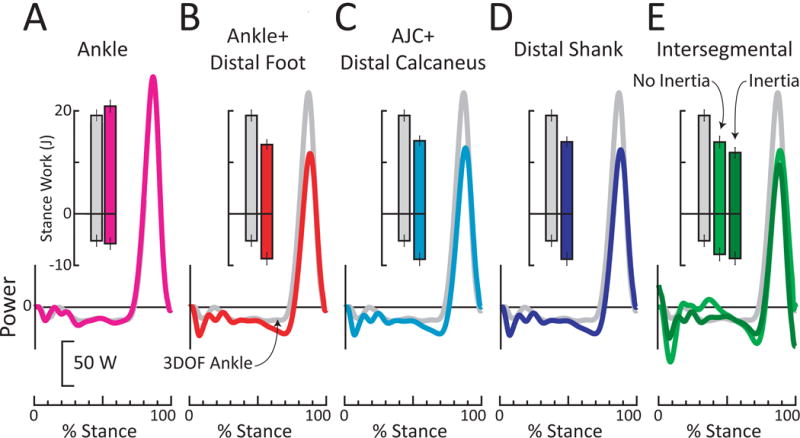
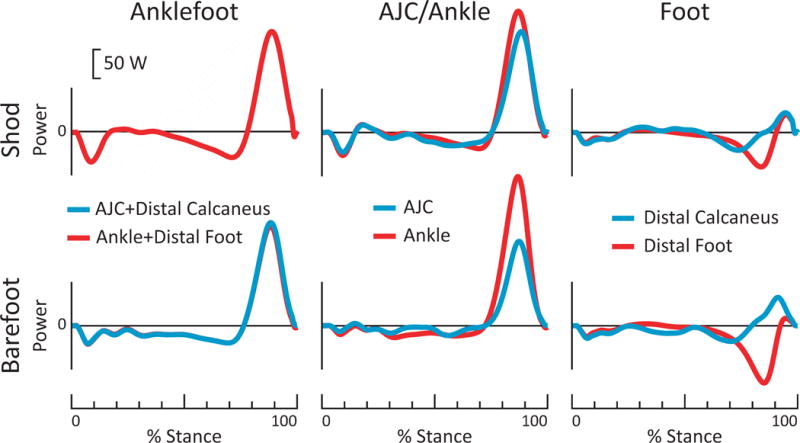
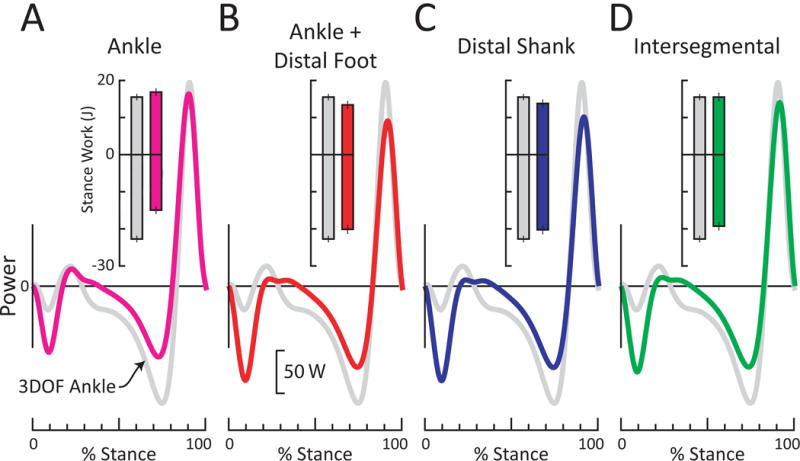
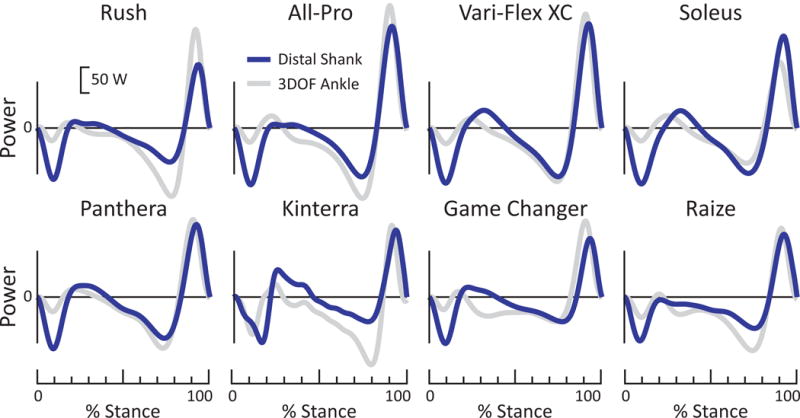
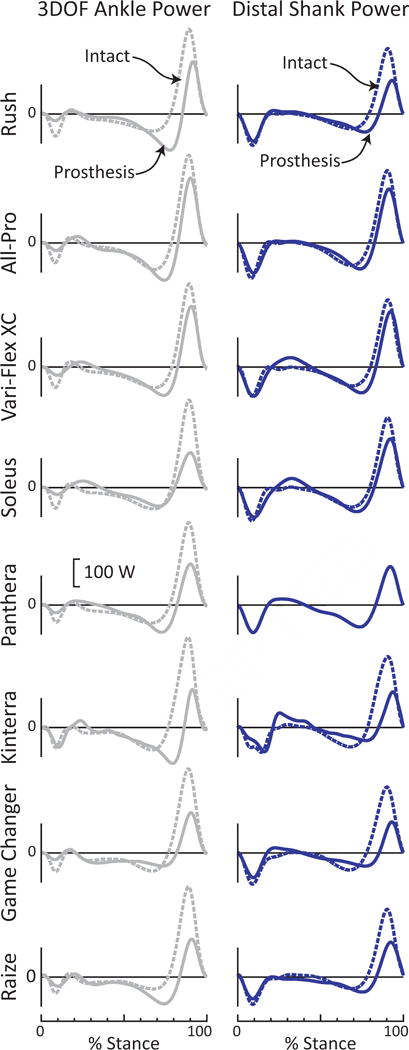
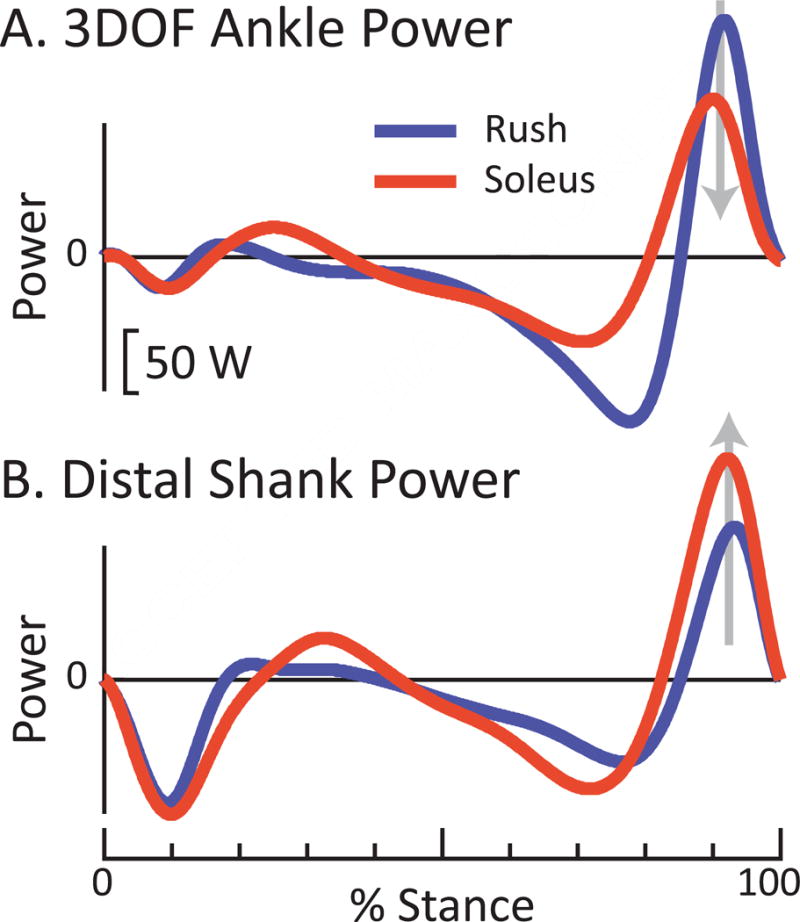
In human gait analysis studies, the entire foot is typically modeled as a single rigid-body segment; however, this neglects power generated/absorbed within the foot. Here we show how treating the entire foot as a rigid body can lead to misunderstandings related to (biological and prosthetic) foot function, and distort our understanding of ankle and muscle-tendon dynamics. We overview various (unconventional) inverse dynamics methods for estimating foot power, partitioning ankle vs. foot contributions, and computing combined anklefoot power. We present two case study examples. The first exemplifies how modeling the foot as a single rigid-body segment causes us to overestimate (and overvalue) muscle-tendon power generated about the biological ankle (in this study by up to 77%), and to misestimate (and misinform on) foot contributions; corroborating findings from previous multi-segment foot modeling studies. The second case study involved an individual with transtibial amputation walking on 8 different prosthetic feet. The results exemplify how assuming a rigid foot can skew comparisons between biological and prosthetic limbs, and lead to incorrect conclusions when comparing different prostheses/interventions. Based on analytical derivations, empirical findings and prior literature we recommend against computing conventional ankle power (between shank-foot). Instead, we recommend using an alternative estimate of power generated about the ankle joint complex (between shank-calcaneus) in conjunction with an estimate of foot power (between calcaneus-ground); or using a combined anklefoot power calculation. We conclude that treating the entire foot as a rigid-body segment is often inappropriate and ill-advised. Including foot power in biomechanical gait analysis is necessary to enhance scientific conclusions, clinical evaluations and technology development.

Keywords: Ankle joint; Inverse dynamics; Mechanical power; Multi-segment foot; Prosthetic feet.


Figures

Figure 1
Figure 1. Methods to compute ankle and anklefoot power
(A) Biological ankle joint complex (AJC), comprised of the talocrural and subtalar anatomical joints. (B) 3DOF Ankle: rotational power between the shank and foot. All other power estimates are 6DOF (capturing rotational and translational power). (C) Ankle: rotational and translational power between the shank and foot. Methods (B) and (C) only estimate ankle dynamics, assuming a single rigid-body foot segment, but do not estimate power due to the motion of the foot relative to the ground (gnd). (D) Ankle + Distal Foot: anklefoot power computed by summing power of shank relative to foot plus power of foot relative to the ground. This method also assumes a single rigid-body foot segment. (E) AJC + Distal Calcaneus: anklefoot power computed by summing power of the shank relative to the calcaneus (cal) plus power of the calcaneus relative to the ground. This method does not treat the entire foot as a single rigid-body segment; rather it only assumes a portion of the foot, the calcaneus, is rigid. (F) Distal Shank: anklefoot power due to motion of the shank relative to the ground. This estimate assumes negligible foot mass and inertia. (G) Intersegmental: power flow in/out of a given landmark; in this case, the distal end of the shank. This estimate can be formulated to include (or not include) effects due to foot mass and inertia. Gray signifies segments (and the ground in anklefoot cases) used to compute power. Brackets indicate power calculated between two grey segments. White indicates that power was not explicitly computed relative to a given segment or the ground. The center-of-mass symbol on a segment signifies that the mass and moment of inertia of this segment were used in the calculation of power. See Supplementary Material (Appendix A) for detailed explanations and equations for each method.
Figure 2
Figure 2. Motion capture marker sets
Lateral view shown for case study 1 (A) and case study 2 (B). (A) This marker set was used to track the shank, calcaneus and foot. Shown here is the shod case. The marker set for the barefoot case was identical. Shank motion was determined from the four shank markers. Ankle joint center was approximately midway between the medial malleolus (not shown, behind foot) and lateral malleolus markers. The calcaneus motion was determined from five markers: one on the posterior of the shoe/foot, one on the sustsentaculum tali (ST, on medial side of the foot), one on the peroneal trochlea (PT, the most anterior of the calcaneus markers shown), one between the posterior calcaneus and the ST (on medial side of the foot), and one between the posterior calcaneus and the PT. Foot segment motion was determined by four markers: one posterior on the calcaneus, two on the distal heads of 1st and 5th metatarsals (one shown) and one on the proximal head of the 1st metatarsal. (B) Prosthesis side marker set used to track the shank and the foot. Four markers on the socket were used to track the motion of the shank. The Intersegmental landmark (virtual marker, gray) was defined to be midway between the two most distal shank markers. The ankle joint center was defined as midway between the medial and lateral malleolus markers (lateral one shown). On the intact limb these markers were placed on the malleoli and on the affected limb, these markers were placed on the shoe. Foot motion was estimated by the motion of three markers: one posterior on the calcaneus and two on the approximate location of distal heads of 1st and 5th metatarsals (one shown). The intact foot mirrored this marker placement.
Figure 3
Figure 3. Ankle and anklefoot power and work for barefoot walking of able-bodied individual at 1.25 m/s
Each Ankle or anklefoot power is plotted over the stance phase of gait, relative to conventional 3DOF Ankle power (gray curve, representing power due to rotation of the shank relative to the foot). Inset bars represent positive and negative work over stance phase of gait. Standard deviation bars represent inter-step variability. (A) 6DOF (rotational + translational) Ankle power (pink) was similar to 3DOF (rotational) Ankle positive power (grey). (B-E) Peak 3DOF Ankle power was ~40% (~70 W) higher than peak anklefoot power estimates, and positive 3DOF Ankle work was ~40% (~6 J) higher than anklefoot positive work estimates. (B) Ankle + Distal Foot power (red). (C) AJC + Distal Calcaneus power (cyan). (D) Distal Shank power (blue). (E) Intersegmental power (green), assuming zero foot mass and inertia. When foot mass and inertia were included into the calculation of Intersegmental power (dark green), then peak power was decreased by 16 W and positive work decreased by 2 J over stance phase, relative to Intersegmental power calculation that neglected foot mass and inertia.
Figure 4
Figure 4. Power calculations relative to foot vs. relative to calcaneus, for able-bodied individual during shod (top row) and barefoot (bottom row) walking at 1.25 m/s
Both methods yielded very similar anklefoot power. However, large differences were observed in the partitioning Ankle/AJC vs. foot power sources. Peak Ankle (shank-foot) power was 20% (35 W) higher than peak AJC (shank-calcaneus) power during shod walking, and 77% higher (112 W) during barefoot walking. Positive Ankle work was 21% (3 J) and 79% (9 J) higher than positive AJC work during shod and barefoot walking, respectively. The magnitude of Distal Foot negative work was 53% (3 J) and 77% (5 J) more than the magnitude of Distal Calcaneus work during shod and barefoot walking, respectively. The magnitude of Distal Foot positive work was 45% (1 J) and 81% (3 J) less than the magnitude of Distal Calcaneus work during shod and barefoot walking, respectively.
Figure 5
Figure 5. Ankle and anklefoot power for an example prosthesis (All Pro) during walking at 1.25 m/s
Each ankle or anklefoot power is plotted over the stance phase of gait, relative to conventional 3DOF Ankle power (gray curve, representing power due to rotation of the shank relative to the foot). Inset bars represent positive and negative work over stance phase of gait. Standard deviation bars represent inter-step variability. (A) 6DOF Ankle power (pink). When comparing 6DOF vs. 3DOF Ankle estimates, this particular prosthesis exhibited less negative work, slightly more positive work and similar peak power. (B) Ankle + Distal Foot power (red). (C) Distal Shank power (blue). (D) Intersegmental power (green), assuming zero foot mass and inertia. These different anklefoot estimates yielded power curves similar to each other. However, compared to 3DOF Ankle power, the anklefoot powers exhibited more negative power after foot contact (0-20% of stance), less negative power in mid-stance (40-85% stance), and slightly less positive power at the end of stance.
Figure 6
Figure 6. Anklefoot (Distal Shank) power vs. 3DOF Ankle power for all 8 prostheses during walking at 1.25 m/s
For all prostheses, the anklefoot power exhibited more negative power after foot contact (0-20% stance), relative to 3DOF Ankle power. For most prostheses, anklefoot power exhibited less negative power in mid-stance (~40-85% stance). Peak anklefoot power was notably less than 3DOF Ankle power for 4 of 8 prostheses (Rush, All Pro, Vari-Flex XC and Game Changer), roughly equivalent for 3 of 8 prostheses (Panthera, Kinterra and Raize), and greater for one prosthesis (Soleus).
Figure 7
Figure 7. Ankle and anklefoot power for intact (dashed) vs. prosthetic (solid) limb, while an individual walked on 8 different prostheses at 1.25 m/s
3DOF Ankle power estimates (left column) showed greater asymmetry between intact vs. prosthetic limb power generation, as compared to anklefoot power (Distal Shank, right column).
Figure 8
Figure 8. Example of how choice of method can mislead conclusions when comparing two prosthetic feet
(A) Conventional 3DOF Ankle power indicates that peak Push-off power from the Soleus foot (red) was decreased relative to the Rush foot (blue); however, (B) the more complete Anklefoot power estimate indicates the opposite, that peak Push-off power with the Soleus was increased relative to the Rush foot. Power curves are for walking at 1.25 m/s, for one individual with transtibial amputation.
Figure 9
Figure 9. Example of how choice of method can mislead conclusions when comparing shod vs. barefoot walking
(A) Ankle power indicates that Push-off decreased while shod (red) relative to barefoot (blue); however, (B) AJC power indicates the opposite, that Push-off increased while shod. Power curves are for walking at 1.25 m/s, for one able-bodied person.

References

    1. Adamczyk PG, Roland M, Hahn ME. Sensitivity of biomechanical outcomes to independent variations of hindfoot and forefoot stiffness in foot prostheses. Hum Mov Sci. 2017;54:154–171. https://doi.org/10.1016/j.humov.2017.04.005. - DOI - PMC - PubMed
    1. Antonsson EK, Mann RW. The frequency content of gait. J Biomech. 1985;18:39–47. - PubMed
    1. Arch ES, Fylstra BL. Combined Ankle–Foot Energetics are Conserved When Distal Foot Energy Absorption is Minimized. J Appl Biomech. 2016;32:571–577. https://doi.org/10.1123/jab.2016-0108. - DOI - PubMed
    1. Baker RW. Measuring Walking: A Handbook of Clinical Gait Analysis. Wiley; 2013.
    1. Bogey RA, Perry J, Gitter AJ. An EMG-to-force processing approach for determining ankle muscle forces during normal human gait. IEEE Trans Neural Syst Rehabil Eng. 2005;13:302–310. https://doi.org/10.1109/TNSRE.2005.851768. - DOI - PubMed

Publication types