

Dynamic balance during walking adaptability tasks in individuals post-stroke
- PMID: 29724539
- PMCID: PMC6114086
- DOI: 10.1016/j.jbiomech.2018.04.029
Dynamic balance during walking adaptability tasks in individuals post-stroke
Abstract
Maintaining dynamic balance during community ambulation is a major challenge post-stroke. Community ambulation requires performance of steady-state level walking as well as tasks that require walking adaptability. Prior studies on balance control post-stroke have mainly focused on steady-state walking, but walking adaptability tasks have received little attention. The purpose of this study was to quantify and compare dynamic balance requirements during common walking adaptability tasks post-stroke and in healthy adults and identify differences in underlying mechanisms used for maintaining dynamic balance. Kinematic data were collected from fifteen individuals with post-stroke hemiparesis during steady-state forward and backward walking, obstacle negotiation, and step-up tasks. In addition, data from ten healthy adults provided the basis for comparison. Dynamic balance was quantified using the peak-to-peak range of whole-body angular-momentum in each anatomical plane during the paretic, nonparetic and healthy control single-leg-stance phase of the gait cycle. To understand differences in some of the key underlying mechanisms for maintaining dynamic balance, foot placement and plantarflexor muscle activation were examined. Individuals post-stroke had significant dynamic balance deficits in the frontal plane across most tasks, particularly during the paretic single-leg-stance. Frontal plane balance deficits were associated with wider paretic foot placement, elevated body center-of-mass, and lower soleus activity. Further, the obstacle negotiation task imposed a higher balance requirement, particularly during the trailing leg single-stance. Thus, improving paretic foot placement and ankle plantarflexor activity, particularly during obstacle negotiation, may be important rehabilitation targets to enhance dynamic balance during post-stroke community ambulation.
Keywords: Angular momentum; Biomechanics; Community ambulation; Gait; Obstacle; Stability.
Copyright © 2018 Elsevier Ltd. All rights reserved.
Conflict of interest statement
There are no conflicts of interest.
Figures
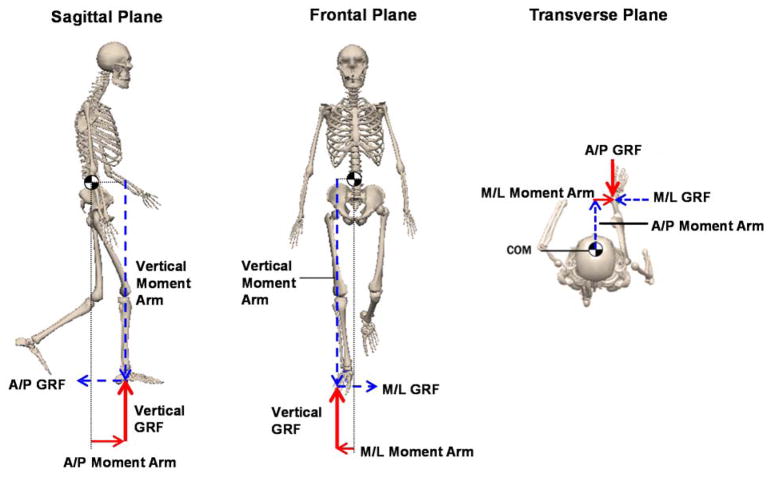
 ’. The ground-reaction-force (GRF) vectors and their corresponding moment arms appear in the same color. During single-leg-stance, only the stance leg contributes to the net external moment about the body CoM. In each plane, the net external moment consists of two moment arm and GRF components. For instance, in the frontal plane, only the vertical and mediolateral moment arms and GRFs contribute to the net external moment and the regulation of whole-body angular-momentum. Here, we focus on analyzing the moment arms to further understand the regulation of whole-body angular-momentum.
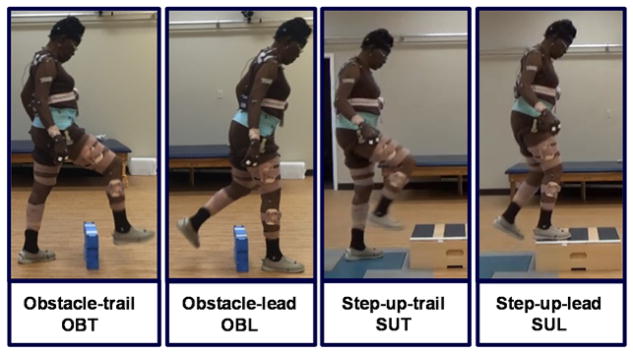
 ) and healthy controls (
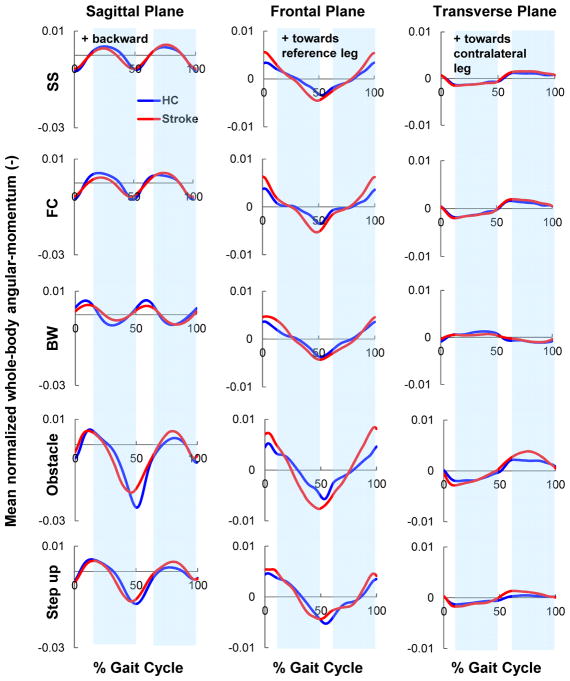
 ). The post-stroke data is shown in the paretic leg reference frame (i.e., 0% gait cycle represents paretic leg heel strike). For brevity, only the obstacle and step-up trials leading with the nonparetic leg are shown. Shaded regions represent the healthy control single-leg-stance (SLS) phase of the gait cycle (exact values shown in Fig. 6). Positive directions of angular-momentum are (sagittal: backward; frontal: towards the reference leg; transverse: from the reference leg to the contralateral leg).
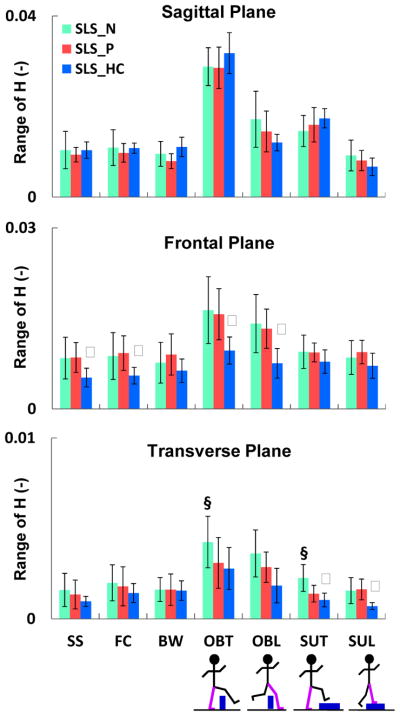
 ), paretic leg (
), and average of both legs in healthy controls (
), paretic leg (
), and average of both legs in healthy controls (
 ). Tasks included self-selected (SS), fastest-comfortable (FC) and backward (BW) walking, obstacle negotiation during trailing (OBT) and leading (OBL) leg support, and step-up during trailing (SUT) and leading (SUL) leg support. Significant differences (P < α/2, α < 0.05) are shown between the paretic- and nonparetic-SLS (§) as well as paretic- and healthy control-SLS (ψ). The largest group differences in HR are in the frontal plane. Note the smaller scale in the transverse plane.
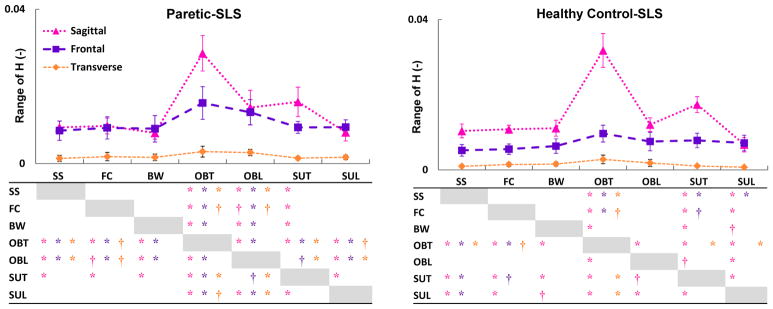
 ), frontal (
 ) and transverse (
 ) planes during the paretic and healthy control single-leg-stance (SLS). Significant differences across the tasks are shown in the tables with ‘*’ (for P < α/6, α < 0.01) and ‘†’ (for P < α/6, 0.01<α < 0.05). The colors of the significance symbols correspond to the anatomical planes. In the sagittal plane, in both groups HR during the trailing phase of the obstacle (OBT) and step-up (SUT) tasks was higher than other tasks (task demand). In the frontal plane, only in adults post-stroke HR during the obstacle negotiation (OBT and OBL) was higher than other tasks (difference in regulation).
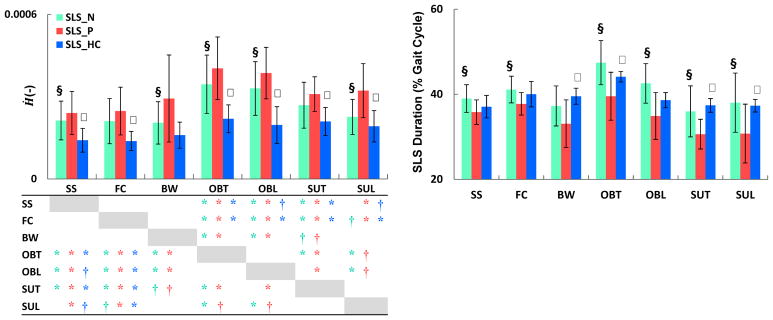 ), paretic (
), and healthy control (
) SLS. Significant differences (P < α/2, α < 0.05) are shown between the paretic- and nonparetic-SLS (§) as well as the paretic- and healthy control-SLS (ψ). Significant differences in Ḣ across tasks are shown in the table with ‘*’ (for P < α/6, α < 0.01) and ‘†’ (for P < α/6, 0.01<α < 0.05). The colors of the significance symbols correspond to the limbs. During the paretic-SLS, Ḣ was higher than the nonparetic- and healthy control-SLS, while paretic-SLS duration was lower than the non-paretic and healthy control-SLS. Adults post-stroke regulated H differently across tasks than healthy controls.
), paretic (
), and healthy control (
) SLS. Significant differences (P < α/2, α < 0.05) are shown between the paretic- and nonparetic-SLS (§) as well as the paretic- and healthy control-SLS (ψ). Significant differences in Ḣ across tasks are shown in the table with ‘*’ (for P < α/6, α < 0.01) and ‘†’ (for P < α/6, 0.01<α < 0.05). The colors of the significance symbols correspond to the limbs. During the paretic-SLS, Ḣ was higher than the nonparetic- and healthy control-SLS, while paretic-SLS duration was lower than the non-paretic and healthy control-SLS. Adults post-stroke regulated H differently across tasks than healthy controls.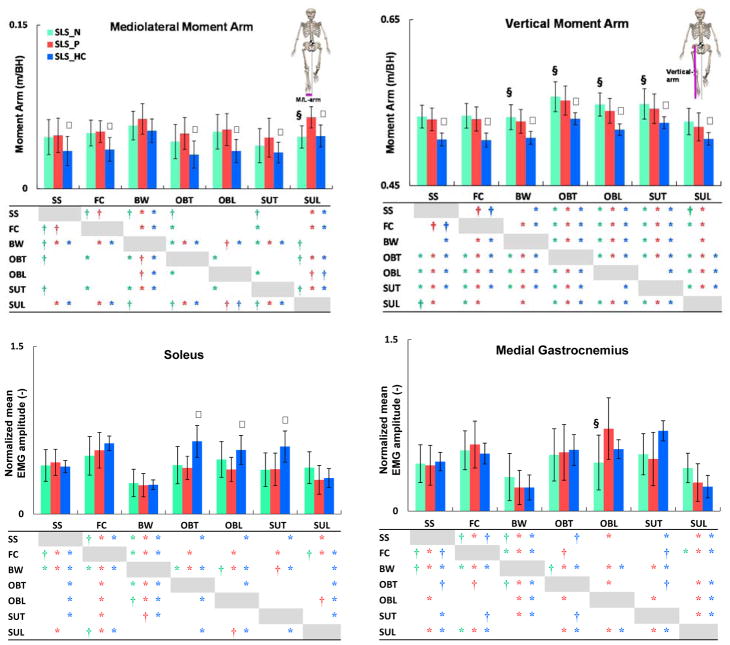 ), paretic (
), and healthy control (
) single-leg-stance (SLS). Significant differences (P < α/2, α < 0.05) are shown between the paretic- and nonparetic-SLS (§) as well as the paretic- and healthy control-SLS (ψ). Significant differences across tasks are shown in the tables with ‘*’ (for P < α/6, α < 0.01) and ‘†’ (for P < α/6, 0.01<α < 0.05). The colors of the significance symbols correspond to the limbs. Although the direction (increase or decrease) of changes in the moment arms between tasks were similar in both groups, adults post-stroke had significantly larger moment arms than healthy controls. Soleus activation during the obstacle and step-up tasks was significantly higher in healthy controls than post-stroke.
), paretic (
), and healthy control (
) single-leg-stance (SLS). Significant differences (P < α/2, α < 0.05) are shown between the paretic- and nonparetic-SLS (§) as well as the paretic- and healthy control-SLS (ψ). Significant differences across tasks are shown in the tables with ‘*’ (for P < α/6, α < 0.01) and ‘†’ (for P < α/6, 0.01<α < 0.05). The colors of the significance symbols correspond to the limbs. Although the direction (increase or decrease) of changes in the moment arms between tasks were similar in both groups, adults post-stroke had significantly larger moment arms than healthy controls. Soleus activation during the obstacle and step-up tasks was significantly higher in healthy controls than post-stroke.Similar articles
-
The influence of locomotor training on dynamic balance during steady-state walking post-stroke.J Biomech. 2019 May 24;89:21-27. doi: 10.1016/j.jbiomech.2019.04.002. Epub 2019 Apr 6. J Biomech. 2019. PMID: 30981426 Free PMC article.
-
Articulated ankle-foot-orthosis improves inter-limb propulsion symmetry during walking adaptability task post-stroke.Clin Biomech (Bristol). 2024 Jun;116:106268. doi: 10.1016/j.clinbiomech.2024.106268. Epub 2024 May 18. Clin Biomech (Bristol). 2024. PMID: 38795609
-
Relationships between frontal-plane angular momentum and clinical balance measures during post-stroke hemiparetic walking.Gait Posture. 2014 Jan;39(1):129-34. doi: 10.1016/j.gaitpost.2013.06.008. Epub 2013 Jun 30. Gait Posture. 2014. PMID: 23820449 Free PMC article.
-
Paretic propulsion as a measure of walking performance and functional motor recovery post-stroke: A review.Gait Posture. 2019 Feb;68:6-14. doi: 10.1016/j.gaitpost.2018.10.027. Epub 2018 Oct 25. Gait Posture. 2019. PMID: 30408710 Free PMC article. Review.
-
Control of human gait stability through foot placement.J R Soc Interface. 2018 Jun;15(143):20170816. doi: 10.1098/rsif.2017.0816. J R Soc Interface. 2018. PMID: 29875279 Free PMC article. Review.
Cited by
-
Segmental contribution to whole-body angular momentum during stepping in healthy young and old adults.Sci Rep. 2021 Oct 7;11(1):19969. doi: 10.1038/s41598-021-99519-y. Sci Rep. 2021. PMID: 34620974 Free PMC article.
-
Gait Improvement in Chronic Stroke Survivors by Using an Innovative Gait Training Machine: A Randomized Controlled Trial.Int J Environ Res Public Health. 2021 Dec 25;19(1):224. doi: 10.3390/ijerph19010224. Int J Environ Res Public Health. 2021. PMID: 35010482 Free PMC article. Clinical Trial.
-
Dynamic Balance during Human Movement: Measurement and Control Mechanisms.J Biomech Eng. 2018 Dec 5;141(7):0708011-07080110. doi: 10.1115/1.4042170. Online ahead of print. J Biomech Eng. 2018. PMID: 30516241 Free PMC article.
-
Temporal Evolution of Frontal Plane Center-of-Mass Transfer Asymmetry in Post-Stroke Gait.IEEE Trans Neural Syst Rehabil Eng. 2025;33:1427-1438. doi: 10.1109/TNSRE.2025.3559857. Epub 2025 Apr 18. IEEE Trans Neural Syst Rehabil Eng. 2025. PMID: 40208766 Free PMC article.
-
The influence of locomotor training on dynamic balance during steady-state walking post-stroke.J Biomech. 2019 May 24;89:21-27. doi: 10.1016/j.jbiomech.2019.04.002. Epub 2019 Apr 6. J Biomech. 2019. PMID: 30981426 Free PMC article.
References
-
- Balasubramanian CK. The community balance and mobility scale alleviates the ceiling effects observed in the currently used gait and balance assessments for the community-dwelling older adults. J Geriatr Phys Ther. 2015;38:78–89. - PubMed
-
- Bensoussan L, Viton JM, Barotsis N, Delarque A. Evaluation of patients with gait abnormalities in physical and rehabilitation medicine settings. J Rehabil Med. 2008;40:497–507. - PubMed
-
- Blum L, Korner-Bitensky N. Usefulness of the Berg Balance Scale in stroke rehabilitation: a systematic review. Phys Ther. 2008;88:559–566. - PubMed
Publication types
MeSH terms
Grants and funding
LinkOut - more resources
Full Text Sources
Other Literature Sources
Medical
