. 2018 Jul;67(7):1297-1309.
doi: 10.2337/db17-1509. Epub 2018 May 3.

Mice Carrying a Dominant-Negative Human PI3K Mutation Are Protected From Obesity and Hepatic Steatosis but Not Diabetes

Affiliations

Mice Carrying a Dominant-Negative Human PI3K Mutation Are Protected From Obesity and Hepatic Steatosis but Not Diabetes

Marie H Solheim et al. Diabetes. 2018 Jul.

Abstract

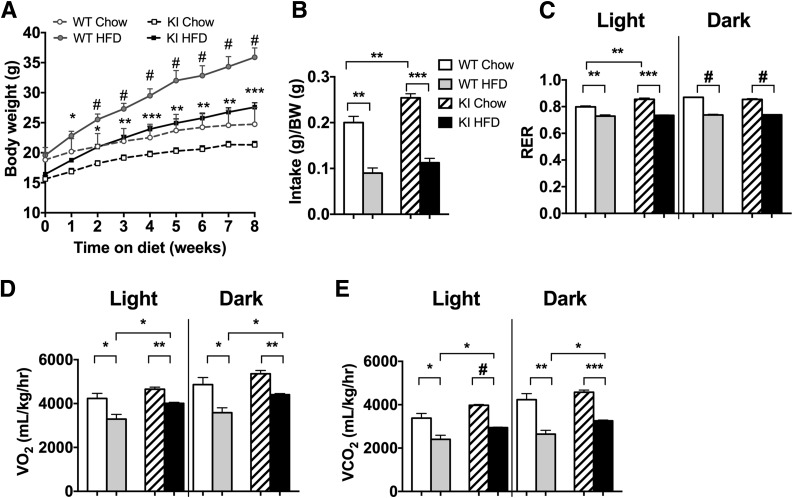
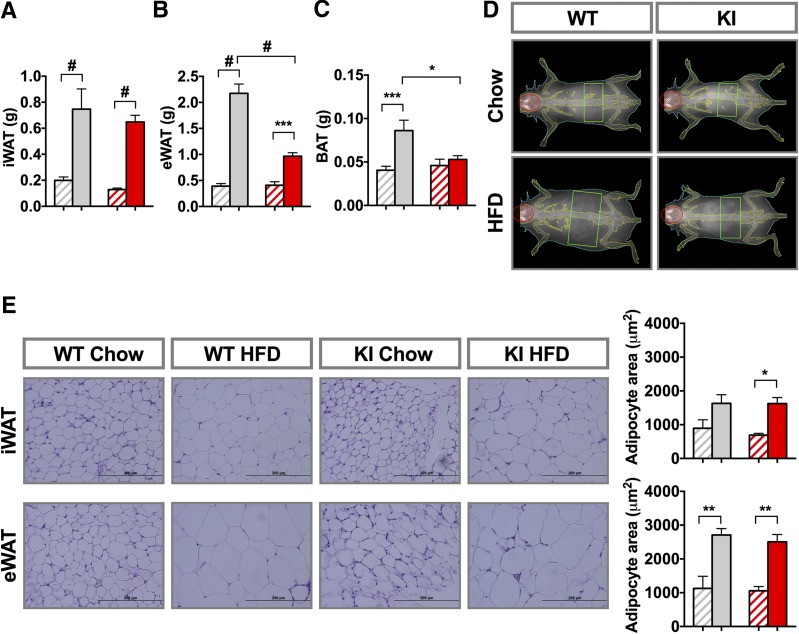
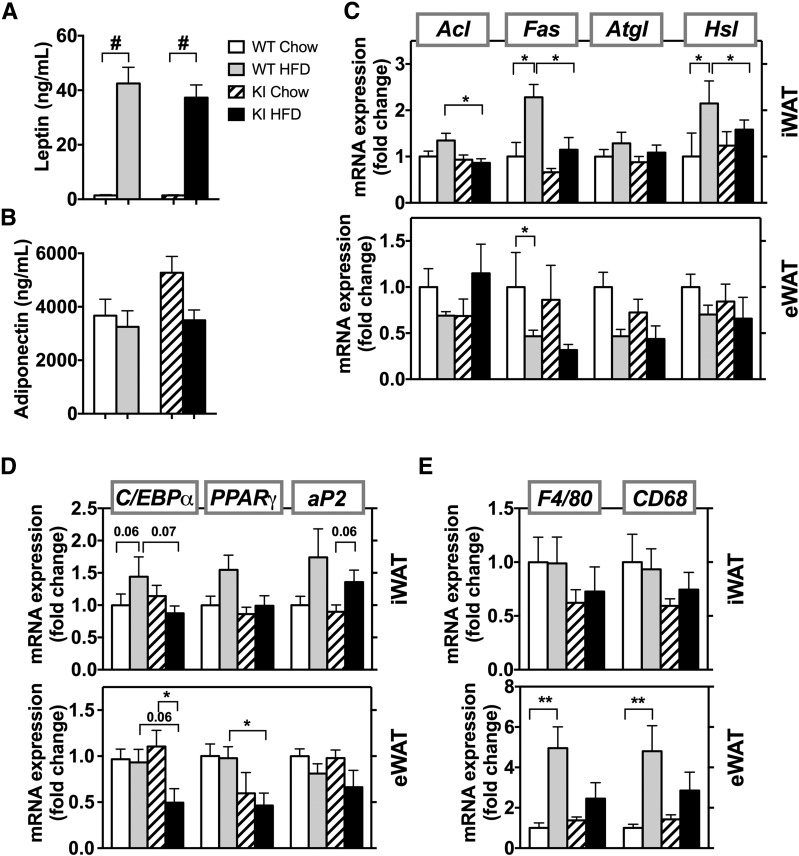
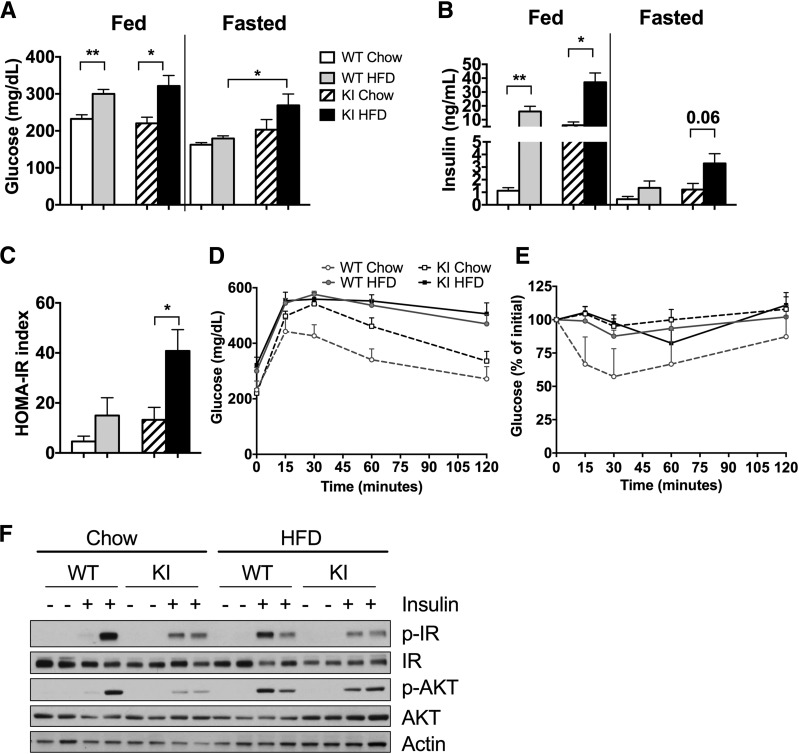
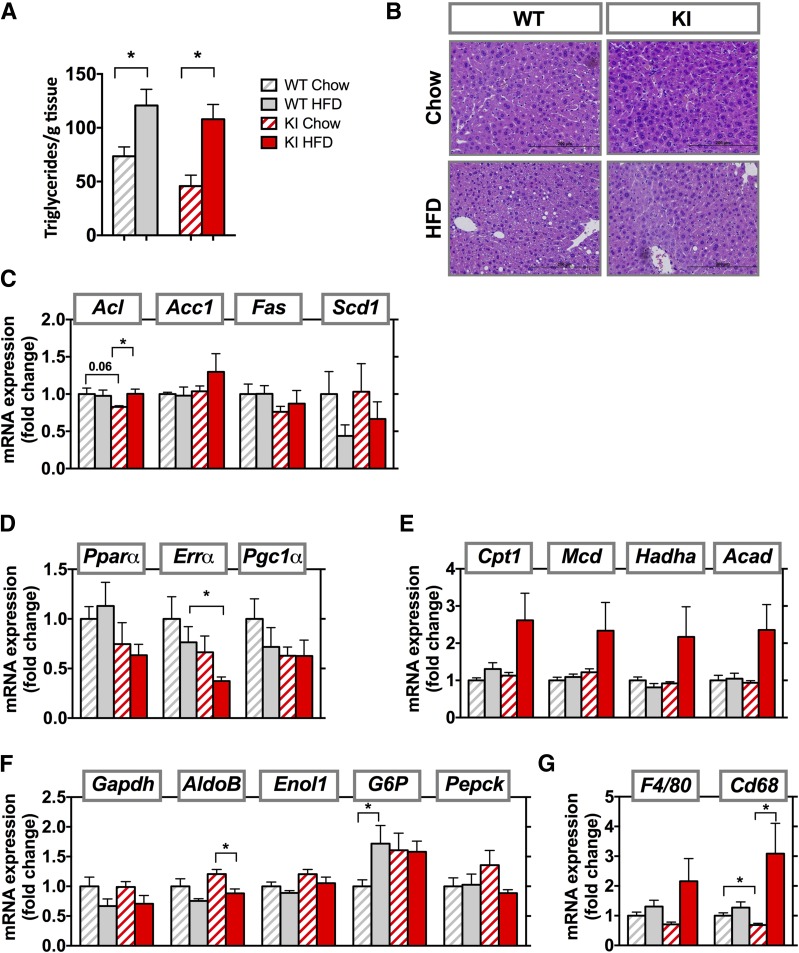
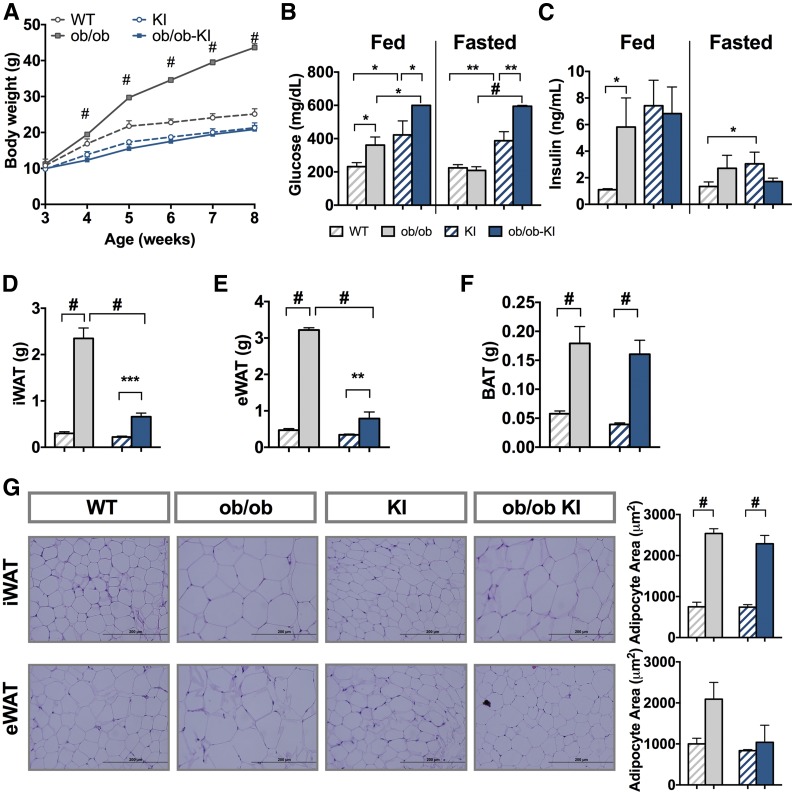
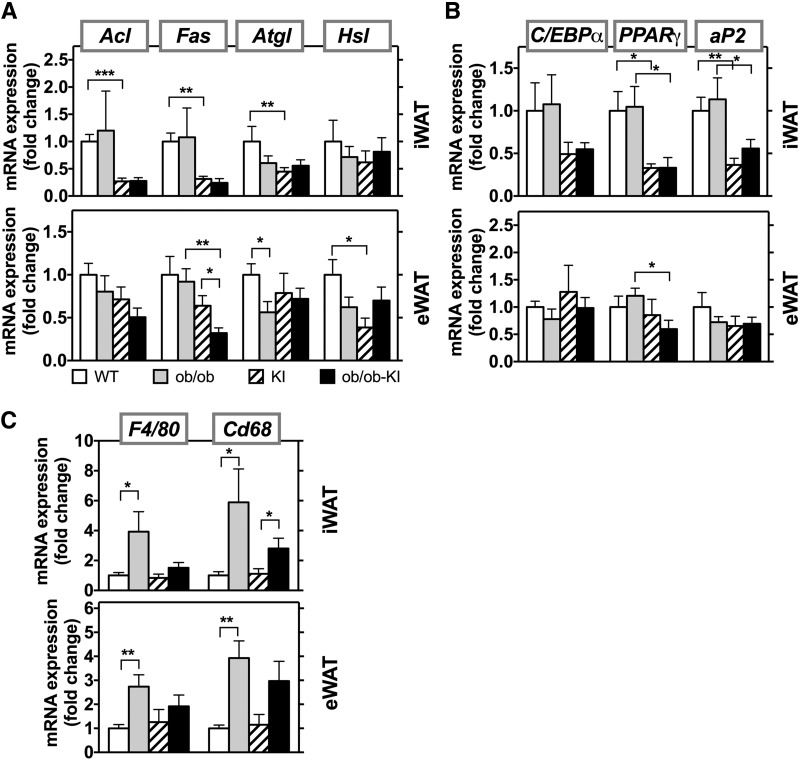
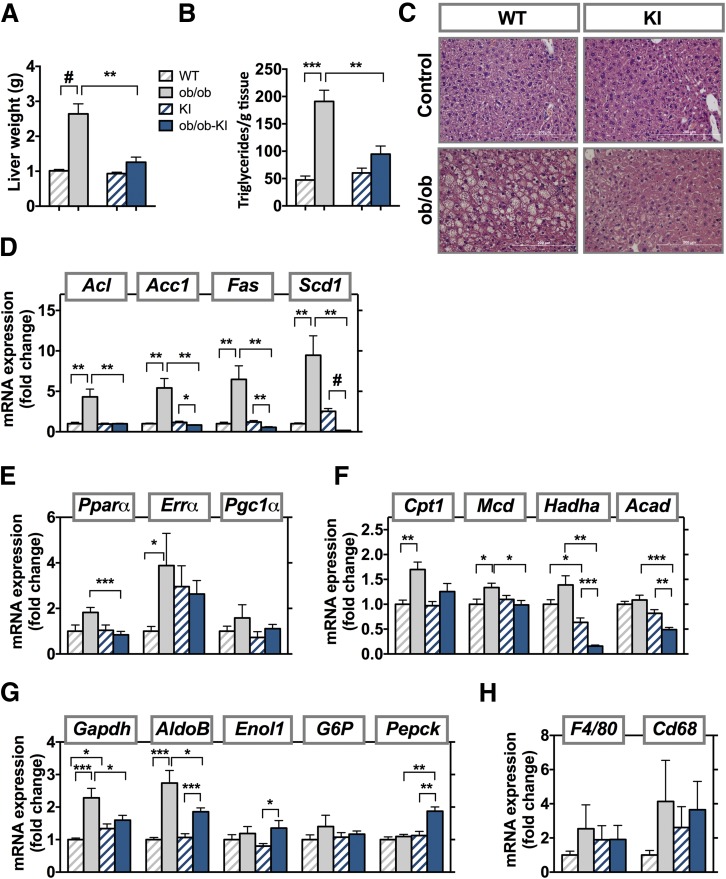
Phosphatidylinositol 3-kinase (PI3K) plays a central role in insulin signaling, glucose metabolism, cell growth, cell development, and apoptosis. A heterozygous missense mutation (R649W) in the p85α regulatory subunit gene of PI3K (PIK3R1) has been identified in patients with SHORT (Short stature, Hyperextensibility/Hernia, Ocular depression, Rieger anomaly, and Teething delay) syndrome, a disorder characterized by postnatal growth retardation, insulin resistance, and partial lipodystrophy. Knock-in mice with the same heterozygous mutation mirror the human phenotype. In this study, we show that Pik3r1 R649W knock-in mice fed a high-fat diet (HFD) have reduced weight gain and adipose accumulation. This is accompanied by reduced expression of several genes involved in lipid metabolism. Interestingly, despite the lower level of adiposity, the HFD knock-in mice are more hyperglycemic and more insulin-resistant than HFD-fed control mice. Likewise, when crossed with genetically obese ob/ob mice, the ob/ob mice carrying the heterozygous R649W mutation were protected from obesity and hepatic steatosis but developed a severe diabetic state. Together, our data demonstrate a central role of PI3K in development of obesity and fatty liver disease, separating these effects from the role of PI3K in insulin resistance and the resultant hyperglycemia.


Figures

Figure 1
Figure 1
Pik3r1 R649W mice are resistant to HFD-induced obesity. A: Body weight of WT and Pik3r1 R649W KI mice measured over 8 weeks of CD or HFD, shown as mean ± SEM of 12–14 animals per group. *P < 0.05, **P < 0.01, ***P < 0.001, #P < 0.0005, one-way ANOVA. Data from CLAMS of mice in week 8 of diet shows daily food intake normalized to body weight (BW) (B), and respiratory exchange ratio (RER) (C), VO2 (D), and VCO2 (E) in light and dark cycle, shown as the average of two 24-h cycles. **P < 0.01, ***P < 0.001, #P < 0.0005, t tests.
Figure 2
Figure 2
Pik3r1 R649W mice have reduced adipose tissue mass gain by HFD. Weight of iWAT (A), eWAT (B), and BAT (C) after 8 weeks on the CD or HFD. D: Representative DEXA images after the end of the 8-week diet period. E: Hematoxylin and eosin staining of formalin-fixed sections from representative inguinal and epididymal tissue and average adipocyte area (n = 4). Results are shown as mean ± SEM. *P < 0.05, **P < 0.01, ***P < 0.001, #P < 0.0005, one-way ANOVA. Gray diagonal bars: WT chow mice; gray bars: WT HFD mice; red diagonal bars: KI chow mice; red bars: KI HFD mice.
Figure 3
Figure 3
mRNA levels of regulators of lipid metabolism are unaffected by the HFD in Pik3r1 R649W mice. Serum levels of leptin (A) and adiponectin (B) in WT and KI animals fed the CD or HFD (n = 4–8 animals per group). Results are shown as mean ± SEM. #P < 0.0005, one-way ANOVA. mRNA levels of genes involved in lipid metabolism (C), adipocyte development (D), and inflammation (E) in the inguinal fat pad (top panels) and epididymal fat pad (bottom panels) after 8 weeks of the CD or HFD. mRNA results are mean ± SEM (n = 5–6 animals per group). *P < 0.05, **P < 0.01 by t tests, compared with controls.
Figure 4
Figure 4
HFD exacerbates insulin resistance and glucose metabolism in diabetic Pik3r1 R649W mice. Blood glucose (A) and serum insulin (B) levels after 8 weeks of diet in the fed state and after a 16-h fast. HOMA-insulin resistance (IR) index calculated from fasting insulin and glucose levels (C), and glucose tolerance (D) and insulin tolerance (E) tests after 8 weeks on the CD or HFD. Results shown as mean ± SEM. *P < 0.05, **P < 0.01, compared with controls, t tests (n = 6–8 animals per group). F: Immunoblot analysis of insulin signaling capacity (antibodies against p-IR, IR, p-Akt, Akt, and actin) in liver tissue after 10 min of insulin (5 units) or vehicle administration.
Figure 5
Figure 5
Increased β-oxidation and inflammation in HFD-fed Pik3r1 R649W mice. A: Liver triglycerides measured after 8 weeks of CD or HFD. B: Representative images from liver sections stained with hematoxylin and eosin. Results are shown as mean ± SEM. *P < 0.05, one-way ANOVA. mRNA expression of genes involved in de novo lipogenesis (C), fatty acid oxidation (D), β-oxidation (E), gluconeogenesis (F), and inflammation (G) in livers from WT and KI animals after 8 weeks of the CD or HFD. mRNA results are mean ± SEM of 5–6 animals per group. *P < 0.05 compared with controls, t tests.
Figure 6
Figure 6
Pik3r1 R649W mice show resistance to genetically induced obesity but worsened the diabetic phenotype. A: Body weight of WT and Pik3r1 R649W KI mice measured over 6 weeks in control mice (circles) and ob/ob mutation (squares). Results shown as mean ± SEM (n = 4–12 mice per group). #P < 0.0005, one-way ANOVA. Blood glucose (B) and serum insulin (C) levels in the fed state and after 3 h of fasting at 8 weeks of age. Results are shown as mean ± SEM of 4–12 mice per group. *P < 0.05, **P < 0.01, ***P < 0.001 #P < 0.0005, t tests. iWAT (D), eWAT (E), and BAT (F) weight at 8 weeks of age (mean ± SEM of 4–12 animals per group). **P < 0.01, ***P < 0.001, #P < 0.0005 compared with controls, one-way ANOVA. G: Formalin-fixed WAT sections from representative inguinal and epididymal depots and average adipocyte area (n = 4). Results are shown as mean ± SEM. #P < 0.0005, one-way ANOVA.
Figure 7
Figure 7
Presence of Pik3r1 R649W mutation in ob/ob mice does not change mRNA expression of regulators of lipid metabolism. mRNA expression of genes involved in lipid metabolism (A), adipocyte development (B), and inflammation (C) in the subcutaneous (top panel) and epididymal (bottom panel) fat in ob/ob and ob/ob-KI mice at 8 weeks of age. mRNA results are mean ± SEM of 4–6 animals per group. *P < 0.05, **P < 0.01, ***P < 0.001 compared with controls, t tests.
Figure 8
Figure 8
Reduced lipid accumulation in livers of ob/ob Pik3r1 R649W mice. Liver weight (A) and liver triglycerides (B) measured at 8 weeks of age in ob/ob and ob/ob-KI mice. Results are shown as mean ± SEM. **P < 0.01, ***P < 0.001, #P < 0.0005, one-way ANOVA. C: Liver sections stained with hematoxylin and eosin. Scale bars, 200 μm. mRNA expression of genes involved in de novo lipogenesis (D), fatty acid oxidation (E), β-oxidation (F), gluconeogenesis (G), and inflammation (H) in liver at 8 weeks of age. mRNA results are mean ± SEM of four to six animals per group. *P < 0.05, **P < 0.01, ***P < 0.001, #P < 0.0005 compared with controls, t tests.

References

    1. Engelman JA, Luo J, Cantley LC. The evolution of phosphatidylinositol 3-kinases as regulators of growth and metabolism. Nat Rev Genet 2006;7:606–619 - PubMed
    1. Yu W, Chen Z, Zhang J, et al. . Critical role of phosphoinositide 3-kinase cascade in adipogenesis of human mesenchymal stem cells. Mol Cell Biochem 2008;310:11–18 - PubMed
    1. Tomiyama K, Nakata H, Sasa H, Arimura S, Nishio E, Watanabe Y. Wortmannin, a specific phosphatidylinositol 3-kinase inhibitor, inhibits adipocytic differentiation of 3T3-L1 cells. Biochem Biophys Res Commun 1995;212:263–269 - PubMed
    1. Sakaue H, Ogawa W, Matsumoto M, et al. . Posttranscriptional control of adipocyte differentiation through activation of phosphoinositide 3-kinase. J Biol Chem 1998;273:28945–28952 - PubMed
    1. Garcia-Cao I, Song MS, Hobbs RM, et al. . Systemic elevation of PTEN induces a tumor-suppressive metabolic state. Cell 2012;149:49–62 - PMC - PubMed

Publication types

MeSH terms

Supplementary concepts