

The Helicobacter pylori adhesin protein HopQ exploits the dimer interface of human CEACAMs to facilitate translocation of the oncoprotein CagA
- PMID: 29724755
- PMCID: PMC6028028
- DOI: 10.15252/embj.201798664
The Helicobacter pylori adhesin protein HopQ exploits the dimer interface of human CEACAMs to facilitate translocation of the oncoprotein CagA
Abstract
Helicobacter pylori infects half of the world's population, and strains that encode the cag type IV secretion system for injection of the oncoprotein CagA into host gastric epithelial cells are associated with elevated levels of cancer. CagA translocation into host cells is dependent on interactions between the H. pylori adhesin protein HopQ and human CEACAMs. Here, we present high-resolution structures of several HopQ-CEACAM complexes and CEACAMs in their monomeric and dimeric forms establishing that HopQ uses a coupled folding and binding mechanism to engage the canonical CEACAM dimerization interface for CEACAM recognition. By combining mutagenesis with biophysical and functional analyses, we show that the modes of CEACAM recognition by HopQ and CEACAMs themselves are starkly different. Our data describe precise molecular mechanisms by which microbes exploit host CEACAMs for infection and enable future development of novel oncoprotein translocation inhibitors and H. pylori-specific antimicrobial agents.
Keywords: CEACAM; Helicobacter pylori; CagA; HopQ; X‐ray crystallography.
© 2018 The Authors.
Figures
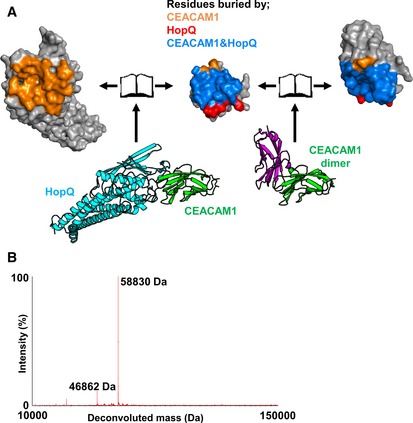
Bottom left—Crystal structure of HopQ‐CEAMCAM1 (cyan and green, respectively). Bottom right—The CEACAM1 homodimer (pdb code 2gk2 is orientated to overlay with CEACAM1 (green) in the HopQ‐CEACAM1 structure. The other half of CEACAM1 dimer is shown as magenta. Both complexes are rendered as a molecular surface representation in an open‐book conformation with HopQ (top left), CEACAM1 of both complexes (center), and CEACAM1 of the dimer (top right). Surfaces are colored according to residues buried by just CEACAM1 (orange), just HopQ (red), and by both HopQ and CEACAM1 (blue).
Deconvolution of raw native mass spectrometry data through maximum entropy displays a predominant population of 58,830 Da (mass of the HopQ‐CEACAM1 complex) and a minor population of 46,862 Da (uncomplexed HopQ).
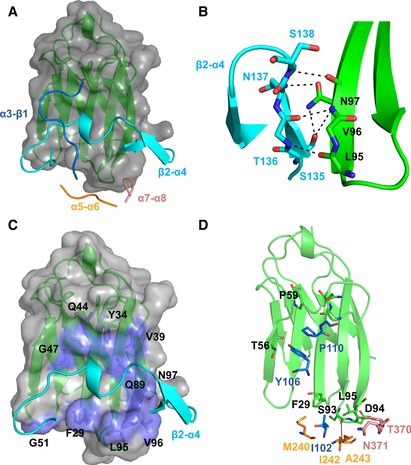
Cartoon representation of CEACAM1 (green) with a molecular surface (gray) bound by the four loops of HopQ; α3‐β1 (blue); β2‐α4 (cyan); α5‐α6 (yellow); and α7‐α8 (pink).
Residues 135–138 of the β2‐α4 loop (cyan) form a hydrogen bond network (black lines) to residues 95–97 of CEACAM1 (green).
Residues 145–156 of the β2‐α4 loop (cyan) make extensive van der Waals contacts (lilac) across all five β‐strands of CEACAM1 (green).
The α3‐β1, α5‐α6, and α7‐α8 loops (blue, yellow, pink, respectively) form several van der Waal contacts and hydrogen bonds (black lines) above and below the β2‐α4 loop to CEACAM1 (green).
- A
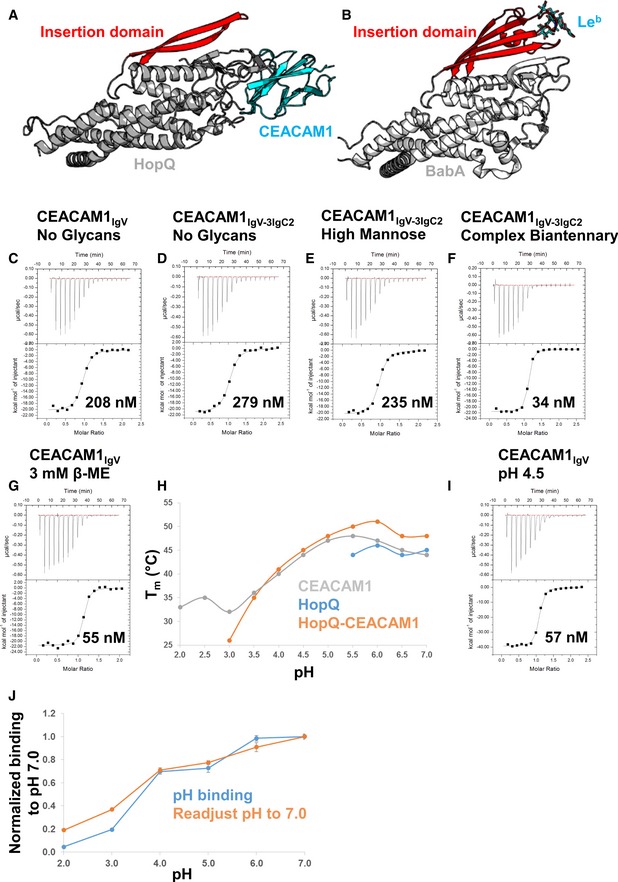
Cartoon representation of the HopQ‐CEACAM1 complex (gray and cyan, respectively) with the insertion domain of HopQ highlighted in red showing no contacts are made to CEACAM1.
- B
Cartoon representation of BabA (pdb code 5f9d, gray). The insertion domain of BabA (red) is in complex with the Leb heptasaccharide antigen (cyan sticks).
- C–G
Isothermal titration calorimetry profiles of HopQ binding to (C) CEACAM1IgV no glycans, (D) CEACAM1IgV‐3IgC2 no glycans, (E) CEACAM1IgV‐3IgC2 high‐mannose glycans, (F) CEACAM1IgV‐3IgC2 complex biantennary glycans, and (G) CEACAM1IgV with 3 mM β‐mercaptoethanol.
- H
Melting temperatures (T m) of CEACAM1 (gray), HopQ (blue), and the HopQ‐CEACAM1 complex (orange) were measured by thermal shift assay at various pHs between pH 2.0 and 7.0.
- I
ITC profile of HopQ‐CEACAM1IgV at pH 4.5.
- J
Acid sensitivity of HopQ binding to CEACAM1 as measured by ELISA at several pHs between 2.0 and 7.0 for 90 min is plotted as the blue line. The orange line shows the recovery of HopQ after 60 min of exposure to the various pHs by readjustment of the pH to 7.0. Two independent experiments were performed on four replicates (n = 8). Data were plotted as an average with error bars as standard errors of the mean.
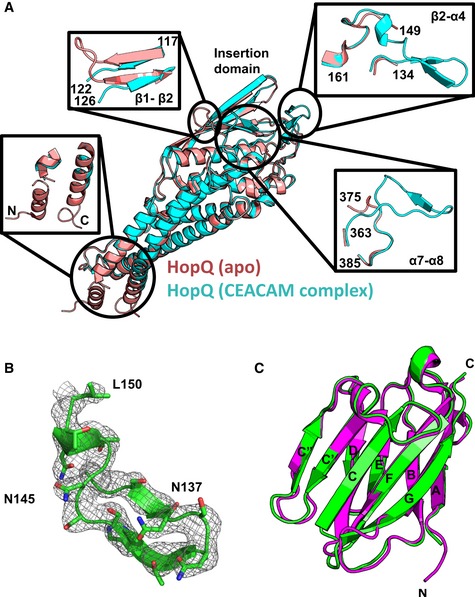
Apo‐HopQ (pdb code 5lp2, pink) superimposes with HopQ of the HopQ‐CEACAM1 complex (cyan) with a RMSD of 0.60 Å. Order‐disordering events occur upon complexation including, disordering of the coiled‐coils (bottom left) and the β1‐β2 loop (top left), and ordering of the β2‐α4 (top right) and the α7‐α8 (bottom right) loops.
Omit map contoured at 1.2 σ around residues 133–150 of the β2‐α4 loop.
CEACAM1 (pdb code 2gk2, magenta) superimposes with CEACAM1 of the HopQ‐CEACAM1 complex (green) with a RMSD of 0.66 Å.
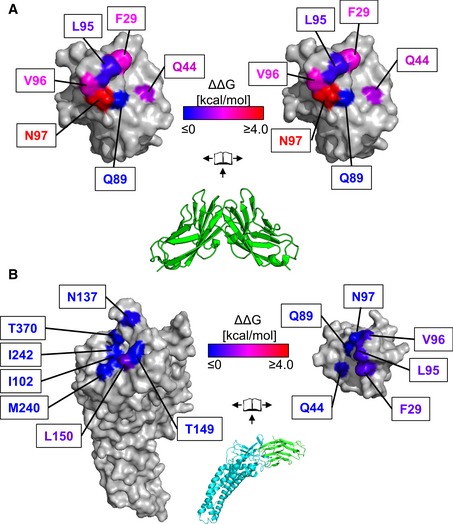
Center—Crystal structure of CEACAM1 homodimer (pdb code 2gk2, green). The dimer is rendered as a molecular surface representation in an open‐book conformation (left and right) with the surfaces colored according to changes in binding energies as measured by AUC.
Center—Crystal structure of HopQ (cyan) bound to CEACAM1 (green). The complex is rendered as a molecular surface representation in an open‐book conformation with the surfaces of HopQ (left) and CEACAM1 (right) colored according to changes in binding energies as determined by ITC. Whereas mutations in CEACAM1 cause changes in affinity which span at least a 1,000‐fold range in homodimerization, only small differences are observed in complexation with HopQ.
- A–G
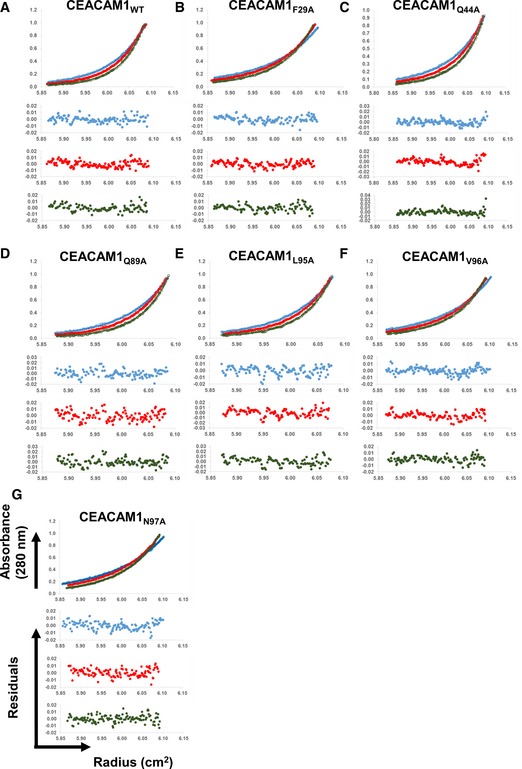
Sedimentation equilibrium analyses (Upper) and residuals of the fits for each curve (Lower) for (A) CEACAM1WT, (B) CEACAM1F29A, (C) CEACAM1Q44A, (D) CEACAM1Q89A, (E) CEACAM1L95AA, (F) CEACAM1V96A, and (G) CEACAM1N97A.
- A–O
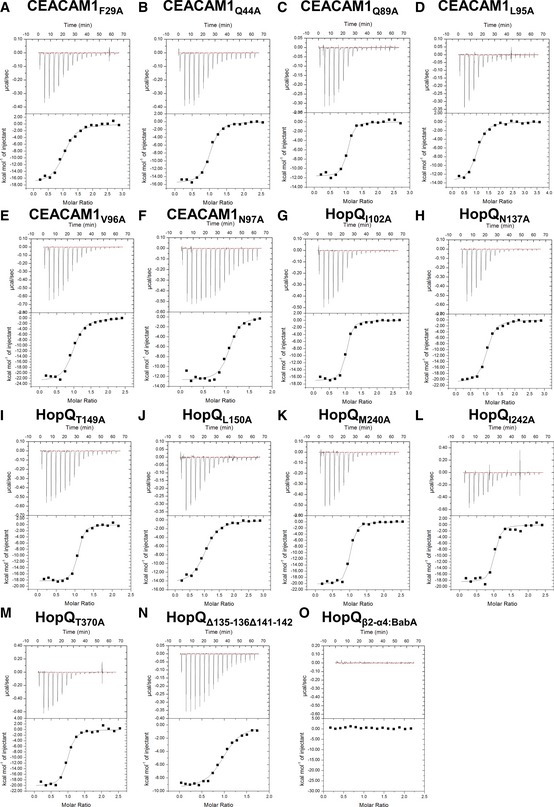
ITC binding curves of (A) CEACAM1F29A, (B) CEACAM1Q44A, (C) CEACAM1Q89A, (D) CEACAM1L95AA, (E) CEACAM1V96A, and (F) CEACAM1N97A titrated into HopQWT. ITC binding curves of (G) HopQI102A. (H) HopQN137A, (I) HopQT149A, (J) HopQL150A, (K) HopQM240A, (L) HopQI242A, (M) HopQT370A, (N) HopQΔ135–136Δ141–142, and (O) HopQβ2‐α4:BabA being titrated with CEACAM1WT.
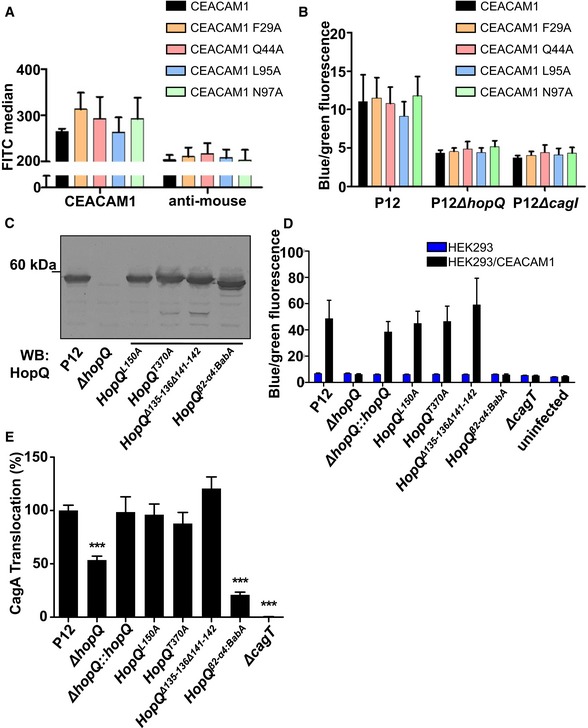
Flow cytometry showing the surface localization of full‐length CEACAM1 or derivatives with defined amino acid changes in the interaction domains.
HEK293 cells transiently transfected with CEACAM1 or CEACAM1 mutant derivatives, infected with P12 wt or mutant Helicobacter pylori strains producing TEM‐1‐CagA. Cells were analyzed using the TEM β‐lactamase assay.
Immunoblot showing the production of wt and mutant HopQ proteins of strain P12.
HEK293 or HEK293/CEACAM1‐producing cells infected with H. pylori P12 wt or defined hopQ mutant strains producing TEM‐1‐CagA.
Gastric epithelial cells (AGS) infected with H. pylori P12 wt or mutant strains expressing mutant versions of HopQ.
- A–D
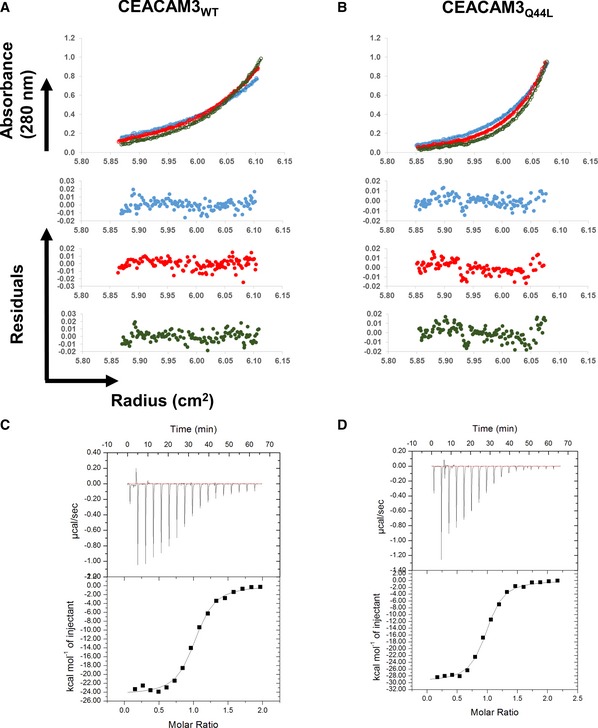
Sedimentation equilibrium analyses (Upper) and residuals of the fits for each curve (Lower) for (A) CEACAM3WT and (B) CEACAM3Q44L. ITC binding curves of (C) CEACAM3WT and (D) CEACAM3Q44L titrated into HopQWT.
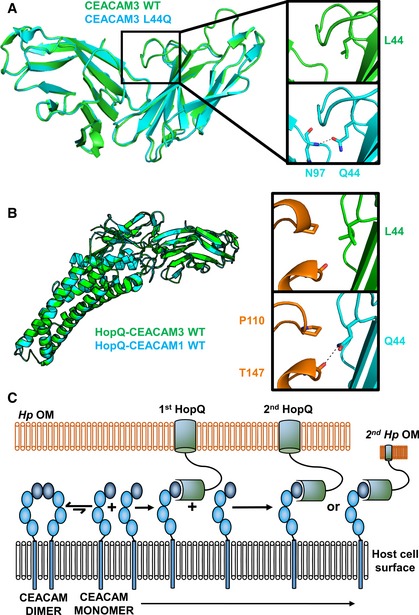
CEACAM3 WT (green) at position 44 is a leucine. By AUC, it is monomeric; however, it adopts a dimeric conformation in the crystal structure. CEACAM3 Leu44Gln mutation (cyan) creates two symmetrical hydrogen bonds across the dimer interface to the backbone of Asn97. This causes dimerization of CEACAM3. No structural changes are observed between CEACAM3 and mutant with a RMSD of 0.33 Å.
Superposition of the HopQ‐CEACAM1 complex (cyan) with the HopQ‐CEACAM3 WT complex reveals little structural changes between the complexes with a RMSD of 0.30 Å. In WT CEACAM3 (green), Leu44 forms van der Waal interactions with Pro110 of HopQ (orange). In CEACAM3, Leu44Gln (cyan) forms van der Waal interactions with Pro110 and a hydrogen bond to the main chain of Thr147 (orange).
Model of HopQ recruitment of CEACAM. CEACAM1 (blue) is predominately dimeric. HopQ (green) binding of CEACAM monomers causes redistribution of dimers to monomers which can bind further HopQ on the same bacterium or recruit other bacteria to the host cell.
References
-
- Barden S, Schomburg B, Conradi J, Backert S, Sewald N, Niemann HH (2014) Structure of a three‐dimensional domain‐swapped dimer of the Helicobacter pylori type IV secretion system pilus protein CagL. Acta Crystallogr D Biol Crystallogr 70: 1391–1400 - PubMed
-
- Benchimol S, Fuks A, Jothy S, Beauchemin N, Shirota K, Stanners CP (1989) Carcinoembryonic antigen, a human tumor marker, functions as an intercellular adhesion molecule. Cell 57: 327–334 - PubMed
-
- Billker O, Popp A, Gray‐Owen SD, Meyer TF (2000) The structural basis of CEACAM‐receptor targeting by neisserial Opa proteins. Trends Microbiol 8: 258–260; discussion 260‐1 - PubMed
Publication types
MeSH terms
Substances
LinkOut - more resources
Full Text Sources
Other Literature Sources
