. 2018 Jul;39(7):1316-1321.
doi: 10.3174/ajnr.A5664. Epub 2018 May 3.

Role of the Apparent Diffusion Coefficient as a Predictor of Tumor Progression in Patients with Chordoma

Affiliations

Role of the Apparent Diffusion Coefficient as a Predictor of Tumor Progression in Patients with Chordoma

T Sasaki et al. AJNR Am J Neuroradiol. 2018 Jul.

Abstract

Background and purpose: Diffusion-weighted imaging may aid in distinguishing aggressive chordoma from nonaggressive chordoma. This study explores the prognostic role of the apparent diffusion coefficient in chordomas.

Materials and methods: Sixteen patients with residual or recurrent chordoma were divided postoperatively into those with an aggressive tumor, defined as a growing tumor having a doubling time of <1 year, and those with a nonaggressive tumor on follow-up MR images. The ability of the ADC to predict an aggressive tumor phenotype was investigated by receiver operating characteristic analysis. The prognostic role of ADC was assessed using a Kaplan-Meier curve with a log-rank test.

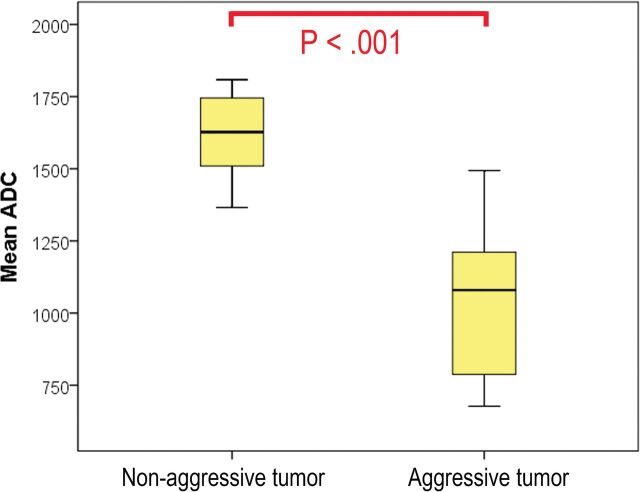
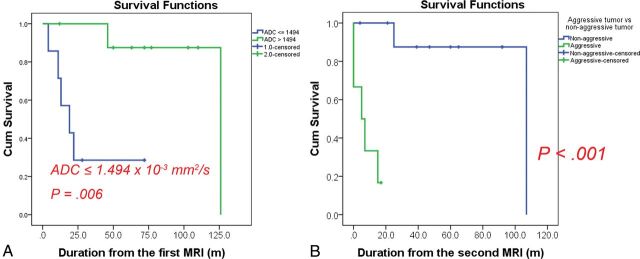
Results: Seven patients died during a median follow-up of 48 months (range, 4-126 months). Five of these 7 patients were in the aggressive tumor group, and 2 were in the nonaggressive tumor group. The mean ADC was significantly lower in the aggressive tumor group than in the nonaggressive tumor group (P = .002). Receiver operating characteristic analysis showed that a cutoff ADC value of 1.494 × 10⁻³ × mm2/s could be used to diagnose aggressive tumors with an area under the curve of 0.983 (95% CI, 0.911-1.000), a sensitivity of 1.000 (95% CI, 0.541-1.000), and a specificity of 0.900 (95% CI, 0.555-0.998). Furthermore, a cutoff ADC of ≤1.494 × 10⁻³ × mm2/s was associated with a significantly worse prognosis (P = .006).

Conclusions: Lower ADC values could predict tumor progression in postoperative chordomas.


Figures

Fig 1.
Fig 1.
Comparison of mean ADC values between groups with different tumor-progression statuses. There was a significant difference between the 2 groups (P < .001).
Fig 2.
Fig 2.
A 59-year-old man with a recurrent chordoma in the aggressive tumor group. A, Two years after the first surgery, contrast-enhanced T1-weighted imaging shows an expansile mass extending to the suprasellar region (arrows). B, The ROI outlined in yellow on the ADC map represents decreased water diffusivity (ADC = 1.211 × 10⁻³ × mm2/s). C, Contrast-enhanced T1-weighted imaging obtained 8 months later shows an increase of the mass (volume change ratio, 1.67; arrowheads) with a doubling time of 5.5 months. The patient died of disease 15 months after the second MR imaging examination.
Fig 3.
Fig 3.
A 10-year-old boy with a residual chordoma in the nonaggressive tumor group. A, Three years after the first operation, T2-weighted imaging shows an expansile mass in the clivus (arrows). B, The ROI outlined in yellow on the ADC map represents increased water diffusivity (ADC = 1.808 × 10⁻³ mm2/s). C, The mass was stable on T2-weighted imaging obtained 13 months later (volume change ratio = 0.11; arrowheads) with a doubling time of 10.0 years. He was still alive 7 years after the second MR imaging.
Fig 4.
Fig 4.
Kaplan-Meier curves using log-rank tests for survival. A, Graph shows 2 groups based on a cutoff ADC of 1.494 × 10⁻³ mm2/s at the first MR imaging. The group with the lower ADC had a significantly worse prognosis (P = .006). B, Graph shows the tumor progression rate in the 2 groups at the second MR imaging. The prognosis was significantly worse in the aggressive tumor group than in the nonaggressive tumor group (P < .001). The cutoff ADC value could predict patients with a worse prognosis at the first MR imaging at a mean of 9.1 ± 5.2 months earlier than the second MR imaging. Cum indicates cumulative.

References

    1. Fletcher CD, Bridge JA, Hogendoorn P, et al. . WHO Classification of Tumours of Soft Tissue and Bone. 4th ed Lyon: IARC Press; 2013
    1. Chugh R, Tawbi H, Lucas DR, et al. . Chordoma: the nonsarcoma primary bone tumor. Oncologist 2007;12:1344–50 10.1634/theoncologist.12-11-1344 - DOI - PubMed
    1. Müller U, Kubik-Huch RA, Ares C, et al. . Is there a role for conventional MRI and MR diffusion-weighted imaging for distinction of skull base chordoma and chondrosarcoma? Acta Radiol 2016;57:225–32 10.1177/0284185115574156 - DOI - PubMed
    1. Yeom KW, Lober RM, Mobley BC, et al. . Diffusion-weighted MRI: distinction of skull base chordoma from chondrosarcoma. AJNR Am J Neuroradiol 2013;34:1056–61, S1 10.3174/ajnr.A3333 - DOI - PMC - PubMed
    1. Hanna SA, Tirabosco R, Amin A, et al. . Dedifferentiated chordoma: a report of four cases arising ‘de novo.’ J Bone Joint Surg Br 2008;90:652–56 - PubMed

Publication types

LinkOut - more resources