Making Epidermal Bladder Cells Bigger: Developmental- and Salinity-Induced Endopolyploidy in a Model Halophyte
- PMID: 29724770
- PMCID: PMC6001328
- DOI: 10.1104/pp.18.00033
Making Epidermal Bladder Cells Bigger: Developmental- and Salinity-Induced Endopolyploidy in a Model Halophyte
Abstract
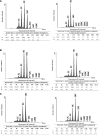
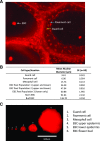
Endopolyploidy occurs when DNA replication takes place without subsequent mitotic nuclear division, resulting in cell-specific ploidy levels within tissues. In plants, endopolyploidy plays an important role in sustaining growth and development, but only a few studies have demonstrated a role in abiotic stress response. In this study, we investigated the function of ploidy level and nuclear and cell size in leaf expansion throughout development and tracked cell type-specific ploidy in the halophyte Mesembryanthemum crystallinum In addition to developmental endopolyploidy, we examined the effects of salinity stress on ploidy level. We focused specifically on epidermal bladder cells (EBC), which are modified balloon-like trichomes, due to their large size and role in salt accumulation. Our results demonstrate that ploidy increases as the leaves expand in a similar manner for each leaf type, and ploidy levels up to 512C were recorded for nuclei in EBC of leaves of adult plants. Salt treatment led to a significant increase in ploidy levels in the EBC, and these cells showed spatially related differences in their ploidy and nuclear and cell size depending on the positions on the leaf and stem surface. Transcriptome analysis highlighted salinity-induced changes in genes involved in DNA replication, cell cycle, endoreduplication, and trichome development in EBC. The increase in cell size and ploidy observed in M. crystallinum under salinity stress may contribute to salt tolerance by increasing the storage capacity for sodium sequestration brought about by higher metabolic activity driving rapid cell enlargement in the leaf tissue and EBC.
© 2018 American Society of Plant Biologists. All rights reserved.
Figures


Similar articles
-
Single cell-type analysis of cellular lipid remodelling in response to salinity in the epidermal bladder cells of the model halophyte Mesembryanthemum crystallinum.Plant Cell Environ. 2018 Oct;41(10):2390-2403. doi: 10.1111/pce.13352. Epub 2018 Jul 3. Plant Cell Environ. 2018. PMID: 29813189
-
Cell type-specific responses to salinity - the epidermal bladder cell transcriptome of Mesembryanthemum crystallinum.New Phytol. 2015 Aug;207(3):627-44. doi: 10.1111/nph.13414. Epub 2015 May 5. New Phytol. 2015. PMID: 25944243
-
Protein profiling of epidermal bladder cells from the halophyte Mesembryanthemum crystallinum.Proteomics. 2012 Sep;12(18):2862-5. doi: 10.1002/pmic.201200152. Epub 2012 Aug 22. Proteomics. 2012. PMID: 22848050
-
Salt tolerance, salt accumulation, and ionic homeostasis in an epidermal bladder-cell-less mutant of the common ice plant Mesembryanthemum crystallinum.J Exp Bot. 2007;58(8):1957-67. doi: 10.1093/jxb/erm057. Epub 2007 Apr 23. J Exp Bot. 2007. PMID: 17452753
-
Endopolyploidy as a potential alternative adaptive strategy for Arabidopsis leaf size variation in response to UV-B.J Exp Bot. 2014 Jun;65(10):2757-66. doi: 10.1093/jxb/ert473. Epub 2014 Jan 27. J Exp Bot. 2014. PMID: 24470468 Free PMC article. Review.
Cited by
-
The Application of Flow Cytometry for Estimating Genome Size, Ploidy Level Endopolyploidy, and Reproductive Modes in Plants.Methods Mol Biol. 2021;2222:325-361. doi: 10.1007/978-1-0716-0997-2_17. Methods Mol Biol. 2021. PMID: 33301101
-
Enhanced Na+ and Cl- sequestration and secretion selectivity contribute to high salt tolerance in the tetraploid recretohalophyte Plumbago auriculata Lam.Planta. 2023 Feb 9;257(3):52. doi: 10.1007/s00425-023-04082-7. Planta. 2023. PMID: 36757459
-
Do Specialized Cells Play a Major Role in Organic Xenobiotic Detoxification in Higher Plants?Front Plant Sci. 2020 Jul 9;11:1037. doi: 10.3389/fpls.2020.01037. eCollection 2020. Front Plant Sci. 2020. PMID: 32733524 Free PMC article.
-
Adaptive Mechanisms of Halophytes and Their Potential in Improving Salinity Tolerance in Plants.Int J Mol Sci. 2021 Oct 3;22(19):10733. doi: 10.3390/ijms221910733. Int J Mol Sci. 2021. PMID: 34639074 Free PMC article. Review.
-
A novel WD40-repeat protein involved in formation of epidermal bladder cells in the halophyte quinoa.Commun Biol. 2020 Sep 17;3(1):513. doi: 10.1038/s42003-020-01249-w. Commun Biol. 2020. PMID: 32943738 Free PMC article.
References
-
- Abramoff MD, Magalhaes PJ, Ram SJ (2004) Image processing with ImageJ. Biophoton Int 11: 36–42
-
- Adams P, Nelson DE, Yamada S, Chmara W, Jensen RG, Bohnert HJ, Griffiths H (1998) Growth and development of Mesembryanthemum crystallinum (Aizoaceae). New Phytol 138: 171–190 - PubMed
-
- Agarie S, Shimoda T, Shimizu Y, Baumann K, Sunagawa H, Kondo A, Ueno O, Nakahara T, Nose A, Cushman JC (2007) Salt tolerance, salt accumulation, and ionic homeostasis in an epidermal bladder-cell-less mutant of the common ice plant Mesembryanthemum crystallinum. J Exp Bot 58: 1957–1967 - PubMed
-
- Baloban M, Vanstraelen M, Tarayre S, Reuzeau C, Cultrone A, Mergaert P, Kondorosi E (2013) Complementary and dose-dependent action of AtCCS52A isoforms in endoreduplication and plant size control. New Phytol 198: 1049–1059 - PubMed
Publication types
MeSH terms
LinkOut - more resources
Full Text Sources
Other Literature Sources

