. 2018 Jun;28(6):878-890.
doi: 10.1101/gr.230771.117. Epub 2018 May 3.

bigSCale: an analytical framework for big-scale single-cell data

Affiliations

bigSCale: an analytical framework for big-scale single-cell data

Giovanni Iacono et al. Genome Res. 2018 Jun.

Abstract

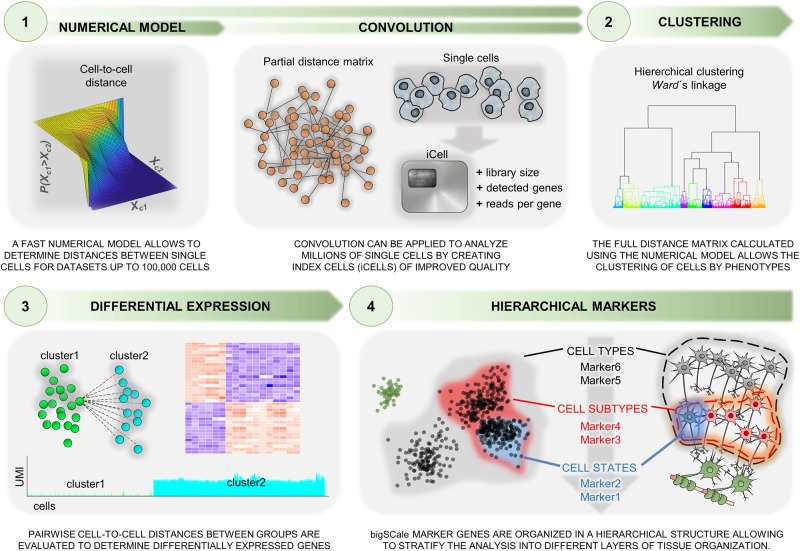
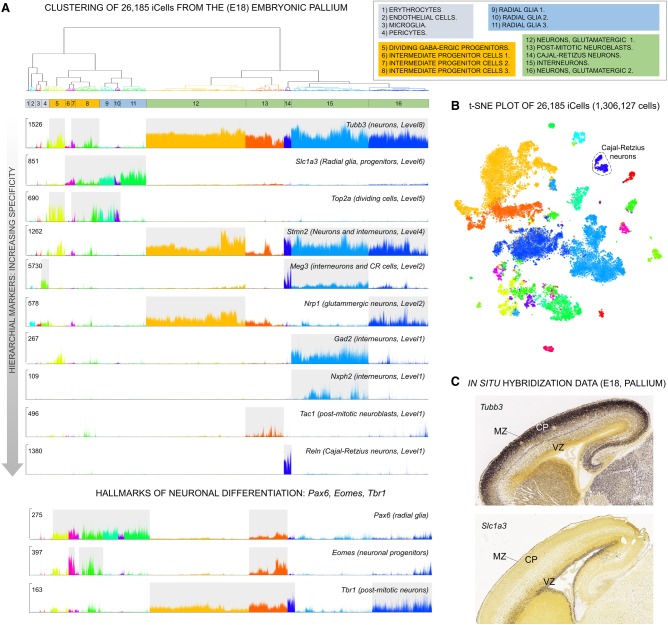
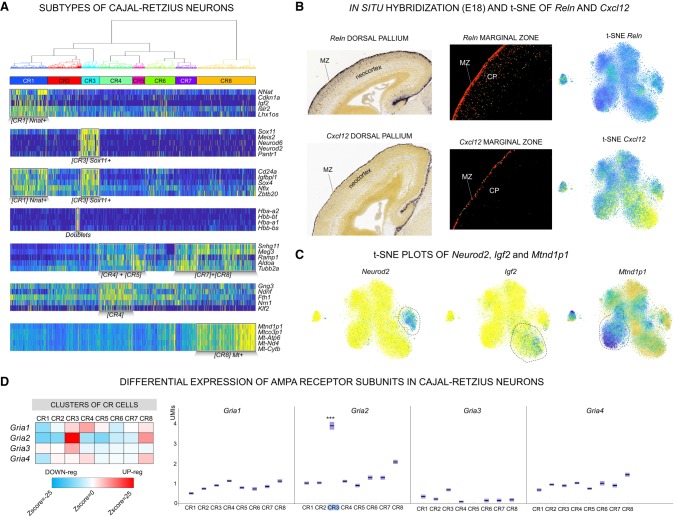
Single-cell RNA sequencing (scRNA-seq) has significantly deepened our insights into complex tissues, with the latest techniques capable of processing tens of thousands of cells simultaneously. Analyzing increasing numbers of cells, however, generates extremely large data sets, extending processing time and challenging computing resources. Current scRNA-seq analysis tools are not designed to interrogate large data sets and often lack sensitivity to identify marker genes. With bigSCale, we provide a scalable analytical framework to analyze millions of cells, which addresses the challenges associated with large data sets. To handle the noise and sparsity of scRNA-seq data, bigSCale uses large sample sizes to estimate an accurate numerical model of noise. The framework further includes modules for differential expression analysis, cell clustering, and marker identification. A directed convolution strategy allows processing of extremely large data sets, while preserving transcript information from individual cells. We evaluated the performance of bigSCale using both a biological model of aberrant gene expression in patient-derived neuronal progenitor cells and simulated data sets, which underlines the speed and accuracy in differential expression analysis. To test its applicability for large data sets, we applied bigSCale to assess 1.3 million cells from the mouse developing forebrain. Its directed down-sampling strategy accumulates information from single cells into index cell transcriptomes, thereby defining cellular clusters with improved resolution. Accordingly, index cell clusters identified rare populations, such as reelin (Reln)-positive Cajal-Retzius neurons, for which we report previously unrecognized heterogeneity associated with distinct differentiation stages, spatial organization, and cellular function. Together, bigSCale presents a solution to address future challenges of large single-cell data sets.


Figures

Figure 1.
Figure 1.
Schematic representation of the bigSCale framework for analyzing millions of single-cell transcriptomes. The analytical framework includes a numerical model step to determine distances between single cells and modules for differential expression (DE) analysis, cell clustering, and population marker identification. An optional convolution strategy allows the processing of extremely large data sets (preserving the transcript information from individual cells).
Figure 2.
Figure 2.
Benchmarking of sensitivity, specificity, and speed of bigSCale, SCDE, Seurat, MAST, scDD, BPSC, and Monocle2. (A) DE analysis in iPS cell–derived neuronal progenitor cells (NPCs) from healthy and Williams-Beuren (WB) syndrome donors (WT vs. WB1). For the genes located in the deleted region, the P-values of each tool are shown in Z-score scale. (Red) Down-regulated; (blue) up-regulated. Genes correctly detected as down-regulated are highlighted (gray). Total numbers of correctly assigned genes are indicated (below). (B) Venn diagrams for WT versus WB1 comparing the identity of correctly assigned genes. (Orange) bigSCale; (blue) others. (C) Average number of detected down-regulated (red) and up-regulated (blue) genes in the two WB and Dup7 patients, respectively, compared with a healthy donor. (D) Comparison of the mean-variance relationship in the two simulated data sets (sim_NPC and sim_10×). (E,F) Partial AUCs of ROC curves computed across the tools in the two simulated data sets (sim_NPC, E; sim_10×, F) with group sizes having proportions 1:1 (1×). The sensitivity at high level of specificity (>90%) is highlighted (gray area). (G) Barplots of partial AUC across tools for all tested proportions (1×, 2×, 10×) in DE analysis of simulated data sets (sim_NPC and sim_10×). (H) Average required time for computing DE in the NPC cell model (average 739 total cells per comparison, four comparisons, tools run on one CPU-core). (I) Scalability of bigSCale and MAST with large data sets. MAST could not be tested beyond 8000 cells due to excessive RAM requirements (>16 Gb).
Figure 3.
Figure 3.
bigSCale analysis of scRNA-seq data from 3005 mouse cortical and hippocampal cells (Zeisel et al. 2015). (A) Dendrogram and expression plots reporting examples of hierarchical markers. Dendrogram was cut at 20% of its total depth to segregate nine different clusters of cells, which correspond to the main brain cell types. In the expression plots, UMI counts are shown at single-cell level for markers of different hierarchical marker levels (Methods). Marker genes for decreasing marker levels, representing distinct brain cell types are displayed. (B) Comparison of bigSCale and BackSPIN (Zeisel et al. 2015) in the detection of gene markers for astrocytes. bigSCale identified 167 additional markers with high specificity for astrocytes (high expression, yellow; low expression, blue). Vice versa, markers uniquely identified by BackSPIN display a weak specificity and achieved low scoring in bigSCale.
Figure 4.
Figure 4.
Assessment of the cell convolution strategy in bigSCale. (A) Comparison of original and convoluted clustering with the Rand index (RI). Pairwise cell comparisons were performed for three increasing degrees of convolution (Conv1,2,3) into iCells (numbers indicated). Similarity of clustering (RI; y-axis) were evaluated at different resolution (n cluster numbers; x-axis). RI were >80% for all tested combinations, pointing to highly similar cluster assignment for original and iCells. (B) t-SNE plots comparing original and convoluted clustering. The example displays a comparison with RI = 82% and 12 clusters. The high degree of concordance between experiments is visible through the consistent cluster assignment of cell pairs.
Figure 5.
Figure 5.
bigSCale analysis of 26,185 iCells (convoluted from 1,306,127 single cells) of the embryonic pallium (E18). (A) Dendrogram of 16 iCell clusters representing the major cell types (split by color) and subpopulations (cluster 1–16). Single-cell expression plots (UMI counts) present marker genes (decreasing levels of hierarchical markers) for the main subpopulations and specific markers for neuronal differentiation (lower panel). (B) t-SNE representation of the 16 populations of pallial cells identified by bigSCale clustering. (C) In situ hybridization data for Tubb3 and Slc1a3. Post-mitotic neurons (Tubb3 positive) locate to the outer neocortical layers, including cortical plate (CP) and marginal zone (MR), and radial glia and progenitors (Scl1a3 positive) are found in the ventricular and subventricular zone (VZ).
Figure 6.
Figure 6.
Subtypes of Cajal-Retzius (CR) cells disentangled by bigSCale. (A) Dendrogram and heatmap of the five top-scoring population markers (CR1–8; high expression, yellow; low expression, blue). (B) Comparison of Reln (top) and Cxcl12 (bottom) expression spatially resolved (in situ immunostaining [left] and fluorescence-staining [center]; source Allen Brain Atlas: Mouse Brain). Reln consistently marks all CR cells (t-SNE; right) located in the MZ and the CP. Cxcl12 is expressed in a CR subpopulation and in situ experiments indicate that Cxcl12-positive cells are exclusively located in the MZ. (C) t-SNE representation of Neurod2-positive, Igf2-positive, and Mt-nd1–positive subpopulations of CR cells. (D) DE of AMPA receptor subunits in CR cells. (Left) Heatmap (Z-scores) representing the relative expression level of each AMPA subunit in the CR subpopulations. (Red) Higher expression; (blue) lower expression. (Right) Expression of AMPA receptors displayed by UMI counts (y-axis). Significant DE is indicated; (***) Z-score > 10.

References

    1. Antonucci F, Corradini I, Fossati G, Tomasoni R, Menna E, Matteoli M. 2016. SNAP-25, a known presynaptic protein with emerging postsynaptic functions. Front Synaptic Neurosci 8: 7. - PMC - PubMed
    1. Bacher R, Chu L-F, Leng N, Gasch AP, Thomson JA, Stewart RM, Newton M, Kendziorski C. 2017. SCnorm: robust normalization of single-cell RNA-seq data. Nat Methods 14: 584–586. - PMC - PubMed
    1. Bendall SC, Davis KL, Amir ED, Tadmor MD, Simonds EF, Chen TJ, Shenfeld DK, Nolan GP, Pe'er D. 2014. Single-cell trajectory detection uncovers progression and regulatory coordination in human B cell development. Cell 157: 714–725. - PMC - PubMed
    1. Cao J, Packer JS, Ramani V, Cusanovich DA, Huynh C, Daza R, Qiu X, Lee C, Furlan SN, Steemers FJ, et al. 2017. Comprehensive single-cell transcriptional profiling of a multicellular organism. Science 357: 661–667. - PMC - PubMed
    1. Chauvin S, Sobel A. 2015. Neuronal stathmins: a family of phosphoproteins cooperating for neuronal development, plasticity and regeneration. Prog Neurobiol 126: 1–18. - PubMed

Publication types