. 2018 Jul;209(3):725-741.
doi: 10.1534/genetics.118.301019. Epub 2018 May 3.

Rapid Phenotypic and Genotypic Diversification After Exposure to the Oral Host Niche in Candida albicans

Affiliations

Rapid Phenotypic and Genotypic Diversification After Exposure to the Oral Host Niche in Candida albicans

Anja Forche et al. Genetics. 2018 Jul.

Abstract

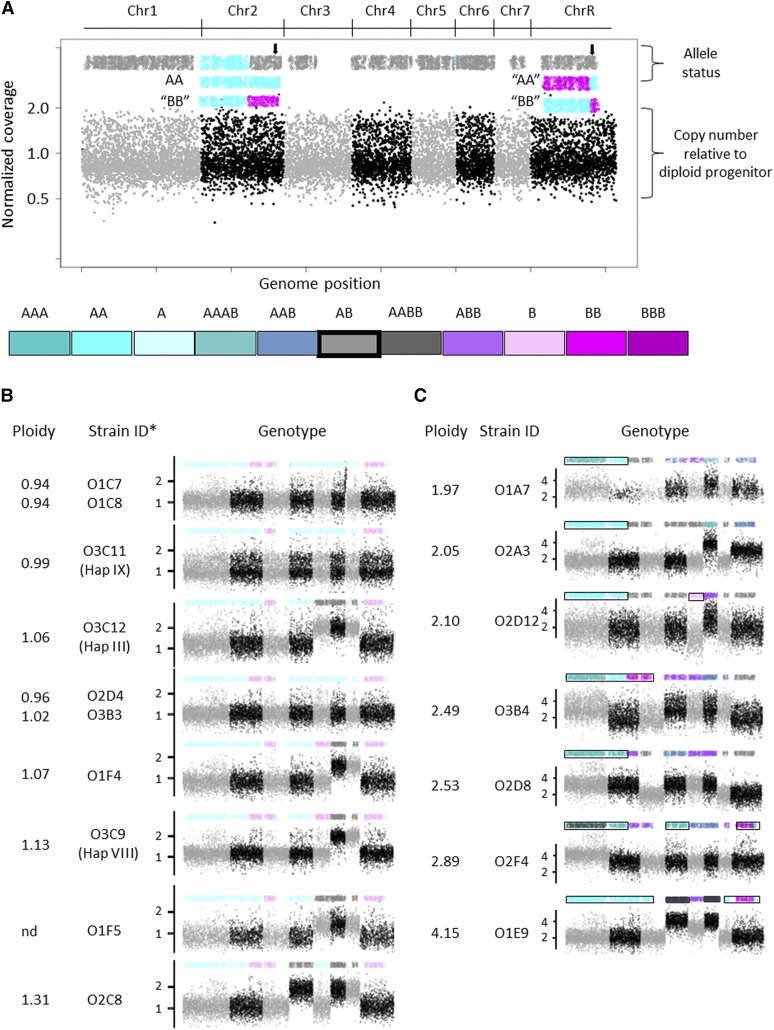
In vitro studies suggest that stress may generate random standing variation and that different cellular and ploidy states may evolve more rapidly under stress. Yet this idea has not been tested with pathogenic fungi growing within their host niche in vivo Here, we analyzed the generation of both genotypic and phenotypic diversity during exposure of Candida albicans to the mouse oral cavity. Ploidy, aneuploidy, loss of heterozygosity (LOH), and recombination were determined using flow cytometry and double digest restriction site-associated DNA sequencing. Colony phenotypic changes in size and filamentous growth were evident without selection and were enriched among colonies selected for LOH of the GAL1 marker. Aneuploidy and LOH occurred on all chromosomes (Chrs), with aneuploidy more frequent for smaller Chrs and whole Chr LOH more frequent for larger Chrs. Large genome shifts in ploidy to haploidy often maintained one or more heterozygous disomic Chrs, consistent with random Chr missegregation events. Most isolates displayed several different types of genomic changes, suggesting that the oral environment rapidly generates diversity de novo In sharp contrast, following in vitro propagation, isolates were not enriched for multiple LOH events, except in those that underwent haploidization and/or had high levels of Chr loss. The frequency of events was overall 100 times higher for C. albicans populations following in vivo passage compared with in vitro These hyper-diverse in vivo isolates likely provide C. albicans with the ability to adapt rapidly to the diversity of stress environments it encounters inside the host.

Keywords: Candida albicans; aneuploidy; colony phenotype; hyper-variability; loss of heterozygosity; oropharyngeal candidiasis.


Figures

Figure 1
Figure 1
Experimental overview of in vivo and in vitro experiments.
Figure 2
Figure 2
Genotypic and phenotypic diversity arises early during oral infection. (A) CPs arise later in the Gal+ group (day 2, left graph) compared to the Gal group (day 1, right graph) but are not observed in vitro. ●’s, total CFUs, ▴, CPs. (B) Ploidy changes (as measured by flow cytometry) do not arise in the Gal+ group, but do in the Gal group with ploidy shifts observed as early as day 1 postinfection. (C) Simpson’s D is high on average and depends strongly on composition of populations within mice (Gal+:Gal ratio of isolates). Left, overall Simpson’s D; right, Simpson’s D by days spent in mice. (D) Bubble plot shows the number of haploid, diploid, or aneuploid isolates (as measured by flow cytometry) that exhibit indicated CPs determined by growth on YPD at 30° for 3 days. CP binary codes are shown in parenthesis (see also Table S2). Bubble size reflects the number of isolates.
Figure 3
Figure 3
Whole-genome ploidy shifts are rare. (A) Shown is the ddRADseq whole-genome karyotype for parental strain YJB9318. Allele status is indicated on the top. Bottom half of figure provides copy number for each Chr relative to diploid parent (1 = 2 copies). Chrs are colored in light gray and black to indicate start/end of each Chr. Color coding is used throughout for indicated genotypes. Each dot on the bottom part (copy number) is a copy number estimate for a restriction fragment based on the reads aligning to one end of the restriction fragment. The dots on the top part (allele status) are maximum-likelihood estimates of allele ratios at each (sequenced) known SNP site, constrained by the Chr or segment copy number and smoothed across a number of adjacent sites (see also Materials and Methods). The colors for the allele status provide exact genotype for each Chr. Note: This strain background (RM1000 #2) has a preexisting Chr2L allele A homozygosis and a crossover on ChrR occurred during generation of the parental strain that was unmasked in isolates that became homozygous. In the case of whole Chr LOH, the genotype at the centromere was called (see black arrows). Gaps in allele coverage on Chrs3, 7, and R are due to lack of heterozygosity in the reference strain SC5314 used for analysis (Forche et al. 2004; van het Hoog et al. 2007; Butler et al. 2009). (B) Haploids and near haploids exhibit different genotypes. *, strain names in parenthesis are from Hickman et al. 2013; x-axis, Chrs are ordered Chrs1–7 and ChrR; y-axis, Chr copy number. (C) Isolates with more than two ploidies per genome suggestive of ploidy shifts in progress.
Figure 4
Figure 4
Overview of missegregation events across Chrs. (A) Whole Chr aneuploidies include trisomies and tetrasomies. The number of disomic Chrs from haploids and near haploids is shown in parentheses. Y-axis: normalized copy number relative to diploid parent. Aneuploid Chrs are boxed in. Note: Images show single whole Chr aneuploidies for clarity; most isolates carry more than one whole Chr aneuploidy. (B) Single and double aneuploidies are detected both for Gal+ and Gal isolates. Shown is number of isolates with one aneuploidy and two aneuploidies that were acquired in vivo. Chrs are shown from Chr1, Chrs2–7, and ChrR. (C) Whole Chr LOH more frequently occurs on larger Chrs1–3, and ChrR in Gal isolates. Combinations of whole Chr LOH were not observed in Gal+ isolates.
Figure 5
Figure 5
Recombination and missegregation events. (A) LOH breakpoints for Chrs 2–7, and ChrR. (B) Location of LOH breakpoints along Chr1. Top horizontal black lines represent the two homologs; black oval represents centromeres; open and closed black arrows show location of the major repeat sequence; red arrows point to preexisting cross overs Chr sizes are shown to the right of each Chr. The number of isolates for each genotype are indicated at the left. For Chr1 the numbers are in shades of yellow/brown, with higher numbers shaded darker; cyan, homozygous AA; magenta, homozygous BB; gray, heterozygous AB. Breakpoints were mapped in 25-kb bins. Exact start/end coordinates of break regions can be found in Table S4. Positions 1.6–2.8 Mb on Chr1 (indicated with two solid vertical black lines) are not shown due to lack of any LOH events across this region. Maps are to scale. (C) Crossover-associated events most often lead to GAL1 loss in vivo. GC, gene conversion; missegr., missegregation; Recomb., recombination; XO, crossover.
Figure 6
Figure 6
Complex changes on individual Chrs include multiple recombination events on single Chrs (mostly Chr1), segmental deletions, truncations, and amplifications. For legend, please see Figure 5. SGM, segmental; Amp., amplification; Tr., truncation; associated black arrows point towards amplified or truncated region. For Chr1, vertical black arrows border internal segmental truncation.
Figure 7
Figure 7
Recurrent missegregation events are frequent. Calculations were done for mice with C. albicans population size ≥12 (9 of 17 mice); bubble sizes reflect the percentage of mice where the specific missegregation event (indicated on x-axis) was found. For example, whole Chr1 LOH allele AA and whole Chr6 trisomy were found in all nine mice (100%). Y-axis, Chrs 1–7, and ChrR; x-axis, missegregation genotypes.
Figure 8
Figure 8
Multiple changes (more than five) per isolate are significantly more frequent than what would be expected by random chance alone in vivo but not in vitro. (A) Multiple combinatorial (recombination + missegregation) events are most frequent in Gal with CPs. Percentage of multiple event types for Gal+ isolates (top left), Gal+ plus CP (top right), Gal (bottom left), and Gal plus CP (bottom right). Y-axis, number of recombination events/isolate; x-axis, number of missegregation events per isolate. Bubble size represents the number of isolates with indicated combinations, e.g., number of isolates that have one recombination and one missegregation event. Expected vs. observed frequencies of changes (B) in vivo and (C) in vitro. Significance is indicated by * P < 0.05; ** P < 0.01.

References

    1. Abbey D., Hickman M., Gresham D., Berman J., 2011. High-resolution SNP/CGH microarrays reveal the accumulation of loss of heterozygosity in commonly used Candida albicans strains. G3 (Bethesda) 1: 523–530. 10.1534/g3.111.000885 - DOI - PMC - PubMed
    1. Bennett R. J., Forche A., Berman J., 2014. Rapid mechanisms for generating genome diversity: whole ploidy shifts, aneuploidy, and loss of heterozygosity. Cold Spring Harb. Perspect. Med. 4: a019604 10.1101/cshperspect.a019604 - DOI - PMC - PubMed
    1. Bensen E. S., Filler S. G., Berman J., 2002. A forkhead transcription factor is important for true hyphal as well as yeast morphogenesis in Candida albicans. Eukaryot. Cell 1: 787–798. 10.1128/EC.1.5.787-798.2002 - DOI - PMC - PubMed
    1. Bowen N., Smith C. E., Srivatsan A., Willcox S., Griffith J. D., et al. , 2013. Reconstitution of long and short patch mismatch repair reactions using Saccharomyces cerevisiae proteins. Proc. Natl. Acad. Sci. USA 110: 18472–18477. 10.1073/pnas.1318971110 - DOI - PMC - PubMed
    1. Butler G., Rasmussen M. D., Lin M. F., Santos M. A. S., Sakthikumar S., et al. , 2009. Evolution of pathogenicity and sexual reproduction in eight Candida genomes. Nature 459: 657–662. 10.1038/nature08064 - DOI - PMC - PubMed

Publication types