. 2018 Jul 19;132(3):307-320.
doi: 10.1182/blood-2017-10-810986. Epub 2018 May 3.

Targeting HSP90 dimerization via the C terminus is effective in imatinib-resistant CML and lacks the heat shock response

Affiliations

Targeting HSP90 dimerization via the C terminus is effective in imatinib-resistant CML and lacks the heat shock response

Sanil Bhatia et al. Blood. .

Abstract

Heat shock protein 90 (HSP90) stabilizes many client proteins, including the BCR-ABL1 oncoprotein. BCR-ABL1 is the hallmark of chronic myeloid leukemia (CML) in which treatment-free remission (TFR) is limited, with clinical and economic consequences. Thus, there is an urgent need for novel therapeutics that synergize with current treatment approaches. Several inhibitors targeting the N-terminal domain of HSP90 are under investigation, but side effects such as induction of the heat shock response (HSR) and toxicity have so far precluded their US Food and Drug Administration approval. We have developed a novel inhibitor (aminoxyrone [AX]) of HSP90 function by targeting HSP90 dimerization via the C-terminal domain. This was achieved by structure-based molecular design, chemical synthesis, and functional preclinical in vitro and in vivo validation using CML cell lines and patient-derived CML cells. AX is a promising potential candidate that induces apoptosis in the leukemic stem cell fraction (CD34+CD38-) as well as the leukemic bulk (CD34+CD38+) of primary CML and in tyrosine kinase inhibitor (TKI)-resistant cells. Furthermore, BCR-ABL1 oncoprotein and related pro-oncogenic cellular responses are downregulated, and targeting the HSP90 C terminus by AX does not induce the HSR in vitro and in vivo. We also probed the potential of AX in other therapy-refractory leukemias. Therefore, AX is the first peptidomimetic C-terminal HSP90 inhibitor with the potential to increase TFR in TKI-sensitive and refractory CML patients and also offers a novel therapeutic option for patients with other types of therapy-refractory leukemia because of its low toxicity profile and lack of HSR.


Conflict of interest statement

Conflict-of-interest disclosure: The authors declare no competing financial interests.

Figures

None
Graphical abstract
Figure 1.
Figure 1.
Design and synthesis of HSP90 CTD dimerization inhibitors. (A) Crystal structure of the HSP90 dimer from Saccharomyces cerevisiae (Protein Data Bank [PDB] accession number 2CG9), shown as a transparent surface with cartoon representation. One monomer is colored in white and one in red, with 3 domains (N terminal, middle, and C terminal) colored in different shades of red. (B) Dimeric CTD from human HSP90 (PDB accession number 3Q6M). Both subunits are colored differently. Helices H4, H4′, and H5, H5′ form the CTD dimerization interface. Dashed lines show where the middle domains would be located. (C) Overlay of a hexameric α-aminoxy peptide with all-methyl side chains (blue sticks) onto Cβ atoms of hot spot amino acids I688, Y689, I692, and L696 (gray sticks) on helix H5′ (sequence P681 to D699) shown in transparent cartoon representation, with backbone atoms shown as black lines. The right panel shows the structures rotated by 90° such that the helix C terminus is oriented toward the viewer. Cβ reference atoms of hot spot amino acids are depicted as magenta spheres and Cβ atoms of the α-aminoxy peptide as orange spheres. (D) Solid-phase synthesis of α-aminoxy hexapeptides 1 (AX) and 2. Reagents and conditions: a), (i) 20% piperidine in N,N-dimethylformamide (DMF), room temperature, 2 × 15 min; (ii) Phth-NOLeu-NOLeu-OH, BOP, HOBt, N-ethylmorpholine (NEM) in DMF, room temperature, 24 hours; b) 5% hydrazine hydrate in MeOH, 2 × 15 min; (ii) Phth-NOIle-NOIle-OH, BOP, HOBt, NEM in DMF, room temperature, 24 hours; c) (i) 5% hydrazine hydrate in MeOH, 2 × 15 min; (ii) Cbz-NOPhe-NOPhe-OH, BOP, HOBt, NEM in DMF, room temperature, 24 hours; (iii) trifluoroacetic acid/triethylsilane (98:2, v:v), room temperature, 1.5 hours; d) (i) 5% hydrazine hydrate in MeOH, 2 × 15 min; (ii) Phth-NOPhe-OH, BOP, HOBt, NEM in DMF, room temperature, 24 hours; e) 5% hydrazine hydrate in MeOH, 2 × 15 min; (ii) Cbz-NOTyr(t-Bu)-OH, BOP, HOBt, NEM in DMF, room temperature, 24 hours; (iii) trifluoroacetic acid/triethylsilane (98:2, v:v), room temperature, 1.5 hours. PEG AM resin, polyethylene glycol aminomethyl-polystyrene resin.
Figure 2.
Figure 2.
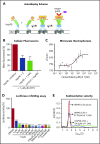
Selective binding of compound 1 (AX) and 2 to the HSP90 C terminus. (A) Scheme of the HSP90 dimerization assay using Autodisplay. HSP90 is displayed on the surface of E coli cells via the Autodisplay technique. The motility of the anchoring domain within the outer membrane of E coli facilitates the dimerization of Hsp90. Dimerized HSP90 on the surface of E coli is capable of binding to fluorescein isothiocyanate (FITC)–labeled p53. This leads to an increase of cellular fluorescence, which can then be detected via flow cytometry. Blocking the dimerization of surface displayed Hsp90 inhibits the binding of FITC-labeled p53 to HSP90 and thus leads to a decrease of cellular fluorescence. (B) Inhibition of dimerization of on E coli cells displayed HSP90 measured via flow cytometry. Experiments were performed 3 times independently (n = 3), and error bars denote the standard deviation. Incubation of E coli BL21 (DE3) cells displaying HSP90 with 1 µM FITC-labeled p53 leads to a high cellular fluorescence, indicating dimerization of HSP90, whereas no cellular fluorescence was detectable in E coli cells without displaying HSP90 (control cells). Preincubation of cells with surface displayed HSP90 with 50 µM of 1 (AX) and 2, respectively, leads to a loss in cellular fluorescence, indicating a lowered binding affinity of FITC-labeled p53 to surface-displayed HSP90. (C) Determination of the apparent Kd value of the NT-647–labeled C-terminal domain of HSP90 and 1 (AX) via MST. A constant amount of the 50 nM–labeled C-terminal domain of HSP90 was used (n = 3). The resulting mean values were determined and used in the Kd fit formula. This yielded an apparent Kd of 27.39 µM for 1 (AX). (D) A cell-based HSP90-dependent luciferase assay was performed on stably expressing K562-luciferase cells. The extent of thermally denatured luciferase refolding (3 minutes at 50°C) in the presence of 1 (AX), NB, and AUY922 was monitored after 180 minutes. (E) Influence of 1 (AX) on the size distribution of HSP90 CTD revealed by sedimentation velocity analysis. 20 μM HSP90 CTD alone (purple), 20 μM HSP90 CTD plus 27.4 μM 1 (AX) (blue), and 20 μM HSP90 CTD plus 54.8 μM 1 (AX) (cyan) were analyzed at 50 000 rpm at 20°C, and the continuous c(s) model was applied to evaluate the data. The s-values were standardized to s20,w-values. Columns depict the mean of 3 independent experiments (n = 3). Significance analyses of normally distributed data with variance similar between groups used paired, 2-tailed Student t test. *P < .05, **P < .005, ***P < .001.
Figure 3.
Figure 3.
Results of MD simulations of free diffusion of AX. (A) Relative frequencies of ligand pose (see color scale) as a function of the relative distance between the center of mass of AX and helix H4 (ΔD) and computed effective energies of binding (ΔGeffective). (B) Locations of the center of mass of AX (spheres) after 60 MD simulations of 400 nanosecond length each, with each simulation result colored differently. The black dashed line highlights all conformations that are bound to dimerization interface 1 with ΔDmin ≤ 0 Å, and the green dashed line highlights those with ΔDmin < 4 Å. The protein structure is shown as surface representation with the middle domain (not present during MD simulations) in orange and the CTD in white. In the panel, the structure is rotated by 180° around the y-axis. (C) Frequency of occupation of binding sites 1 (yellow), close to 1 (green; see definition in the main text), 2 (red), or 3 (blue) by AX across 60 MD simulations. (D) Binding mode model of AX. A representative conformation of AX bound to the CTD, extracted from the MD trajectory. Residues I688, I692, and M691 (gray spheres) bind to the side chain that distinguishes AX from 2. (E) An overlay of AX onto helix H5′ (Figure 1B-C) extracted from the crystal structure (PDB accession number 3Q6M). In panels D and E, AX is depicted as blue sticks; hot spot amino acids I688, Y689, I692, and L696 as gray sticks with Cβ atoms as magenta spheres; helix H5′ as a white cartoon with black backbone atoms; and the CTD in the left panel as surface representation, with all residues within 3 Å of AX colored in red. In panels A-C, 1, 2, and 3 denote the binding sites of AX, where 3 represents all binding sites besides 1 and 2.
Figure 4.
Figure 4.
AX is a potent inhibitor in leukemic cell lines without inducing any HSR. (A) K562, KCL22, and HL60 were treated with the indicated (cytotoxic) concentration of AX, NB and AUY922 for 48 hours, and protein lysates were later subjected to immunoblot analysis. AX and NB (C-terminal HSP90 inhibitors) do not induce expression of HSP70, HSP40, and HSP27, whereas AUY922 (an N-terminal HSP90 inhibitor) demonstrates HSR induction by triggering their expression. HSP60 (primarily present in mitochondria) and PDI (primarily present in endoplasmic reticulum) served as controls for the HSR in the cytoplasm, in response to inhibition of HSP90 dimerization via the CTD. (B) K562, KCL22, and HL60 (Mutz-2; data not shown) were treated with AX for 48 hours, and enzymatic activity of caspase-3/7 was later examined by caspase-3/7–dependent Glo assay (absorbance at 405 nm). (C) K562, HL60, KCL22 cells were seeded in methylcellulose medium containing respective compounds at indicated concentration after treatment in liquid medium for 24 hours. Colonies were counted after 14 days. (D) 5 × 10⁵ luciferase-expressing K562 cells were subcutaneously transplanted into NSG mice. Starting the day after transplantation, animals were treated by peritumoral injection (15 µg) of compound AX (0.5 mg/kg dose) or solvent only (DMSO). One control DMSO-treated mouse was sacrificed earlier (on day 16) because of large tumor size. Luminescence was monitored every 3 or 4 days after intraperitoneal injection of 100 µL luciferin, and the final analysis was performed on day 17 (n = 5 mice per group). (E) AX reduced tumor burden with respect to tumor weight 0.24 ± 0.01 g vs vehicle 1.6 ± 0.6 g (P = .04; 1-tailed t test). (F) Immunoblot analysis of tumor samples derived from mice treated with AX revealed downregulation of BCR-ABL1 kinase activity and its associated downstream signaling pathways involving Stat5a and Crkl. (G) Immunoblot analysis of tumor samples derived from mice after treatment with AX. Samples displayed no HSR, as evaluated by expression of HSF-1, HSP70, and HSP27; PDI and HSP60 were used as controls. Columns depict the mean of 3 independent experiments (n = 3). Significance analyses of normally distributed data with variance similar between groups used paired, 2-tailed Student t test. *P < .05, **P < .005, ***P < .001.
Figure 5.
Figure 5.
Efficacy of AX in TKI-resistant leukemic cell line models. (A) IM-resistant K562, KCL22, SUP-B15, and BA/F3-expressing BCR-ABL1T315I, T315I (PNr) along with their respective normal cell lines were treated with second- and third-generation TKIs (dasatinib, nilotinib, radotinib, bosutinib, befetinib, and ponatinib) at 7 different concentrations (ranging from 50 nM to 25 µM) for 72 hours. Later, the average IC50 was determined and plotted on a heat map. (B) BA/F3 cells expressing BCR-ABL1T315I, T315I (PNr), M351T, and E255K mutants, K562 IMr, KCL22 IMr, and SUP-B15 IMr cells were treated with the indicated concentration of AX (48 hours) and later enzymatic activity of caspase-3/7 were examined by caspase-3/7 dependent-Glo assay (absorbance at 405 nm). (C) Likewise, in human leukemia cell lines, AX causes downregulation of BCR-ABL1 and subsequently its associated downstream signaling pathways, including Stat5a, Akt, and Bcl-2 in BA/F3 cells expressing BCR-ABL1T315I, T315I (PNr), M351T, and E255K mutants. (D) Normal BA/F3 cells, BA/F3-expressing BCR-ABL1T315I and T3151 (PNr) mutants, and K562 IMr cells were seeded in methylcellulose medium containing respective compounds at indicated concentration after treatment in liquid medium for 24 hours. Colonies were counted after 14 days. Significance analysis of normally distributed data with variance similar between groups used paired, 2-tailed Student t test. *P < .05, **P < .005, ***P < .001.
Figure 6.
Figure 6.
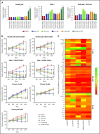
AX suppresses human LSCs and acts in a reasonable therapeutic window. (A) One BCR-ABL1+ CML patient sample and a relapse BCP-ALL patient sample, along with a healthy human-CB-derived CD34+CD38+/− (sorted by MACS) sample, were treated with increasing concentrations of AX or controls (NB, AUY922, or IM). Later, the enzymatic activity of caspase-3/7 was examined using a caspase-3/7–dependent Glo assay after 5 days of treatment. (B) Primary patient samples along with healthy control cells (including primary B, T, and NK cells) were treated with the indicated concentration of AX or controls (NB, AUY922, or IM), and viable cells were counted after every 24-hour interval for 5 days. AX specifically targets leukemic samples (both the leukemic bulk and leukemic stem cell fractions) contrary to healthy control cells. (C) Supernatants were collected from primary T, NK, and B cells after 48-hour treatment with respective compound and then evaluated for the detection of 25 different human cytokines. Heat maps depict the fold difference relative to the control (DMSO) in picograms per milliliter. Some cytokines were omitted from the analysis because their concentration was below the detection limit. (D) CD34+CD38+/− cells from 2 BCR-ABL1+ CML (CML-1 and CML-2) patient samples and 1 TKI-resistant BCR-ABL1+ BCR-ALL patient sample, along with healthy CB controls, were seeded in methylcellulose medium containing respective compounds at the indicated concentration after treatment in liquid medium for 24 hours. Colonies were counted after 14 days (n = 5). Significance analysis of normally distributed data with variance similar between groups used a paired, 2-tailed Student t test. *P < .05, **P < .005, ***P < .001. IFNa, interferon α; GM-CSF, granulocyte-macrophage colony-stimulating factor; TNFa, tumor necrosis factor α.
Figure 6.
Figure 6.
AX suppresses human LSCs and acts in a reasonable therapeutic window. (A) One BCR-ABL1+ CML patient sample and a relapse BCP-ALL patient sample, along with a healthy human-CB-derived CD34+CD38+/− (sorted by MACS) sample, were treated with increasing concentrations of AX or controls (NB, AUY922, or IM). Later, the enzymatic activity of caspase-3/7 was examined using a caspase-3/7–dependent Glo assay after 5 days of treatment. (B) Primary patient samples along with healthy control cells (including primary B, T, and NK cells) were treated with the indicated concentration of AX or controls (NB, AUY922, or IM), and viable cells were counted after every 24-hour interval for 5 days. AX specifically targets leukemic samples (both the leukemic bulk and leukemic stem cell fractions) contrary to healthy control cells. (C) Supernatants were collected from primary T, NK, and B cells after 48-hour treatment with respective compound and then evaluated for the detection of 25 different human cytokines. Heat maps depict the fold difference relative to the control (DMSO) in picograms per milliliter. Some cytokines were omitted from the analysis because their concentration was below the detection limit. (D) CD34+CD38+/− cells from 2 BCR-ABL1+ CML (CML-1 and CML-2) patient samples and 1 TKI-resistant BCR-ABL1+ BCR-ALL patient sample, along with healthy CB controls, were seeded in methylcellulose medium containing respective compounds at the indicated concentration after treatment in liquid medium for 24 hours. Colonies were counted after 14 days (n = 5). Significance analysis of normally distributed data with variance similar between groups used a paired, 2-tailed Student t test. *P < .05, **P < .005, ***P < .001. IFNa, interferon α; GM-CSF, granulocyte-macrophage colony-stimulating factor; TNFa, tumor necrosis factor α.

Comment in

Similar articles

Cited by

References

    1. Mahalingam D, Swords R, Carew JS, Nawrocki ST, Bhalla K, Giles FJ. Targeting HSP90 for cancer therapy. Br J Cancer. 2009;100(10):1523-1529. - PMC - PubMed
    1. Khajapeer KV, Baskaran R. Hsp90 inhibitors for the treatment of chronic myeloid leukemia. Leuk Res Treatment. 2015;2015:757694. - PMC - PubMed
    1. Lazenby M, Hills R, Burnett AK, Zabkiewicz J. The HSP90 inhibitor ganetespib: A potential effective agent for Acute Myeloid Leukemia in combination with cytarabine. Leuk Res. 2015;39(6):617-624. - PMC - PubMed
    1. Miyata Y, Nakamoto H, Neckers L. The therapeutic target Hsp90 and cancer hallmarks. Curr Pharm Des. 2013;19(3):347-365. - PMC - PubMed
    1. Yamaki H, Nakajima M, Shimotohno KW, Tanaka N. Molecular basis for the actions of Hsp90 inhibitors and cancer therapy. J Antibiot (Tokyo). 2011;64(9):635-644. - PubMed

Publication types

MeSH terms