. 2018 May 4;360(6388):eaap7847.
doi: 10.1126/science.aap7847.

Uncovering the essential genes of the human malaria parasite Plasmodium falciparum by saturation mutagenesis

Affiliations

Uncovering the essential genes of the human malaria parasite Plasmodium falciparum by saturation mutagenesis

Min Zhang et al. Science. .

Abstract

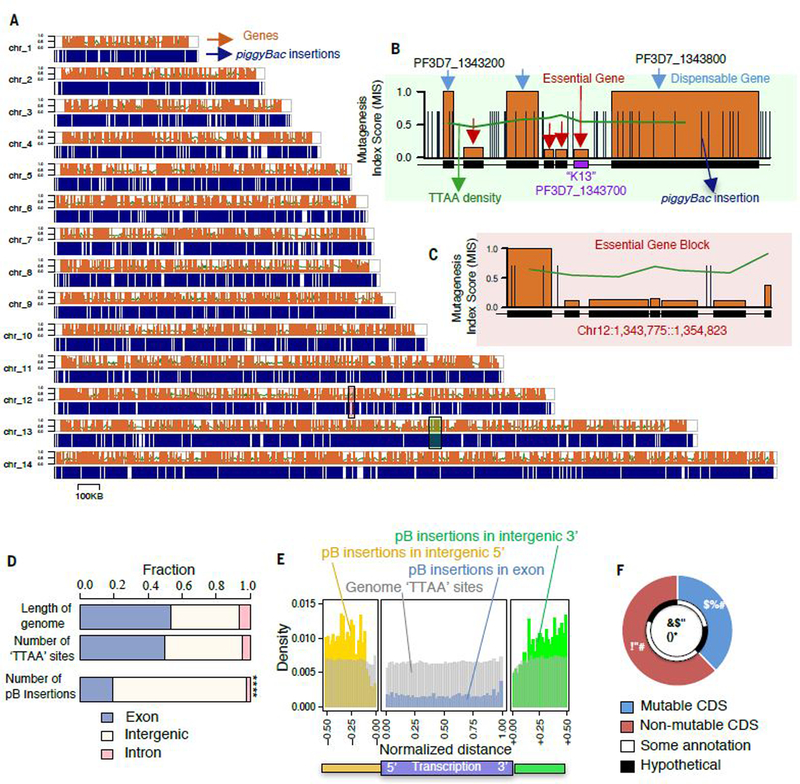
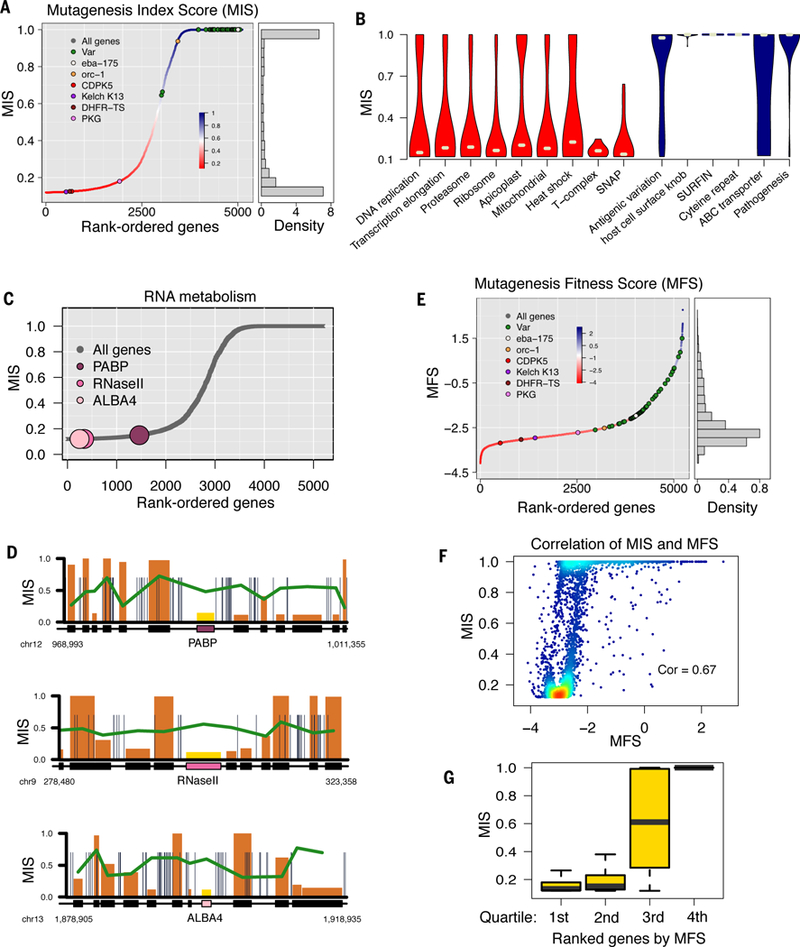
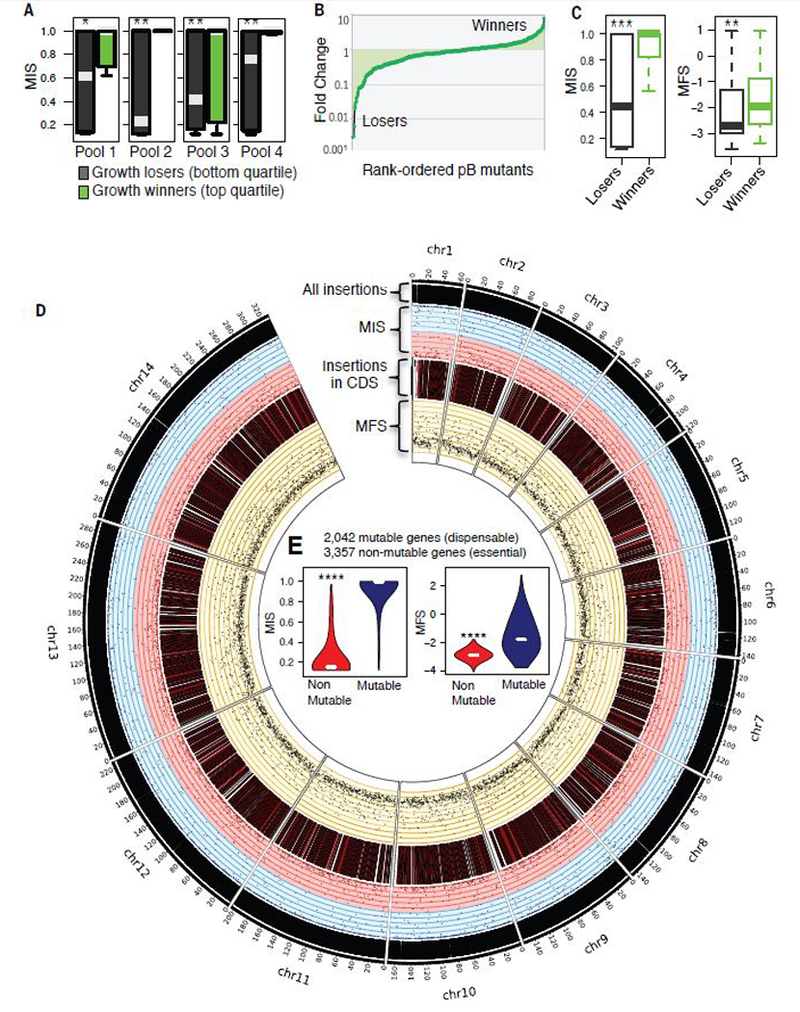
Severe malaria is caused by the apicomplexan parasite Plasmodium falciparum. Despite decades of research, the distinct biology of these parasites has made it challenging to establish high-throughput genetic approaches to identify and prioritize therapeutic targets. Using transposon mutagenesis of P. falciparum in an approach that exploited its AT-rich genome, we generated more than 38,000 mutants, saturating the genome and defining mutability and fitness costs for over 87% of genes. Of 5399 genes, our study defined 2680 genes as essential for optimal growth of asexual blood stages in vitro. These essential genes are associated with drug resistance, represent leading vaccine candidates, and include approximately 1000 Plasmodium-conserved genes of unknown function. We validated this approach by testing proteasome pathways for individual mutants associated with artemisinin sensitivity.


Conflict of interest statement

Competing interests: U.S. patent 7932088 (26 April 2011), “High efficiency transformation of Plasmodium falciparum by the Lepidopteran transposon, piggyBac,” is held by inventors J.H.A., M. J. Fraser Jr., B. Balu, and D. A. Shoue. The invention relates to use of piggyBac as a tool for genetic manipulation of the Plasmodium genome.

Figures

Fig. 1.
Fig. 1.. A genome-wide saturation mutagenesis screen for Plasmodium falciparum.
(A) Chromosomal map displays 38,173 piggyBac insertion sites from all mutants evenly distributed throughout the genome. (B) High-resolution map of a ~50 KB region of chromosome 13 depicts an essential gene cluster, including K13, flanked by dispensable genes with multiple CDS-disrupting insertions. (C) High-resolution map of a ~20 KB region without insertions includes three conserved genes of unknown function (PF3D7_1232700, PF3D7_1232800, PF3D7_1232900) and a putative nucleotidyltransferase (PF3D7_1232600) (see also fig. S5). (D) A plot of all piggyBac insertions revealed significantly fewer insertions were recovered from exon-intron regions compared to the proportion of available TTAA sites (see also fig. S1D) (p < 2.2e-16, Fisher’s Exact test). (E) Density of piggyBac insertion-site distribution revealed threefold fewer insertions recovered in transcriptional regions (blue) than intergenic 5ʹ (yellow) and 3ʹ (green) regions, depicted as relative distance upstream and downstream to a gene, respectively. (F) This study determined that under ideal culture conditions for asexual blood-stage growth, 38% of genes in the P. falciparum genome have mutable CDSs, while 62% of genes have non-mutable CDSs.
Fig. 2.
Fig. 2.. Identification of dispensable and essential genes through Mutagenesis Index Score (MIS) and Fitness Score (MFS).
(A) The Mutagenesis Index Score (MIS) rates the potential mutability of P. falciparum genes based on the number of recovered CDS insertions relative to the potential number that could be recovered. Genes known as dispensable or essential are highlighted. (B) MIS violin plots of GO processes grouped from lowest to highest dispensability, according to gene functional annotations. (C) MIS plots and (D) high-resolution chromosome maps highlighting important genes of interest for RNA metabolism [−20kb, +20kb] (see also fig. S4 for MIS plots of other genes of interest. (E) The Mutagenesis Fitness Score (MFS) estimates the relative growth fitness cost for mutating a gene based on its normalized QIseq sequencing reads distribution. (F) MIS has significant correlation to MFS (Pearson’s R = 0.67, p < 2.2e-16 compared with permutation). (G) The first and second MFS quartiles were comprised primarily of non-mutable genes, the 4th quartile was comprised mostly of mutable genes, and 3rd quartile had nearly equal numbers of both.
Fig. 3.
Fig. 3.. Validation of mutagenesis score through phenotype screen.
(A) Competitive growth assays of asexual blood-stage growth under ideal in vitro culture conditions: phenotypes of four independent mixed-population pools grown for three cycles confirmed losers (left, bottom quantile) and winners (right, top quartile) had significantly different MIS. (B) Overall rank-ordered plot of competitive growth phenotypes shows losers and winners. (C) Competitive growth ‘losers’ had significantly lower MIS and MFS, respectively, validating MIS and MFS as predictor of gene essentiality and dispensability. (D) Circos plot from outer to inner shows the distribution of all piggyBac insertions, MIS (pink indicates MIS < 0.5, while blue is >0.5), CDS insertions, and MFS along each chromosome of P. falciparum genome. (E) Violin plots indicate non-mutable genes had significantly lower MIS and MFS (‘****’ represents Wilcoxon p < 2.2e-16).
Fig. 4.
Fig. 4.. Chromosomal syntenic breakpoints are enriched in dispensable genes.
(A) Genes within conserved syntenic blocks have significantly lower MIS and MFS (Wilcoxon p < 2.2e-16). Syntenic genes or “syntenic block” is defined as at least three genes in the same order on the same chromosome as their orthologs in another species within a 25-kb search window. (B and C) Scatter plots show the insertion site enrichment along two syntenic breakpoints (Ch13:2,110,000 −2,135,000, Chr10: 642000–666000). Each gap in synteny (white area) is enriched for piggyBac insertions while flanked by essential regions (green shading); black boxes represent the location of CDS. (D and E) Circos plots indicate the syntenic blocks of P. falciparum in relation to other Plasmodium spp. (P. berghei, P. chabaudi, P. knowlesi, P. vivax).
Fig. 5.
Fig. 5.. Distinct biological process and evolutionarily conservation segregate the tendency of dispensable and essential genes.
(A) The genes with lowest FPKM expression value (first quantile) among different stages were enriched for dispensable genes (Wilcoxon P < 2.2e-16 compared with other quantiles)(26). The expression level cut off is set at 20 FPKM. (B) Non-mutable essential genes had significantly higher expression value for blood-stage development. (C) The group of trophozoite-stage genes had the highest proportion of essential genes (red) whereas gametocyte genes had the highest proportion of dispensable genes (blue) (Wilcoxon p < 1e-12). (D to F) Characteristics of essential genes significantly different from dispensable genes include: (D) 1:1 ortholog conserved among Plasmodium spp; (E) absence of paralogs; and (F) reduced rate of non-synonymous to synonymous SNPs. Bars indicate the group median (‘****’ indicates Wilcoxon p < 2.2e-16). (G and H) Essential genes reported in (G) Toxoplasma and (H) P. berghei showed significantly lower MIS in this mutagenesis screen of P. falciparum (‘****’ indicates Wilcoxon p < 2.2e-16). (I). Plot of Receiver Operating Characteristics (ROC) indicate the level of retention of essential genes across species. The MIS of P. falciparum more strongly correlates with the essentiality phenotype of P. berghei than Toxoplasma.
Fig. 6.
Fig. 6.. Differentiating dispensable and essential genes and discovering high-priority druggable targets and pathways.
(A) Functional annotations of biological processes are represented by the p-value and the X-axis shows the fraction of the genes with MIS > 0.5. Each GO term is assigned a p-value on the Y-axis to represent the tendency to be essential or dispensable. Essentiality is indicated on a spectrum of red (essential) to blue (dispensable) and circle sizes indicate the GO term enrichment. (B and C) Boxplot of (B) molecular processes and (C) cellular components shows the MIS distribution generated by 1000× sampling of the number of genes in the query GO-term category. Left (red) and right (blue) triangles indicate GO terms with significantly lower or higher MIS (p-value < 0.05 compared to background), respectively; the heatmap represents the essentiality defined as the fraction of genes per GO term with MIS > 0.5.

Comment in

  • Indispensable malaria genes.
    White J, Rathod PK. White J, et al. Science. 2018 May 4;360(6388):490-491. doi: 10.1126/science.aat5092. Science. 2018. PMID: 29724941 Free PMC article. No abstract available.

References

    1. Ashley EA et al., Spread of artemisinin resistance in Plasmodium falciparum malaria. N Engl J Med 371, 411–423 (2014). - PMC - PubMed
    1. Woodrow CJ, White NJ, The clinical impact of artemisinin resistance in Southeast Asia and the potential for future spread. FEMS Microbiol Rev, (2016). - PMC - PubMed
    1. Gardner MJ et al., Genome sequence of the human malaria parasite Plasmodium falciparum. Nature 419, 498–511 (2002). - PMC - PubMed
    1. Ghorbal M et al., Genome editing in the human malaria parasite Plasmodium falciparum using the CRISPR-Cas9 system. Nature biotechnology, (2014). - PubMed
    1. Wagner JC, Platt RJ, Goldfless SJ, Zhang F, Niles JC, Efficient CRISPR-Cas9-mediated genome editing in Plasmodium falciparum. Nature methods 11, 915–918 (2014). - PMC - PubMed

Publication types