. 2018 May 3;9(1):1777.
doi: 10.1038/s41467-018-04179-8.

Clinical and genomic landscape of gastric cancer with a mesenchymal phenotype

Affiliations

Clinical and genomic landscape of gastric cancer with a mesenchymal phenotype

Sang Cheul Oh et al. Nat Commun. .

Abstract

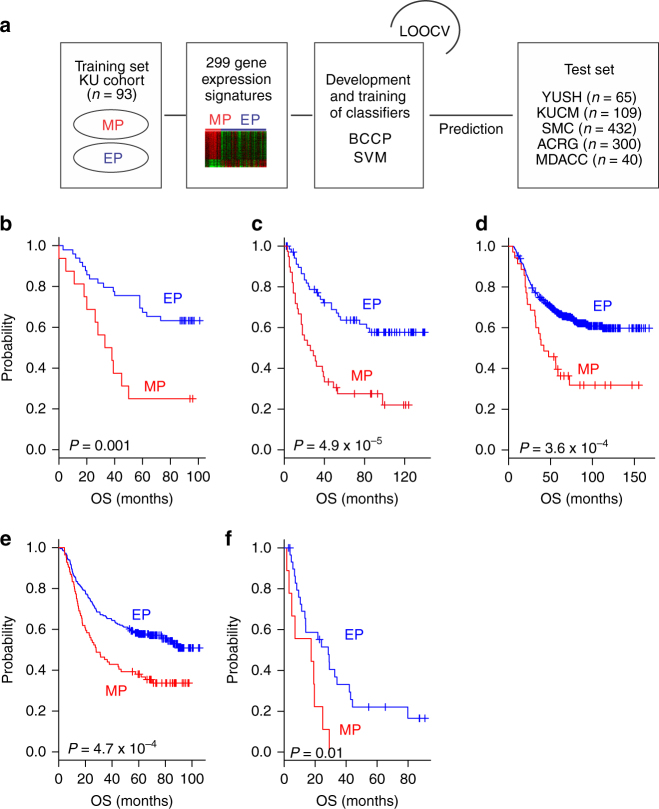
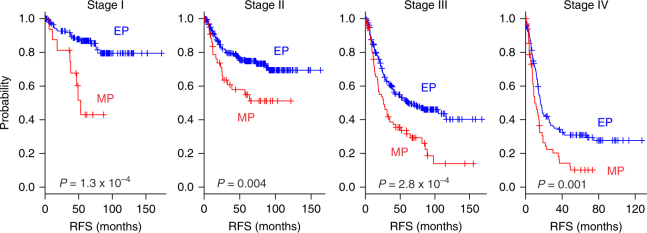
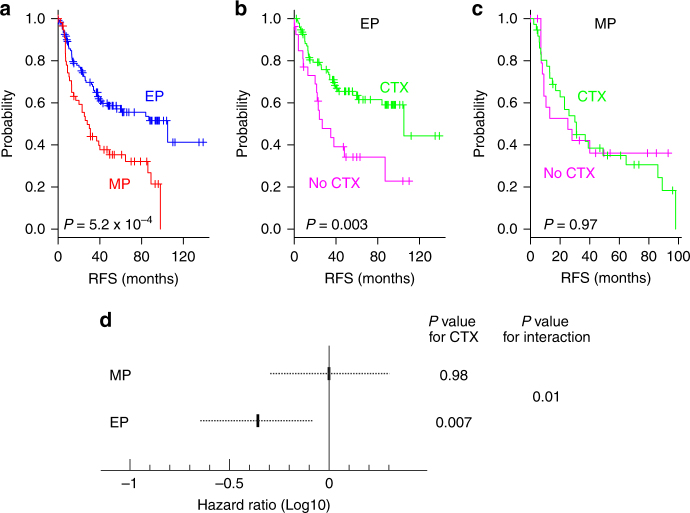
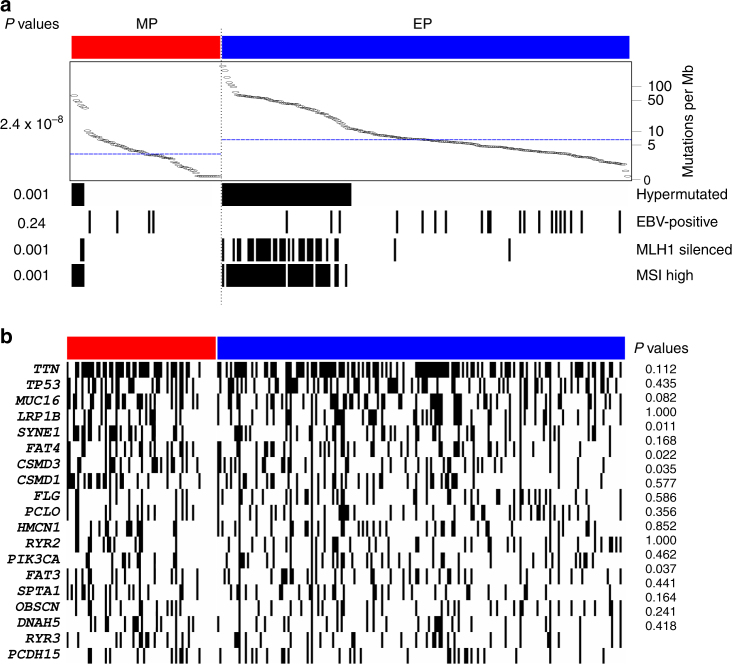
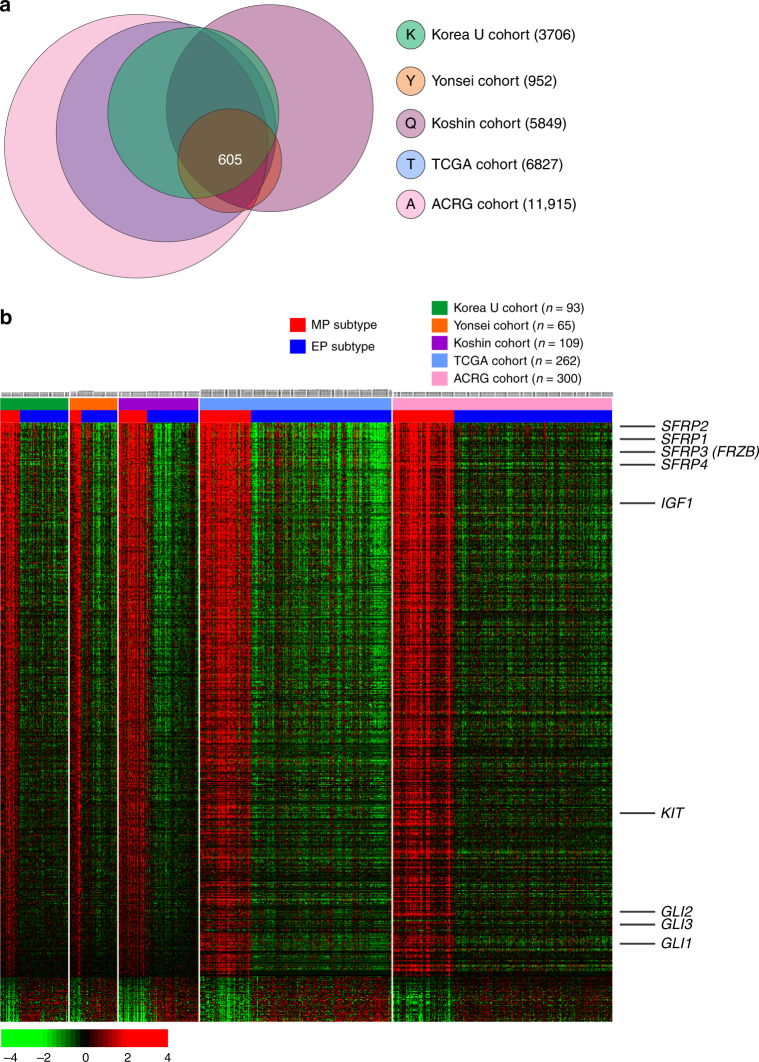
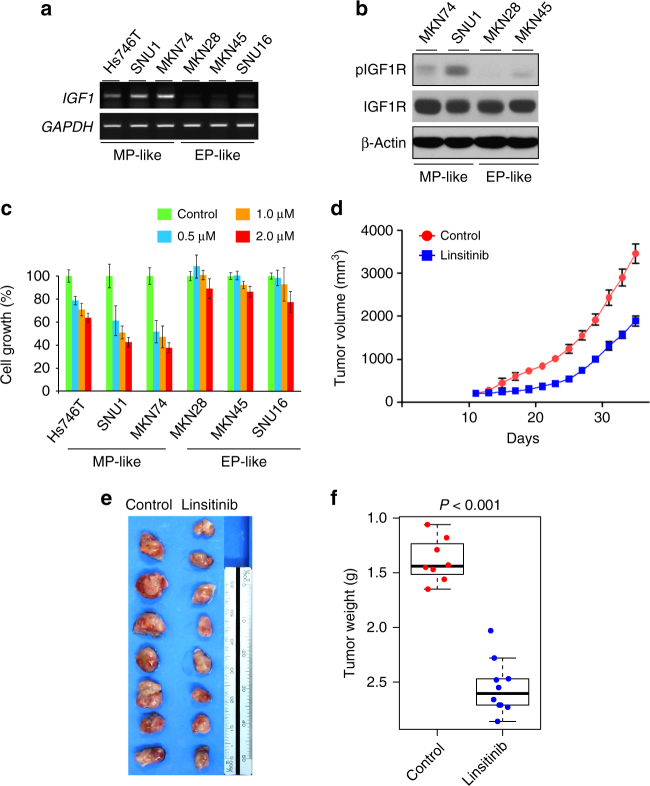
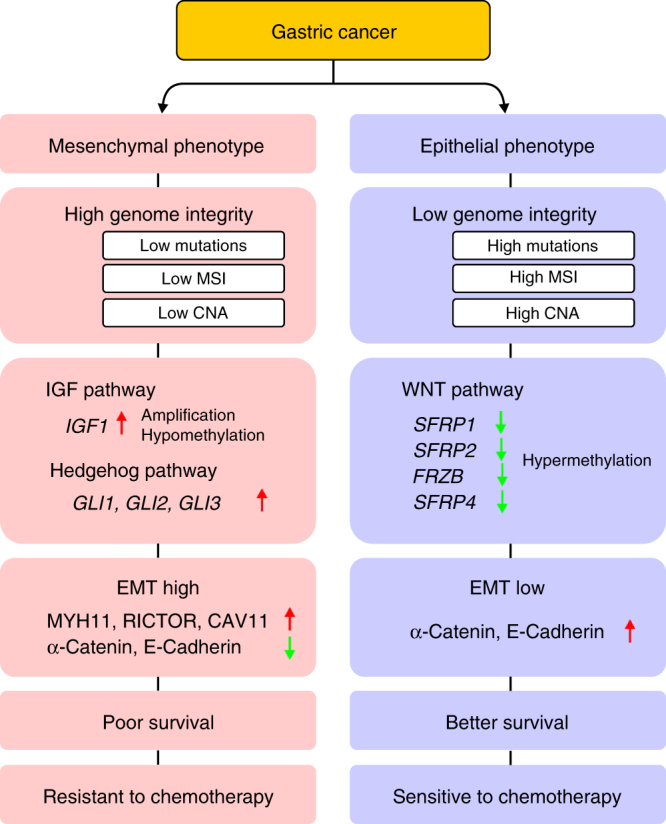
Gastric cancer is a heterogeneous cancer, making treatment responses difficult to predict. Here we show that we identify two distinct molecular subtypes, mesenchymal phenotype (MP) and epithelial phenotype (EP), by analyzing genomic and proteomic data. Molecularly, MP subtype tumors show high genomic integrity characterized by low mutation rates and microsatellite stability, whereas EP subtype tumors show low genomic integrity. Clinically, the MP subtype is associated with markedly poor survival and resistance to standard chemotherapy, whereas the EP subtype is associated with better survival rates and sensitivity to chemotherapy. Integrative analysis shows that signaling pathways driving epithelial-to-mesenchymal transition and insulin-like growth factor 1 (IGF1)/IGF1 receptor (IGF1R) pathway are highly activated in MP subtype tumors. Importantly, MP subtype cancer cells are more sensitive to inhibition of IGF1/IGF1R pathway than EP subtype. Detailed characterization of these two subtypes could identify novel therapeutic targets and useful biomarkers for prognosis and therapy response.


Conflict of interest statement

The authors declare no competing interests.

Figures

Fig. 1
Fig. 1
Hierarchical clustering analysis of gene expression data from the Korea University Guro Hospital (KUGH) cohort. a Hierarchical clustering of gene expression data from 93 patients with gastric cancer and 3 patients with a gastrointestinal stromal tumor (GIST) located in the stomach in the KUGH cohort (n = 93). Genes with an expression level that had at least a twofold difference relative to the median value across tissues in at least 15 tissues were selected for hierarchical clustering analysis (3931 gene features). The data are presented in a matrix format in which each row represents an individual gene and each column represents a tissue sample. Each cell in the matrix represents the expression level of a gene feature in an individual tissue sample. The red and green coloring in the cells reflects relatively high and low expression levels, respectively, as indicated in the scale bar (log2 transformed scale). b, c Kaplan–Meier plots of the two gastric cancer clusters in the KUGH cohort (n = 93). The three patients with GIST were excluded for plotting. P values were obtained using the log-rank test. The + symbols indicate censored data. EP epithelial phenotype, MP mesenchymal phenotype, OS overall survival, RFS recurrence-free survival
Fig. 2
Fig. 2
Construction of prediction models in the validation cohorts. a A schematic overview of the strategy used to construct prediction models and evaluate predicted outcomes on the basis of gene expression signatures. EP epithelial phenotype, MP mesenchymal phenotype, BCCP Bayesian compound covariate predictor, SVM support vector machine, LOOCV leave-one-out cross-validation, YUSH Yonsei University Severance Hospital, KUCM Kosin University College of Medicine, SMC Samsung Cancer Research Institute, ACRG Asian Cancer Research Group, MDACC The University of Texas MD Anderson Cancer Center. bf Kaplan–Meier plots of overall survival (OS) in patients with EP or MP subtype gastric cancer predicted by BCCP in the YUSH cohort (b), KUCM cohort (c), SMC cohort (d), ACRG (e), and MDACC cohort (f). P values were obtained using the log-rank test. The + symbols in the panels indicate censored data
Fig. 3
Fig. 3
Prognostic significance of mesenchymal phenotype (MP) independent of AJCC stages. When patients were stratified according to stages in the pooled cohort (KUGH, YUSH, KUCM, SMC, and ACRG in total of n = 999), MP remained associated with poor prognosis regardless of stages. P values were obtained using the log-rank test. The + symbols in the panels indicate censored data. EP epithelial phenotype, MP mesenchymal phenotype, RFS recurrence-free survival
Fig. 4
Fig. 4
Clinical significance of MP subtype. ac Kaplan–Meier plots of recurrence-free survival (RFS) in patients with American Joint Committee on Cancer (AJCC) stage II, III, or IV disease without distant metastasis. Analysis was performed for this subset of patients pooled from three cohorts (Korea University Guro Hospital, Yonsei University Severance Hospital, and Kosin University College of Medicine cohorts; n = 180). a Kaplan–Meier plots of RFS among patients with each subtype of gastric cancer (EP epithelial subtype, MP mesenchymal subtype). b, c Kaplan–Meier plots of RFS among patients who received adjuvant chemotherapy (CTX) and those who did not (No CTX) for each tumor subtype. P values were obtained using the log-rank test. d Interaction of tumor subtype with adjuvant chemotherapy in patients with gastric cancer. The Cox proportional hazards regression model was used to analyze the interaction between tumor subtype and adjuvant chemotherapy (CTX). The dotted lines represent the 95% confidence intervals of the hazard ratios. EP epithelial phenotype, MP mesenchymal phenotype
Fig. 5
Fig. 5
Genomic landscape of mesenchymal phenotype (MP) and epithelial phenotype (EP) subtypes of gastric cancer. a Genomic and histologic data were retrieved from The Cancer Genome Atlas project database and analyzed (n = 262). Tumors with greater than 11.4 mutations/Mb were classified as hypermutated tumors. ALL P values were obtained using χ2 tests except for mutation rates. P values for mutation rates were obtained using Student’s t-test (two-sided). b Mutational landscape of two subtypes in TCGA cohort. Most frequently mutated genes in TCGA data are presented (20 genes)
Fig. 6
Fig. 6
Subtype-specific gene expression patterns conserved in five cohorts of patients with gastric cancer. a Venn diagram of genes with expression that differed significantly between the mesenchymal phenotype (MP) and epithelial phenotype (EP) subtypes in five different cohorts (KUCM Kosin University College of Medicine, KUGH Korea University Guro Hospital, TCGA The Cancer Genome Atlas, YUSH Yonsei University Severance Hospital, ACRG Asian Cancer Research Group). Gene expression differences were considered statistically significant at P < 0.001 by Student’s t-test. This stringent significance threshold was used to limit the number of false-positive findings. Expression of only 605 genes was upregulated or downregulated in all five cohorts. b Expression patterns of selected genes. The colored bars at the top of the heat map represent samples as indicated
Fig. 7
Fig. 7
Activation of IGF1/IGF1R pathway in the mesenchymal phenotype (MP) subtype of gastric cancer. a Copy number amplification and hypomethylation status of the IGF1 gene in MP subtype tumor samples (n = 70) from The Cancer Genome Atlas (TCGA) cohort. Hypomethylation of the promoter region was determined by comparison with methylation of surrounding normal tissues (<0.6). EP epithelial phenotype. b Expression of IGF1 in MP subtype tumors, stratified by IGF1 gene amplification in the cancer genome. A: amplification of IGF1, N: normal copy number, ST: surrounding tissue. Differences between ST and MP groups were significant (P < 0.05 by Student’s t-test). Colored lines indicate the median, boxes extend from the 25th to the 75th percentile, and dashed error bars extend to the 10th and 90th percentiles. c Promoter methylation of the IGF1 gene (probe ID, cg01305421) in each subtype of gastric cancer and ST in the TCGA tumor samples. Colored lines indicate the median, boxes extend from the 25th to the 75th percentile, and dashed error bars extend to the 10th and 90th percentiles. Differences between ST and MP groups were significant (P < 0.05 by Student’s t-test). d Correlation between mRNA expression and promoter methylation (β-value), estimated using Pearson's correlation. e Western blot analysis for IGF1R, phospho-IGF1R, SMAD1/2, and phospho-SMAD2/3. Activation of IGF1R and SMAD2/3 was determined by western blot with phosphorylation-specific antibodies as indicated. β-Actin was used as loading control. f, g Activation of IGF1R and SMAD2/3 in gastric cancer and normal gastric tissues is estimated by ratios of phosphorylated form over all proteins. P values for mutation rates were obtained using Student’s t-test (two-sided)
Fig. 8
Fig. 8
IGF1/IGF1R pathway is therapeutic target for MP subtype. a Expression of IGF1 in gastric cancer cell lines. Expression was measured by qRT-PCR. b Western blot analyses in gastric cancer cell lines of MP subtype cells (MKN74 and SNU1) and EP subtype cells (MKN28 and MKN45) using antibodies against phosphorylated IGF1R (active), IGF1R (total), and β-actin. c Sensitivity of gastric cancer cell lines to linsitinib, inhibitor of IGF1R. Cell growth was measured at 96 h after treatment of linsitinib as indicated (n = 4). d Growth of SNU1-derived xenograft tumors in mice treated with linsitinib or vehicle control. SNU1 cells were xenografted subcutaneously into the flanks of mice. At 10 days after xenografting, linsitinib or control tartaric acid was orally administrated to mice. Tumor volume was measured on the indicated days. Error bars indicate s.e.m. e Tumors harvested after treatment of linsitinib or control vehicle. f Tumor weight after treatment of linsitinib. At 25 days after linsitinib treatment, mice were killed and tumor weights were measured (n = 8 or 9 per treatment). Data are presented with means. P values were obtained by Student’s t-test
Fig. 9
Fig. 9
Summary of characteristics of the two subtypes of gastric cancer. CNA copy number alteration, EMT epithelial-to-mesenchymal transition, MSI microsatellite instability

Comment in

References

    1. Torre LA, et al. Global cancer statistics, 2012. CA Cancer J. Clin. 2015;65:87–108. doi: 10.3322/caac.21262. - DOI - PubMed
    1. Hundahl SA, Phillips JL, Menck HR. The National Cancer Data Base Report on poor survival of U.S. gastric carcinoma patients treated with gastrectomy: Fifth Edition American Joint Committee on Cancer staging, proximal disease, and the “different disease” hypothesis. Cancer. 2000;88:921–932. doi: 10.1002/(SICI)1097-0142(20000215)88:4<921::AID-CNCR24>3.0.CO;2-S. - DOI - PubMed
    1. Van Cutsem E, Sagaert X, Topal B, Haustermans K, Prenen H. Gastric cancer. Lancet. 2016;388:2654–2664. doi: 10.1016/S0140-6736(16)30354-3. - DOI - PubMed
    1. Cunningham D, et al. Perioperative chemotherapy versus surgery alone for resectable gastroesophageal cancer. N. Engl. J. Med. 2006;355:11–20. doi: 10.1056/NEJMoa055531. - DOI - PubMed
    1. Macdonald JS, et al. Chemoradiotherapy after surgery compared with surgery alone for adenocarcinoma of the stomach or gastroesophageal junction. N. Engl. J. Med. 2001;345:725–730. doi: 10.1056/NEJMoa010187. - DOI - PubMed

Publication types

MeSH terms